I know, of course. I was (jokingly) comparing to the Netherlands in the past
13.02.2026 13:08 — 👍 2 🔁 0 💬 0 📌 0
Just their livers though. Also, it's no longer as common here.
13.02.2026 12:54 — 👍 1 🔁 0 💬 1 📌 0

Postdoctoral researcher on applications of AI in sociological research
Are you able to lead sociological research into the AI age?
📢WORK! At the Sociology department of @utrechtuniversity.bsky.social we are hiring a postdoc who will work on applications of AI in sociological research. Join our vibrant-yet-cohesive research community doing cutting-edge research. Please share or apply! www.uu.nl/en/organisat...
12.02.2026 11:11 — 👍 11 🔁 20 💬 0 📌 0

A meta-analysis on reducing discrimination finds:
1) passive interventions, such as short-term education or bias reminders, are ineffective
2) targeting behavior directly to inhibit bias (eg making individuals accountable or changing social norms) is helpful
psycnet.apa.org/doiLanding?d...
11.02.2026 14:32 — 👍 52 🔁 33 💬 1 📌 2
I feel like there's a lot of missed opportunities for cool titles here
11.02.2026 13:25 — 👍 0 🔁 0 💬 0 📌 0
Earlier, I voiced my doubts here about a recent PNAS paper claiming that an alleged "rise in connectivity" explains an increase in polarization. PNAS was kind enough to publish our comments this week: www.pnas.org/doi/10.1073/...
11.02.2026 12:32 — 👍 7 🔁 1 💬 1 📌 0
Van de 18 ministerskandidaten zijn er acht jonger dan ik. Toch best confronterend.
10.02.2026 08:05 — 👍 0 🔁 0 💬 0 📌 0

Computational Social Science of Social Cohesion and Polarization
This open access book explores the decay of social cohesion in democratic societies through the lens of Computational Social Science (CSS)
Today Springer published an Open Access book edited by @janlo.de , Marijn Keijzer and myself covering a diverse range of Computational Social Science approaches to questions about social cohesion and polarization. Come and get it at link.springer.com/book/10.1007...
🧵1/4
09.02.2026 10:18 — 👍 15 🔁 13 💬 3 📌 0
Looks great, congratulations!
09.02.2026 14:43 — 👍 2 🔁 0 💬 0 📌 0
Back to good old telephone surveys, or pen-and-paper
09.02.2026 14:40 — 👍 0 🔁 0 💬 0 📌 0

Bluesky Map
Interactive map of 3.4 million Bluesky users, visualised by their follower pattern.
I made a map of 3.4 million Bluesky users - see if you can find yourself!
bluesky-map.theo.io
I've seen some similar projects, but IMO this seems to better capture some of the fine-grained detail
08.02.2026 22:59 — 👍 7105 🔁 2144 💬 651 📌 4580
Nope
05.02.2026 14:18 — 👍 0 🔁 0 💬 1 📌 0

Do ordinary Republicans and Democrats really avoid each other in everyday life? In a new working paper with Delia Baldassarri, we present descriptive and experimental evidence to challenge the view that partisanship drives the formation of social relationships.
osf.io/preprints/so...
1/15
02.02.2026 14:24 — 👍 82 🔁 32 💬 2 📌 4

Aan dit soort berichtgeving hebben we weinig. Wat is een "AI-camera"? nos.nl/ttapp
31.01.2026 13:45 — 👍 0 🔁 0 💬 0 📌 0
Interesting work, but what do the linksin the network mean?
31.01.2026 12:40 — 👍 1 🔁 0 💬 1 📌 0

How AI assistance impacts the formation of coding skills
Anthropic is an AI safety and research company that's working to build reliable, interpretable, and steerable AI systems.
“We found that using AI assistance led to a statistically significant decrease in mastery.”
Props to Anthropic for studying the effects of their creation and reporting results that are not probably what they wished for
www.anthropic.com/research/AI-...
31.01.2026 03:50 — 👍 510 🔁 185 💬 14 📌 37

Let wel:
De Staatscommissie Parlementair Stelsel (cie-Remkes) pleitte weloverwogen tégen een hogere kiesdrempel. Er zijn aanpassingen mogelijk die minder verstoren (oa aantal benodigde handtekeningen voor verkiezingsdeelname).
De commissie pleitte ook níét voor hervorming kiesstelsel Eerste Kamer.
30.01.2026 12:41 — 👍 49 🔁 23 💬 7 📌 2
Die CEO is werkgever van o.a. softwareontwikkelaars; zijn ervaring met AI op de werkvloer vind ik wel relevant. Voor universitaire opleidingen is het op dit gebied nu grotendeels gissen wat de arbeidsmarkt wil.
28.01.2026 14:03 — 👍 1 🔁 0 💬 0 📌 0
goddamn it.
26.01.2026 14:28 — 👍 7 🔁 1 💬 0 📌 0
“Shut up!” screamed Toad.
26.01.2026 14:37 — 👍 274 🔁 64 💬 10 📌 13
OK, check, NOS = vijand, staat genoteerd. En even voor de zekerheid: mensen die doelbewust de vrije pers ondermijnen?
25.01.2026 12:00 — 👍 0 🔁 0 💬 1 📌 0
Uiteraard mag je kritiek hebben op verslaggeving, maar ongefundeerd twijfel zaaien over onafhankelijke media is wel glad ijs; daarmee speel je autoritaire regimes juist in de kaart. Ik zou dus terughoudend zijn met op elke slak zout leggen. Ogen op de bal: de NOS is hier echt niet de vijand.
25.01.2026 11:11 — 👍 0 🔁 0 💬 1 📌 0
Onderaan die pagina nog een link naar een kritische reportage over ICE. Je moet wel heel opzichtig selectief lezen om in de NOS-berichtgeving impliciete steun voor Trump te zien
25.01.2026 10:38 — 👍 0 🔁 0 💬 1 📌 0
Dat doen ze dan ook niet in hun eerdere(!) berichtgeving over de schietpartij, waarin de reactie van Walz eerst aan bod komt en pas daarna de "verdediging" door de regering, die vervolgens expliciet door de NOS in twijfel getrokken wordt.
25.01.2026 10:38 — 👍 1 🔁 0 💬 1 📌 0
Ik weet niet hoor, de NOS rapporteert gewoon wat de reactie van de regering was, en suggereert nergens dat die lezing klopt. Dat de lokale autoriteiten die lezing bestrijden staat er ook gewoon in.
25.01.2026 10:09 — 👍 2 🔁 0 💬 3 📌 0
We've had similar discussions about Israel here, eg, doesn't boycotting Israeli universities hurt especially those who are most critical of the war? The answers to such questions are not trivial, and opinions were (and are) extremely divided
23.01.2026 19:27 — 👍 1 🔁 0 💬 1 📌 0
PhD Researcher at EUI. Interested in the intersection of Social Media and Politics.
Postdoctoral Researcher | PLANET-NL Project | University of Amsterdam
Philosopher @utrechtuniversity.bsky.social, a PI with the #ESDiT research consortium on "Ethics of Socially Disruptive Technologies". Organizing the #procrastination2025utrecht conference July 9-11, 2025. More info here: https://edu.nl/pjuhx
Educational realist, Diehard edu myth-buster, Grumpy Old Man, Emeritus Prof. Educational Psychology Open Universiteit, Guest Prof. Thomas More Uni (Belgium), owner kirschner-ED
Professor of Political Science, Xavier University
Irish Politics, Northern Ireland, the Irish Diaspora in the US, Political Culture, US Foreign Policy, and the Politics of War and Peace
Currently working on power transition theory in Northern Ireland
EU Horizon Europe project Longitudinal Educational Achievements: Reducing iNequalities (LEARN)
#LEARNINEQ
helsinki.fi/learn
Associate Professor of Teaching & Director of Undergraduate Studies, Dept. of Sociology, University of California, San Diego. Views are my own.
Ik had alles willen houden wat het was. Freelance journalist (media/tech) voor o.a. NRC. Nieuwsbrief over misinformatie en mediahypes: https://dehypeisreal.substack.com/. Eindredacteur/samensteller FD. Antropoloog. Darter? Foto: Lara Varat
Postdoctoral Prize Research Fellow, Nuffield College, University of Oxford
PhD from European University Institute
Sociologist + feminist
Behavioural change | Gender-inclusive language
Postdoctoral Prize Research Fellow in Sociology at @NuffieldCollege @UniofOxford | social integration, voluntary organizations, residential segregation, intermarriage
Legal theory & philosophy @ Maastricht University (NL). Interests: non-human agents and the social construction of (legal) reality, law & cognitive science. Also: plants, cats, food, hiking, mostly at @gardenandlibrary.bsky.social
Dagelijkse cartoon van www.foksuk.nl
Governance - climate - sustainability - music - antifa
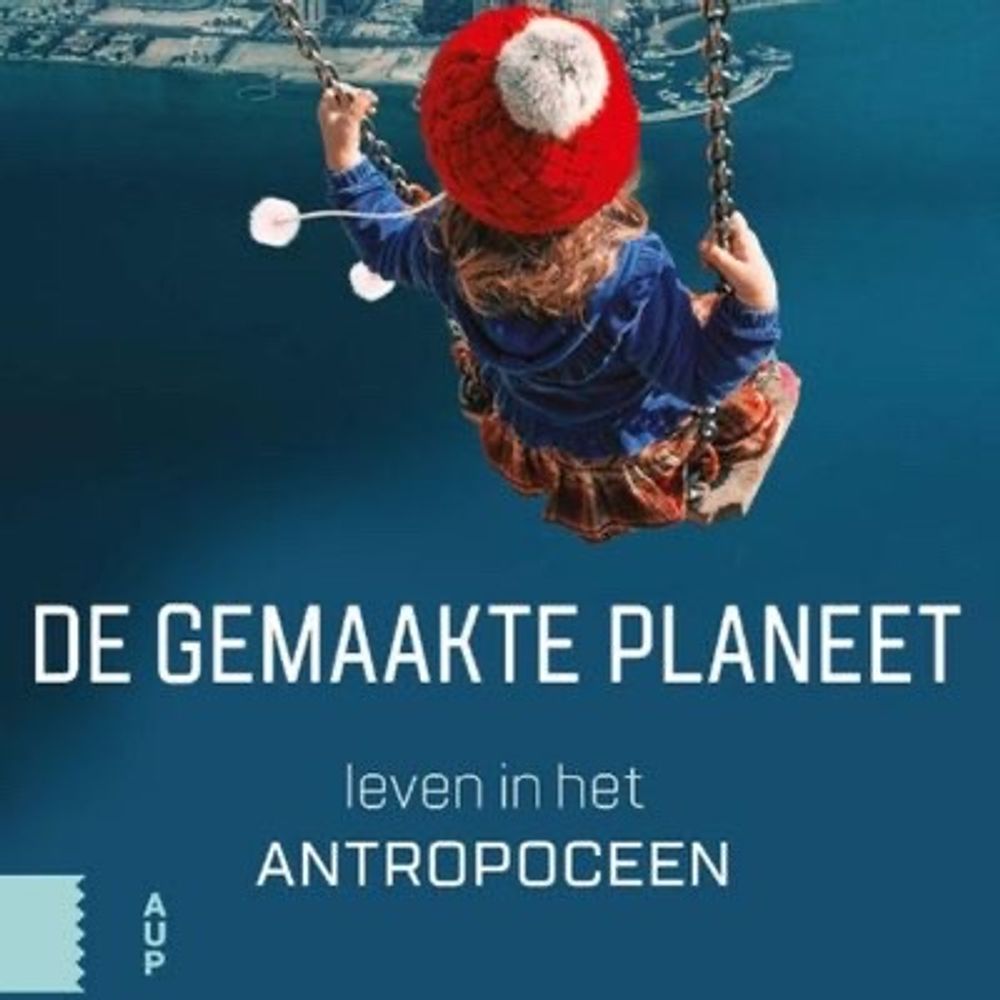
https://www.walburgpers.nl/nl/book/9789463721219/de-gemaakte-planeet
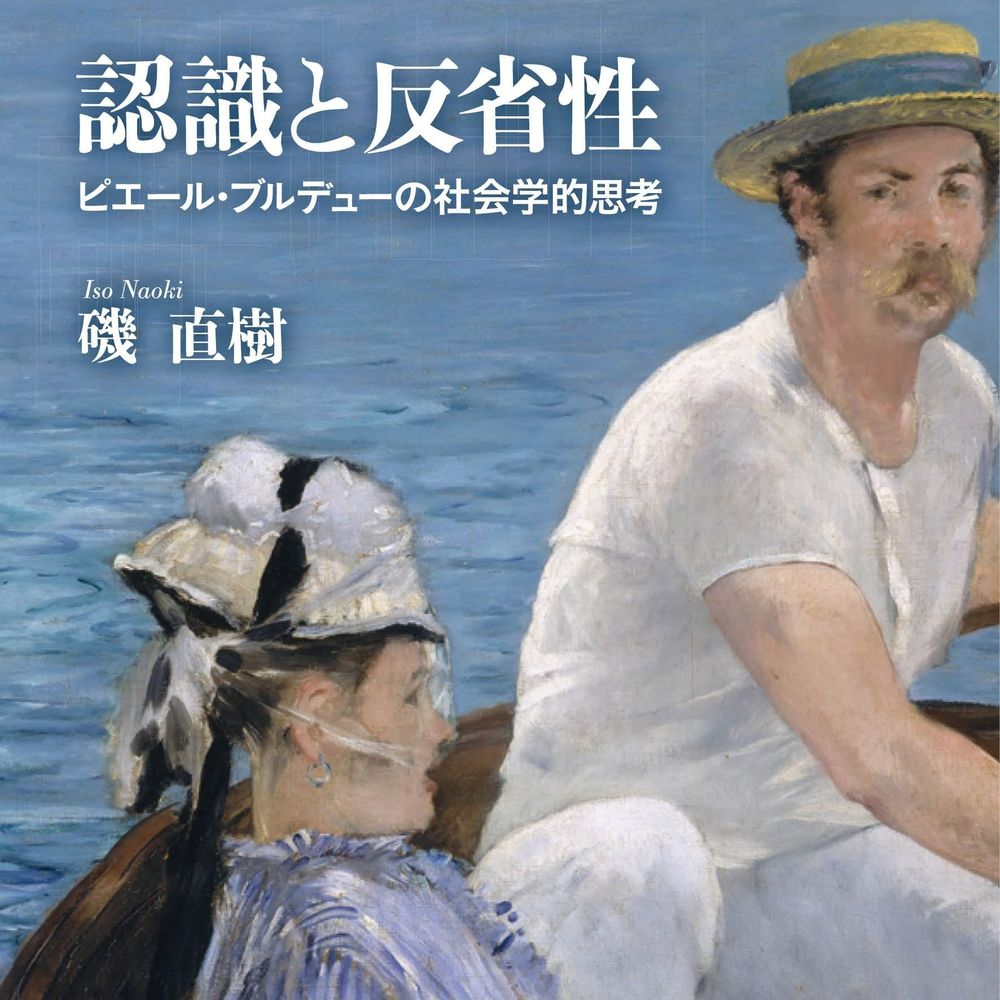
Sociologist studying inequality, class, immigration, culture and art, also researching history of sociology with focus on Bourdieu's theories. Project Associate Professor at Tokyo University of the Arts.
Centre for Democracy and Technology Europe 🇪🇺 Advancing EU law and tech policy with a focus on democracy and human rights.
Part of @cdt.org's Global team.
https://cdt.org/eu/
Historian | Author of ‘Utopia for Realists’ (2014), ‘Humankind’ (2020) and ‘Moral Ambition’ (2025) | Co-founder of The School for Moral Ambition | moralambition.org | rutgerbregman.com
Stichting Caring Farmers staat samen met 400 boeren voor een duurzaam en dierwaardig voedselsysteem. Dat kunnen boeren niet alleen. Help mee, en sluit je aan als Caring Consument of Caring Farmer! https://caringfarmers.nl
🌍 Wetenschap die helpt de samenleving beter te begrijpen
💡 In duidelijke taal
📰 Nieuws, inzichten en successen van onze onderzoekers
🌐 uva.nl/fmg
Our research seeks to uncover how people interact within civil society organizations and how those interactions can strengthen organizations, promote civic engagement, and improve the quality of life in communities.