Paper day! My latest first-author work is out!! TLDR: I built a suite of simulations based on SIMBA that varies the energetic efficiency of different modes of AGN feedback. We explored how these modes impacted different galaxy and gas properties and uncovered degeneracies in the parameter space 🧪🔭
23.02.2026 15:58 — 👍 26 🔁 3 💬 3 📌 0
I just set up Litestream on a side project a couple weeks ago. Super easy and works great.
19.02.2026 20:14 — 👍 2 🔁 0 💬 0 📌 0

A 1990s "Read" poster with Miss Piggy lounging and reading dressed as Cleopatra and Kermit standing behind her dressed as Julius Ceasar holding a stack of books. The caption at the bottom reads: "some of you are looksmaxxing when you need to be booksmaxxing"
My best attempt
18.02.2026 23:50 — 👍 168 🔁 32 💬 2 📌 3

Chord diagram showing the connections of various Pokémon types to each other for Pokémon with 2 types. Shows a lot of connections between Normal type and Flying type. Grass, Flying, Poison, Bug, and Water have some of the most connections, while Ice, Fire, and Electric have some of the fewest connections.
A chord diagram is a fun way to visualize connections. It can show both which values are most connected & which have the fewest/most connections.
In a recent post, I walked through creating a chord diagram using Holoviews from a dataframe. Check it out: frankcorso.me/chord-diagra...
18.02.2026 15:18 — 👍 0 🔁 0 💬 0 📌 0

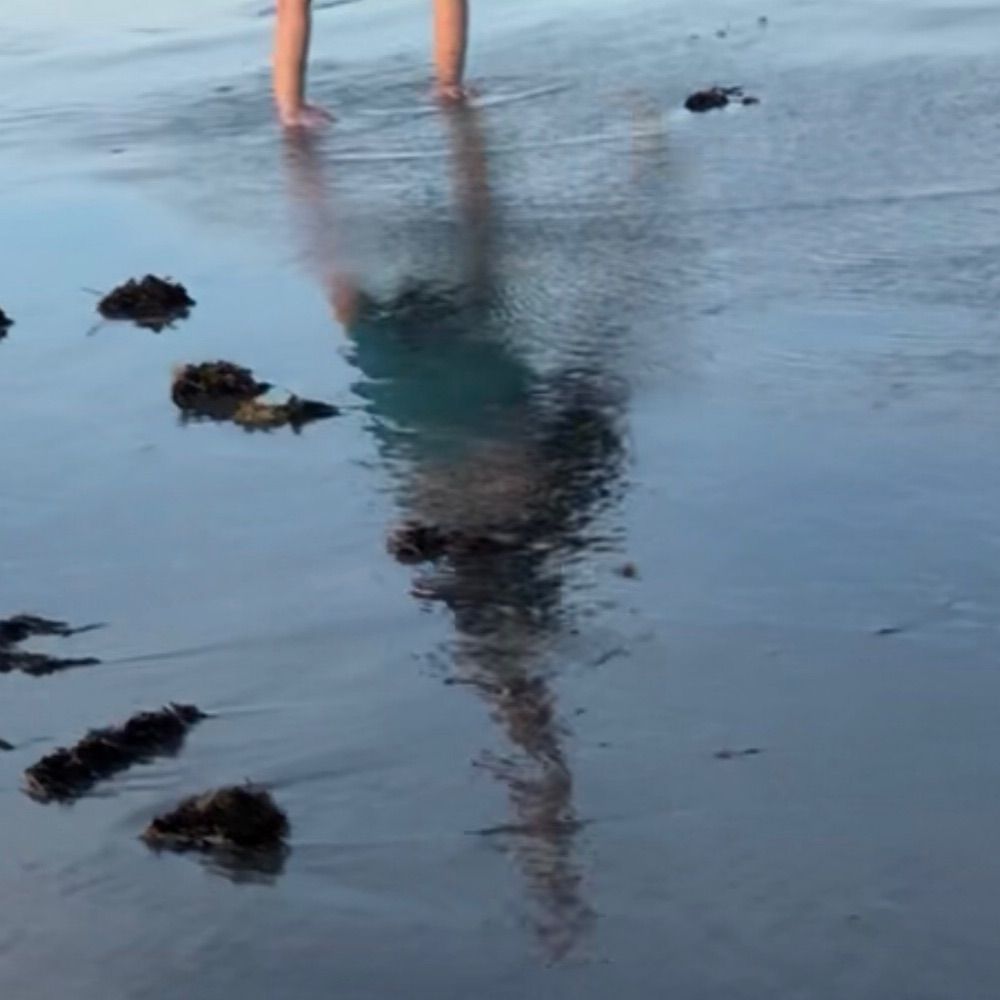
illustration of world map showing pinpoints for shark attacks clustered heavily around the Australian and United States coasts with the label Shark Bites 2025, all of which are detailed in reports and charts through the linked article

a graphic titled Shark Bites 2025 with a pie charts showing the top 7 states by shark bites and tips to reduce risks, as well as several stats all presented in detail on the report story in link. The top states in order are Florida, California, Hawaii, South Carolina, New York, North Carolina and Texas. Notes are the 100 percent drop in bites over 2024, and that there are 548 known shark species but only 13 known to have bitten people 10 or more times ever

a bar chart covering thirty years from 1996 through 2025 with the very lower part of each bar in orange showing fatalities and the rest of each bar in yellow showing bites, highlighting 20 year global average of 71 bites and 6 fatalities, and a chart that shows2025 higher than 2024 but lower than 2023, all information available in detail on the report story in link
Our annual shark bite report for 2025 is now available online. The global shark bite numbers return to average last year, with a smaller proportion in the United States.
📉 Full story and data: www.floridamuseum.ufl.edu/science/glob...
Summary report: www.floridamuseum.ufl.edu/shark-attack...
18.02.2026 14:50 — 👍 11 🔁 4 💬 0 📌 0
YouTube video by Stephen Robles
Apple Is Taking on YouTube with iOS 26.4
Today, Apple Podcasts announced a new "video podcast experience."
For anyone interested, @stephenrobles.com has a nice overview of hwo it works here:
www.youtube.com/watch?v=xu_k...
16.02.2026 22:49 — 👍 6 🔁 3 💬 0 📌 1

Top of the page on the new GNV Tech Chats website. Says "Where Gainesville's tech community connects" with a description of "Connect with developers, designers, AI engineers, and tech enthusiasts. Whether you're a seasoned pro or just starting out, you belong here."
Now that GNV Tech Chats has >200 Meetup members, I want to build a presence outside Meetup to make it easier to find, and have an email newsletter that includes other tech events around town. Spending some time today creating the basic landing page for it: gnvtechchats.com
#GNV #Gainesville
16.02.2026 17:50 — 👍 0 🔁 0 💬 0 📌 0
We are announcing "Python Unplugged on PyTV"!
Join us for a free online conference bringing together the leading voices of the #Python community.
📺 Live on YouTube
🗓 March 4, 2026
⏰ 11:00 am – 6:30 pm CET
The best of Python, straight to your living room. Save the date: https://jb.gg/ztocbe
11.02.2026 14:01 — 👍 17 🔁 15 💬 4 📌 3
RDM Weekly - Issue 032
A weekly roundup of Research Data Management resources.
Happy Love Data Week! 💘
Issue 32 of RDM Weekly is out!
➡️ Creating a Data Sharing Community @harvarddataverse.bsky.social
➡️ Affording Reusable Data @nature.com
➡️ README Checklist @christophscheuch.bsky.social
➡️ Project Management Tools
and more!
#rdmweekly
rdmweekly.substack.com/p/rdm-weekly...
10.02.2026 14:21 — 👍 12 🔁 7 💬 0 📌 0
In case you missed it: my full, free, open course on accessibility and visualization is out!
08.02.2026 12:36 — 👍 51 🔁 20 💬 1 📌 0
Of course, revenue only reflects raw sales, and we'd have to look at profit and EBITA to really see where the differences are. But, it was still fun to explore with.
06.02.2026 16:25 — 👍 0 🔁 0 💬 0 📌 0
After removing them, I noticed a couple of interesting points:
1. CVS is grouped closer to the healthcare and tech companies than the retail companies
2. Exxon Mobil has extremely high revenue per employee, even higher than a lot of tech companies
06.02.2026 16:25 — 👍 0 🔁 0 💬 1 📌 0
I discovered that Walmart and Amazon have 5x as many employees as the next companies, so I couldn't even see most of the companies on the chart with them in it. I didn't realize just how large their workforce is.
06.02.2026 16:25 — 👍 0 🔁 0 💬 1 📌 0

Scatterplot with title of Revenue vs Number of Employees for Fortune 500. The number of employees goes 0 to over 400,000 and revenue goes 0 to over 400 billion dollars in USD. Some of the outliers are labelled, such as Target and Home Depot having higher employees but only mid-range of revenue with CVS, Alphabet, Apple, and Exxon Mobile having much higher revenue with fewer employees.
I am working on a new guide for creating scatterplots with the Python Seaborn package and thought I'd use a Fortune 500 dataset for the examples. I was curious to see how revenue compares against the number of employees.
#DataAnalysis
06.02.2026 16:25 — 👍 0 🔁 0 💬 1 📌 0
Introducing the Data Checkup: A Framework for Assessing the Health of Federal Datasets | America's Data Index
We are excited to launch the Data Checkup–a health check for federal data collections.
The Data Checkup is a comprehensive framework for assessing the health of federal data collections, highlighting key dimensions of risk and presenting a clear status of data well-being.
Learn more below.
05.02.2026 17:10 — 👍 2 🔁 3 💬 0 📌 1
IMPORTANT ANNOUNCEMENT
As of January 1st 2026, John and I are **no longer** the owners of Complexly (the educational media company we started 15 years ago that makes Crash Course, Eons, SciShow, Study Hall, and a bunch of other shows.)
We have been the sole owners for all that time...
04.02.2026 16:11 — 👍 2897 🔁 240 💬 59 📌 44

Finally! My book Super Nintendo is out TODAY in the US + Canada. Here's where to buy it: www.penguinrandomhouse.com/books/753986...
"MacDonald is one of the best games journalists... Here is a book bursting with love. Bop your head against it and see if a shower of gold coins comes out." -The Times
03.02.2026 13:53 — 👍 267 🔁 46 💬 13 📌 4

Analyzing Data with AI Assistants Join us with Sara Altman Tues, Feb 3 @ 12 pm ET pos.it/dslab
Join us on Tuesday at the Data Science Lab 🧪 We are joined by @sara-altman.bsky.social, who will show us how to explore and analyze data using AI assistants in #RStats or #Python!
Feb 3 @ 12 pm ET: pos.it/dslab
02.02.2026 15:09 — 👍 18 🔁 9 💬 0 📌 1

The Séance of Blake Manor's lead designer on why she made the game's clock so important
“I am a woman in her 40s who has the brain of a turnip.”
i talked to the lead designer for Seance of Blake Manor, one of my favorite mystery games of last year. it's not as brain-destroying as something like Blue Prince and that's very much by design. you can walk away and come back to it, for example www.mothership.blog/seance-of-bl...
29.01.2026 14:04 — 👍 394 🔁 74 💬 7 📌 8

Teapot and mug featuring Messier 78
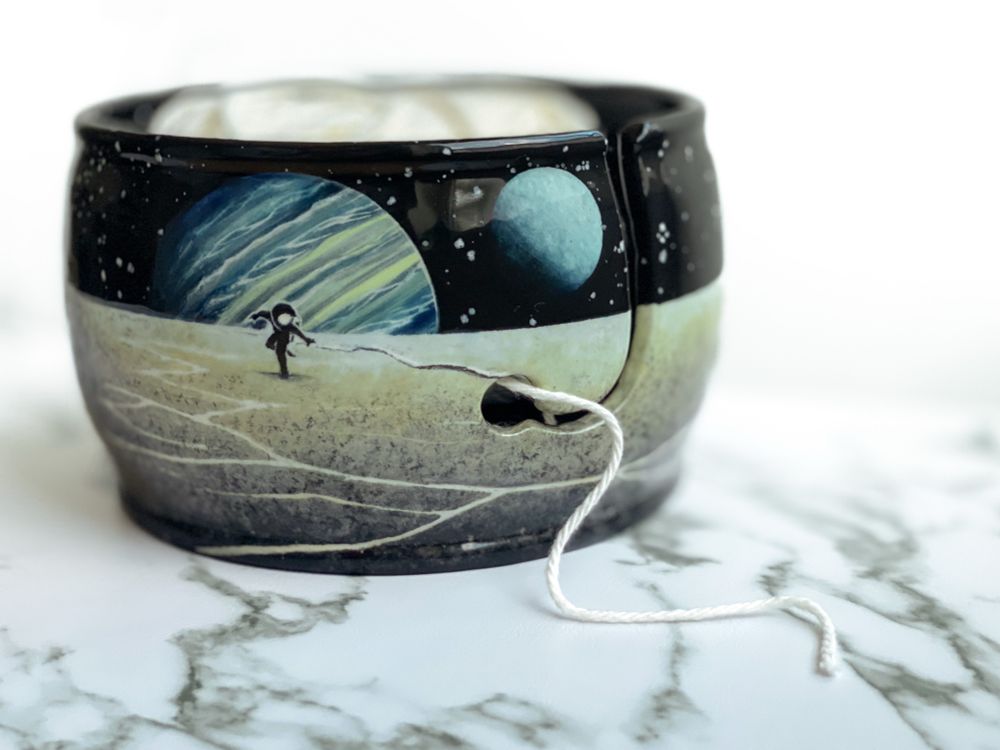
Yarn bowl featuring astronaut running along barren landscape under a large exoplanets while trying to catch a tether that leads to the yarn feed.

Angled cup featuring Pismis 24

Yarn bowl featuring a winding teal imagined nebula.
A reminder that commissions open Saturday, 10am PT!
If you have a vision for a space tea set or other item to enjoy in a moment of self care, now is the time ✨
FAQ:
Amyraehill.com/commissions
#sciart
29.01.2026 16:38 — 👍 92 🔁 23 💬 0 📌 1

Calling folks working in a #DataScience (or related) role 📣 – we want you to fill out our survey aiming to understand if and how practicing data scientists use and integrate #LLMs 🤖 into their data science tasks.
www.linkedin.com/posts/tiffan...
29.01.2026 17:53 — 👍 2 🔁 3 💬 1 📌 0

A hot spooky girl with black lipstick is in a stained glass window with echinacea and underneath the words Plant Native Plants in a spooky font
I was gonna hold off on releasing these shirts, BUT they are sick as hell & I wanted to show you.
Imagine a world... in which Goth Girls Gardened...
GASP! You're living in that world RIGHT NOW.
Bring the Goth into Gardening at SquidFacts.net
Designed by the amazing @seaofdoom.bsky.social
28.01.2026 23:16 — 👍 324 🔁 96 💬 22 📌 10
Holy moly this chart: Cumulative US measles cases
28.01.2026 12:54 — 👍 4679 🔁 2243 💬 203 📌 642
Who are your favorite critics, historians, academics, reporters, and/or authors with expertise in Zelda?
22.01.2026 00:30 — 👍 40 🔁 3 💬 24 📌 1
Cool idea
21.01.2026 15:05 — 👍 0 🔁 0 💬 0 📌 0
Interpreting EEG requires understanding how the skull smears electrical fields as they propagate from the cortex. I made a browser-based simulator for my EEG class to visualize how dipole depth/orientation change the topomap.
dbrang.github.io/EEG-Dipole-D...
Github page: github.com/dbrang/EEG-D...
20.01.2026 17:00 — 👍 123 🔁 49 💬 4 📌 1
This is in 12 minutes!! Come see how to structure your R projects so that Future You doesn't hate Past You 😂
#rstats #databs
Also, be nice to me, my eye is all messed up and I can't see well today 🙈 See you there!!
20.01.2026 16:49 — 👍 18 🔁 2 💬 0 📌 0
NEW BOOK: Twin Wolves: Balancing risk and reward to make the most of AI
https://twinwolvesai.com/
research: (ML+gen)AI, risk, complexity, finance history
work: https://WorkWithQ.com
newsletter: https://complex-machinery.com
(some posts in 🇫🇷 🇩🇪 🇷🇺)
UMass faculty. Notre Dame & UMass alum. Studies rivalry, identity, social sport consumption. Has unabated love of data. Causes existential crises through Excel.
data viz engineer @ourworldindata.org
Associate Professor of Psychology UMich. Cognitive neuroscience of multisensory perception, neural oscillations, and brain tumor physiology. 🏳️🌈
sites.lsa.umich.edu/brang-lab/
tacos 🌮
data 📊
bees 🐝
mountains 🏔️🏕️🧗🏽♀️
fiber arts 🪡🧵🧶
baking 🧁🍰🍪🥐🍞
helping my kids collect hobbies 📷⚾️💃🏽🎶🤸🏽♀️🪴🎮
trying to keep it all together 🙃🍷
she/her/ella
Hobby consultant, 💎🪚🎮🖥️🎙️🎹🎧👨🍳📷🪛➕
Quant UX Researcher @ [Home] (posts are my own)
Writes a data newsletter: https://www.counting-stuff.com/
https://linktr.ee/randy_au
Languages: EN/JP/CN
Comics by Jorge Cham: Oliver's Great Big Universe, Elinor Wonders Why, ScienceStuff and PHD Comics
Full-stack product developer (Rails/React) in Salt Lake City, UT. I love enlivening experiences, visualizing data, and making playful websites.
📚 Founder @hardcover.app
🎧 Developer @libro.fm
✍️ Blogger @ https://adamfortuna.com
📊 data visualization engineer, 💊 healthcare analytics consultant, 🐶 dog mom, 🌱 vegan for the animals.
https://nicolemark.heygrid.co/
Math, graphics, maps, trail running. he/him
https://rreusser.github.io/
Smart Home reviewer at The Verge. www.theverge.com/authors/jennifer-tuohy
Social networking technology created by Bluesky.
Developer-focused account. Follow @bsky.app for general announcements!
Bluesky API docs: docs.bsky.app
AT Protocol specs: atproto.com
host and founder, Post Games
co-host, The Besties
https://www.patreon.com/c/PostGames
https://postgame.substack.com/
https://podcasts.apple.com/us/podcast/post-games/id1815131711
Signal: plante.01
Data viz enthusiast. Bookworm.
Github: https://github.com/DevJupyHUB/
Ph.D, stats lover/writer✍🏼, #statistics #scicomm #datascience #statstiktok 👩🏻💻 she/her
freelance science and environmental journalist, marathoner, basketball junkie, silly goose, ten TKs in a trench coat
Signal: jasonpdinh.30
www.jasonpdinh.com
Creator of @fastapi.tiangolo.com, Typer, SQLModel, Asyncer, etc 🚀
From 🇨🇴 in 🇩🇪
Open Source, APIs, and tools for data/ML 🤖
Building @fastapicloud.com ⚡️
I make science videos and podcasts!
🎧 podcast: Tiny Matters
editorial assistant for hank green
This is an automated account to show trending git repositories on https://tangled.org (not affiliated with tangled, but I am a big fan)
This account is not monitored please contact @baileytownsend.dev about any issues
Chief Scientific Officer, Lieber Institute and Professor, Johns Hopkins School of Medicine studying molecular regulation across species in circuits impacted in complex brain disorders. Native plants/flowers/wetland habitats. Own opinions.