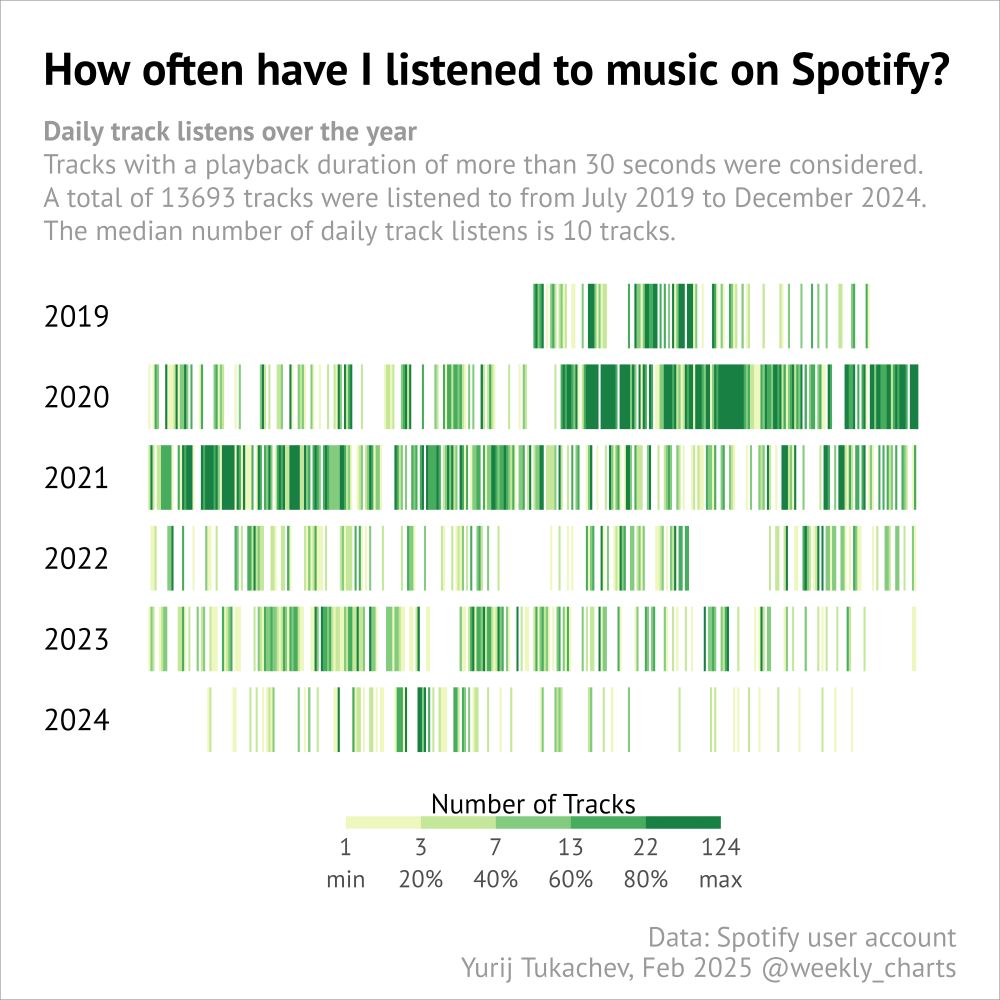
Updated My Spotify Stripes Chart
I’ve refreshed my chart, tentatively titled Spotify Stripes. In 2024, I’ve noticeably spent less time on Spotify — not because I switched to another streaming service.
#stripes_chart #spotify #R #ggplot2 #quantified_self
11.02.2025 15:09 — 👍 3 🔁 0 💬 0 📌 0
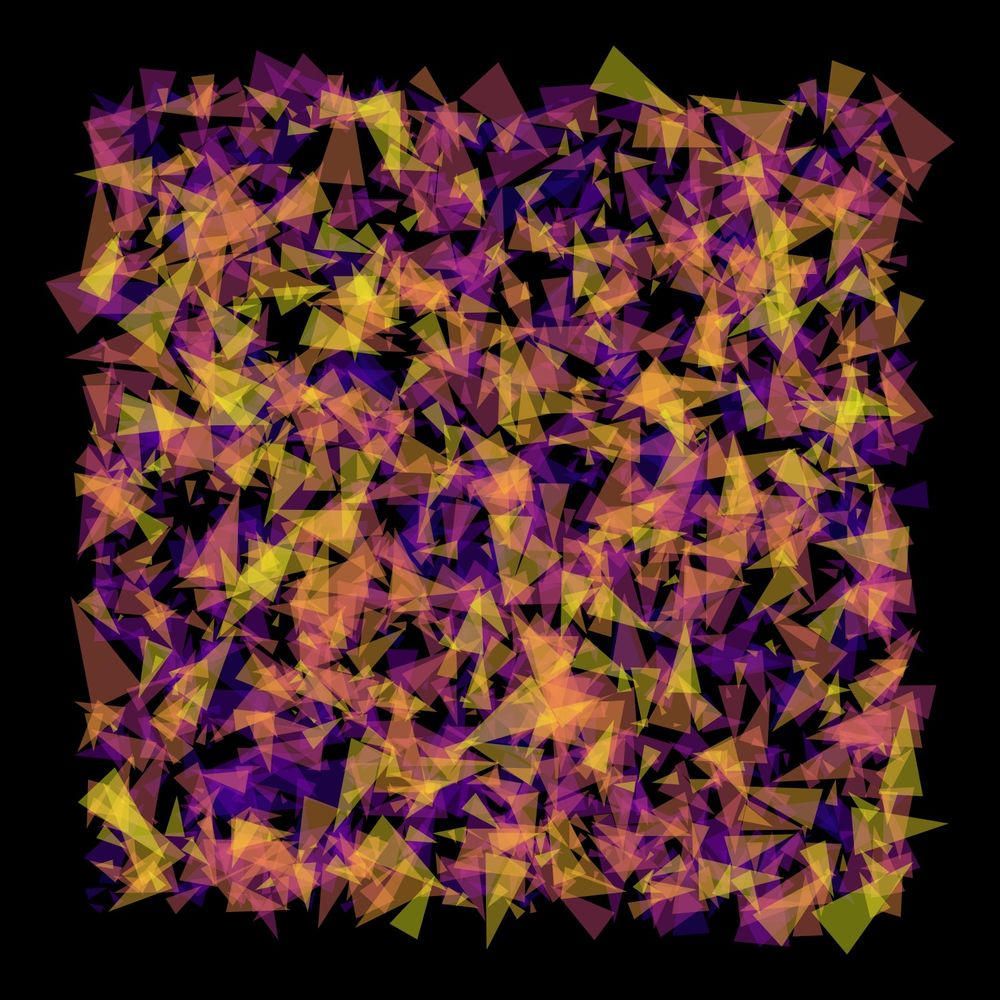
🎨 Genuary 2025 Day 13: Triangles and nothing else.
2025 Triangles and nothing else.
#Genuary #R #ggplot2 #Genuary2025 #GenerativeArt #Genuary13
24.01.2025 10:07 — 👍 6 🔁 0 💬 0 📌 0
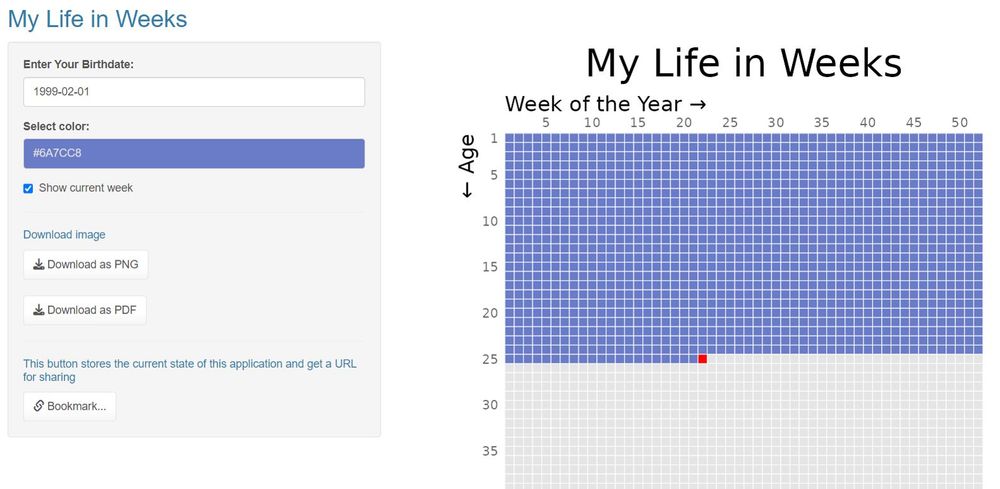
My Life in Weeks
This application creates an interactive visualization called "My Life in Weeks". It uses the Shiny package to build a UI for data input. The application also supports bookmarking the current state for sharing.
Live App: hr-datalab.shinyapps.io/life_in_weeks/
21.01.2025 21:32 — 👍 2 🔁 0 💬 0 📌 0
🎨 Genuary 2025 Day 4: Black on black.
Day 4: "Pulse of Darkness"
Github: github.com/tukachev/Gen...
#Genuary #R #ggplot2 #Genuary2025 #GenerativeArt #Genuary4
16.01.2025 08:46 — 👍 3 🔁 0 💬 0 📌 0
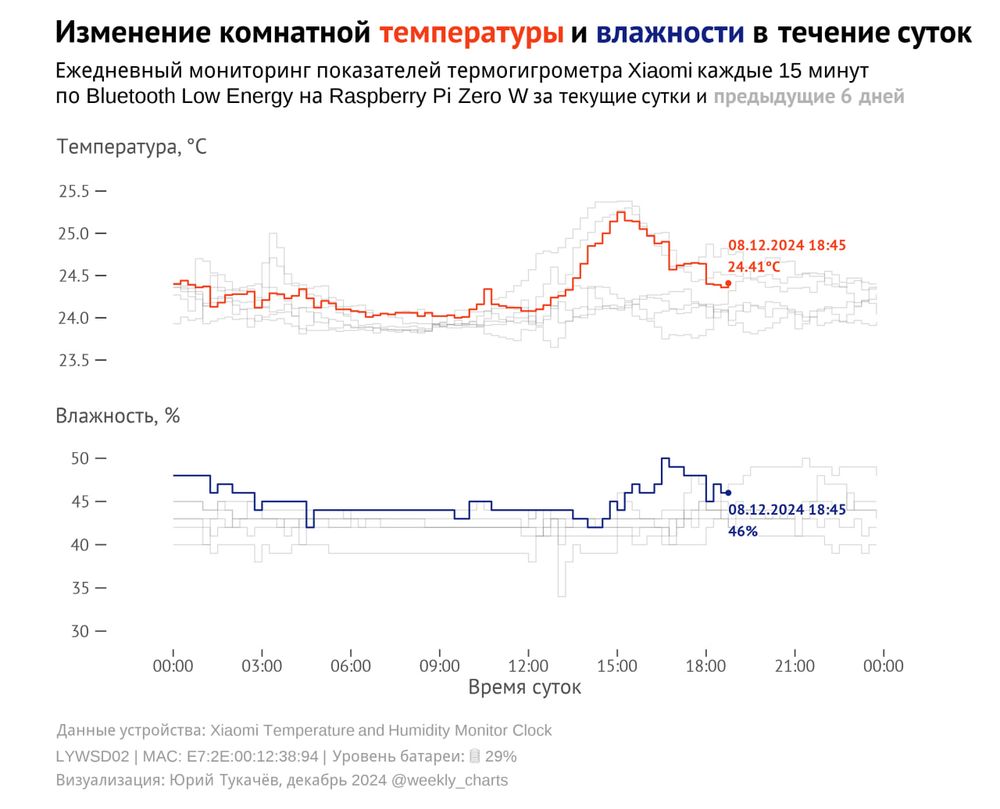
Monitoring 🌡 Temperature and 💧 Humidity
In a previous post (t.me/weekly_chart...) I mentioned collecting data from a Xiaomi thermohygrometer. The graph was automatically generated on a Pi and periodically sent to me via Telegram by a personal bot.
#R #raspberry_pi #stepline_chart #ggplot2
15.01.2025 17:52 — 👍 3 🔁 0 💬 0 📌 0
🎨 Genuary 2025 Day 3: Exactly 42 lines of code.
Here’s an example of code with a "Matrix raining code" effect that prints itself with the same "Matrix raining code" effect. Follow the rabbit, Neo!
Github: github.com/tukachev/Gen...
#Genuary
#R
#ggplot2
#Genuary2025
#GenerativeArt
#Genuary3
13.01.2025 17:38 — 👍 5 🔁 1 💬 0 📌 0
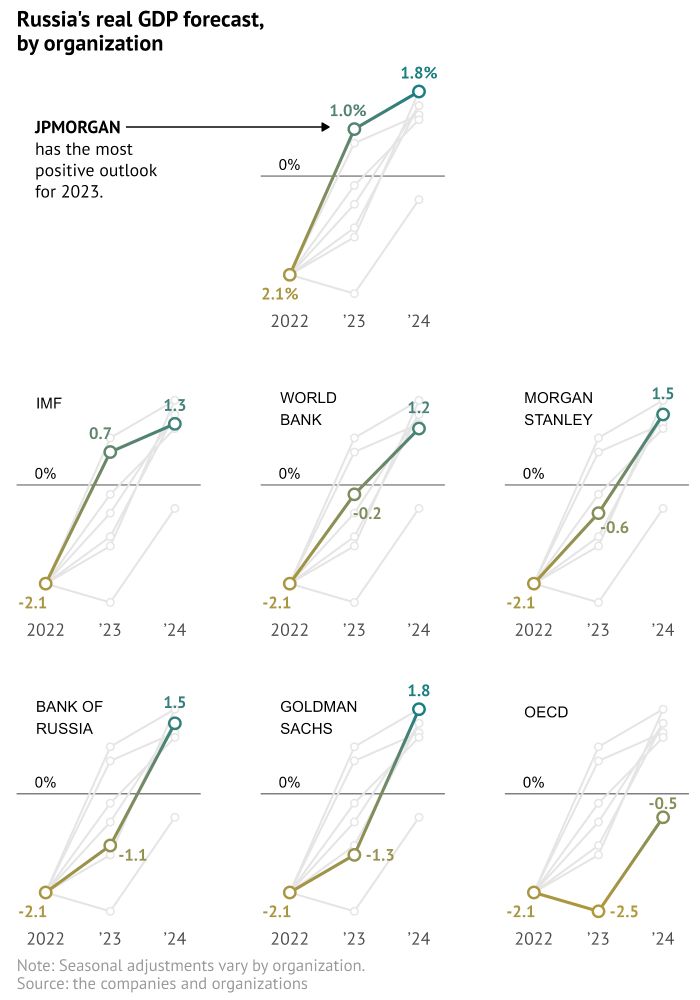
Reproducing the WSJ Russia’s real GDP forecast chart using R
Source: www.wsj.com/articles/is-...
Github: github.com/tukachev/WSJ...
#WSL #line_chart #R #ggplot2 #facet_plot #week #GDP_forecast
06.01.2025 15:22 — 👍 3 🔁 1 💬 0 📌 0

🎨 Genuary 2025 Day 2: Layers upon layers upon layers.
Day 2. Fractal layers of life. Код на github (github.com/tukachev/Gen...).
#Genuary #R #ggplot2 #Genuary2025 #GenerativeArt #Genuary2
06.01.2025 07:37 — 👍 5 🔁 1 💬 0 📌 0
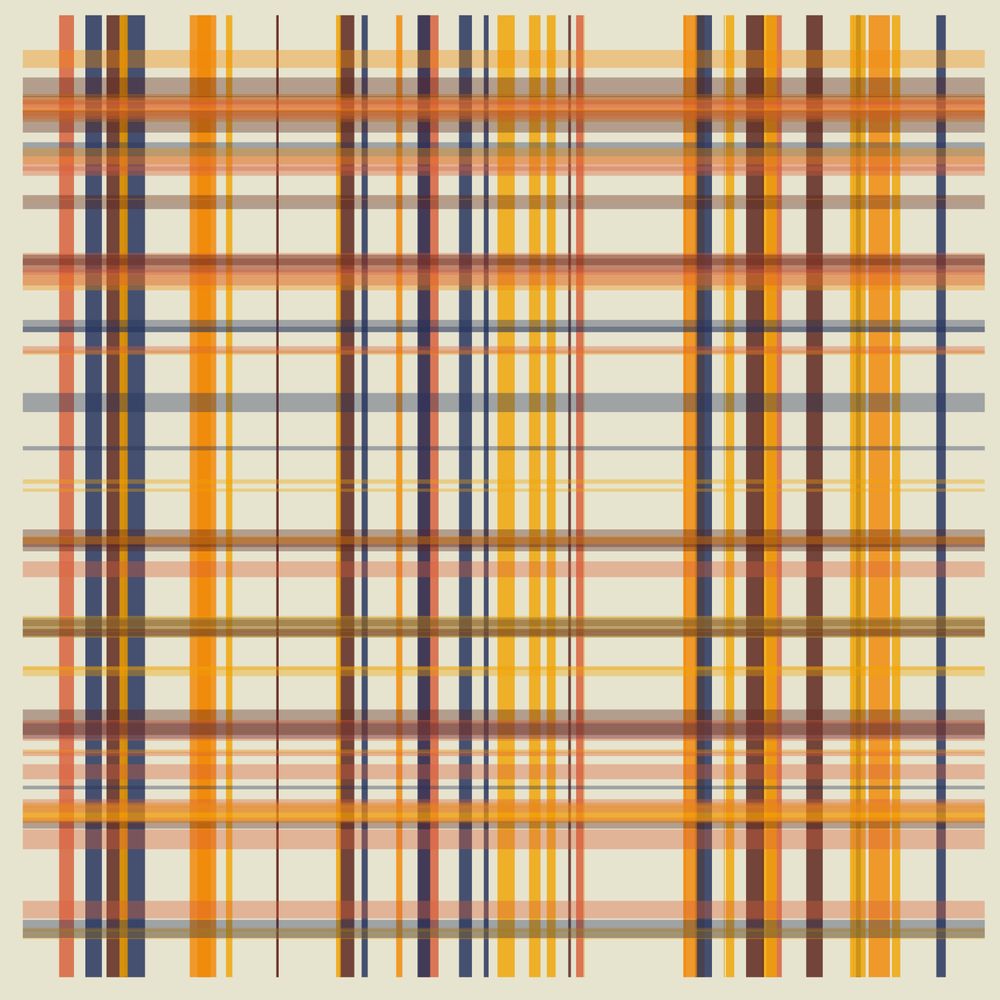
🎨 Genuary 2025 Day 1: Vertical or horizontal lines only
I decided to participate in the GENUARY 2025 Challenge(genuary.art). Day 1: Vertical or horizontal lines only. I will post the code for R on github(github.com/tukachev/Gen...).
#Genuary #R #ggplot2 #Genuary2025 #GenerativeArt #Genuary1
06.01.2025 07:36 — 👍 4 🔁 0 💬 0 📌 0
🎄Ёлочка от chatGPT + R + ggplot2
Этот год прошёл в тестировании возможностей ИИ, поэтому я попросил #сhatGPT нарисовать ёлочку с помощью #R и #ggplot2. Вот что у него получилось (gist.github.com/tukachev/96a...) (см. картинку к посту).
#chatGPT #R #ggplot2 #AI #ИИ #разное
31.12.2024 07:30 — 👍 3 🔁 1 💬 0 📌 0
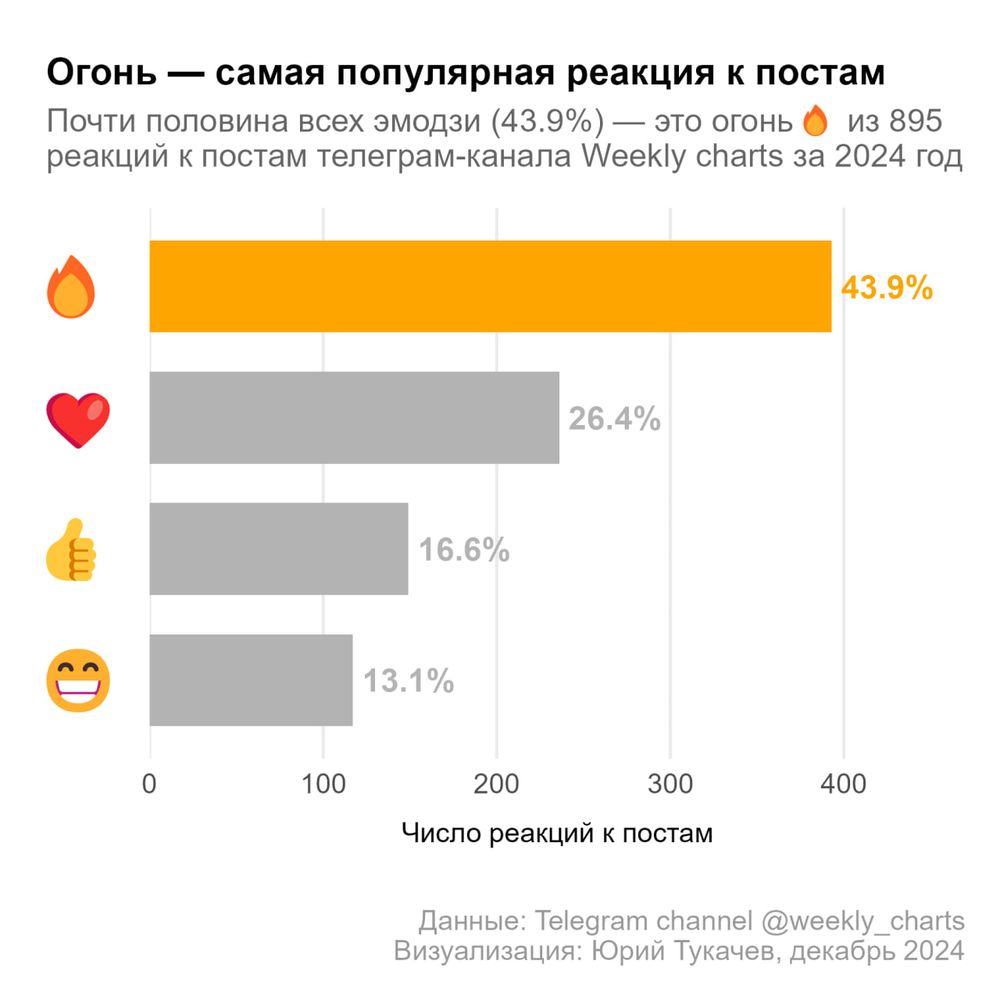
🔥 Аффтар, жги исчо!
Пора подводить итоги 2024 года -- запланировал пару постов по теме. Сегодня анализируем и визуализируем данные по эмодзи-реакциям к постам канала (t.me/weekly_charts) 🤣
#R #ggplot2 #quantified_self #bar_plot #эмодзи #статистика_канала
19.12.2024 21:28 — 👍 2 🔁 0 💬 0 📌 0
A #DataViz challenge 📊 by @cedricscherer.com and @drxeo.eu
Supported by @wendyshijia.bsky.social and @ansgarw.bsky.social
More info on Github: https://github.com/30DayChartChallenge/Edition2024
Author. Mom. Defender of democracy. http://linktr.ee/marytrump
The #CopernicusClimate Change Service (#C3S) & #CopernicusAtmosphere Monitoring Service (CAMS), implemented by @ecmwf.int on behalf of the European Commission.
Data Visualization Designer
Data Engineer | Photography & Generative art enthusiast | #Tableau Visionary & #DataDev Ambassador | Views are my own
Data Interpreter & Visualizer: Transforming Complex Data into Compelling Visual Stories. Writes about DataViz, R, Science Communication. Teaching statistics to undergraduate students.
We are dedicated to fostering community for data visualization professionals.
We make free, open-source software for data scientists like the RStudio IDE.
We're formerly known as RStudio. You can always download our open-source IDE here. https://posit.co/download/rstudio-desktop/
Website: https://stevenponce.netlify.app/
GitHub: http://github.com/poncest/
LinkedIn: http://linkedin.com/in/stevenponce/
R, data, 🐕, 🍸, 🌈. He/him.
https://eusp.org/en/people/aleksey-mikhaylovich-zheleznov
@alexey@sciences.social
I am looking for any research-level or PhD position outside Russia, mainly in research governance, geography, scientometrics, or project management
Author of Practical R for Mass Communication & Journalism
❤️ #RStats, writing & cities designed for walking/biking
Having fun with #GenAI
(Mostly) retired; former tech journalist
Also #VibrantAging #Running #Photography #Crochet #ASL #NoBridge
ggplot2 extenders meetup, discussion
- ggplot2-extenders.github.io/ggplot-extension-club/
- evamaerey.github.io/easy-geom-recipes/
- evamaerey.github.io/ggplot2-extension-cookbook/
- github.com/EvaMae
Computational biologist, data scientist, digital artist | he, him | http://clauswilke.com/ | Opinions are my own and do not represent UT Austin.
Data-artist, designer, dataviz fan
mediocre transsexual; sydneysider; saltbush girl; former professor; credibly accused of crimes against statistics, data science, mathematical psychology, pharmacometrics, and art; old; bitter; should quit grindr; probably won't
🗣️#RStats #DataScience #Dogs
@dslc.io Executive Director
#TidyTuesday poster
🔗http://linkedin.com/in/jonthegeek
🔗http://github.com/jonthegeek
Building data science tools @posit.co, #rstats, parenthood ✨📊✨