Thank you!
04.11.2025 10:52 — 👍 1 🔁 0 💬 0 📌 0
💡What are the implications? Ans: Social contact structure can affect the impact of PCVs and should be taken into consideration when estimating vaccine impact.
Congratulations to Anabelle Wong for publishing her PhD work and a big thank you to co-authors Sarah Kramer and Dan Weinberger! (6/6)
23.10.2025 16:26 — 👍 0 🔁 0 💬 0 📌 0
🔍 We found that varying the social contact matrix alone led to a range of time-to-elimination (3.8-6 years). We further found that such variation was largely explained by the social contact features (total contact rate and assortativity) of children under 5. (5/6)
23.10.2025 16:26 — 👍 0 🔁 0 💬 1 📌 0
👩🏻💻 We developed a compartmental transmission model to investigate the effect of social contact structure on the impact of PCVs (i.e., how fast PCVs eliminate vaccine-targeted serotypes). (4/6)
23.10.2025 16:26 — 👍 0 🔁 0 💬 1 📌 0
❓Many population factors can influence the dynamics of VT elimination, for example, social behaviours. So we asked, what is the effect of social contact structure on the PCV-induced VT elimination dynamics? (3/6)
23.10.2025 16:26 — 👍 0 🔁 0 💬 1 📌 0
🦠Pneumococcus is highly diverse but pneumococcal vaccines (PCVs) only target a fraction of the many serotypes. As PCVs reduced carriage of vaccine-targeted serotypes (VT), more carriage of non-vaccine-targeted serotypes (NVT) were observed — a phenomenon known as serotype replacement. (2/6)
23.10.2025 16:26 — 👍 0 🔁 0 💬 1 📌 0
A big thank you to co-authors Pej Rohani, Tine Dalby, and Anabelle Wong! (6/6)
23.10.2025 16:19 — 👍 1 🔁 0 💬 1 📌 0
💡What is the implication? True infection burden is probably somewhere between reported case number and seropositivity-based estimates. Mathematical models integrating both data streams may get us a better estimate in the future! (5/6)
23.10.2025 16:19 — 👍 2 🔁 0 💬 1 📌 0
🧑🏻💻 By fitting a methematical model to data from serosurveys during the whole-cell pertussis vaccine era, we found that the postive predictive value (PPV) of using seropositivity to estimate transmissible infections is low, esp. in young adults (20-39y) where PPV was <50%. (4/6)
23.10.2025 16:19 — 👍 1 🔁 0 💬 1 📌 0
📈 While seroprevalence data can aid estimation of the circulating pertussis infection burden, ignoring natural immune boosting would lead to an overestimation of cases and underestimation of vaccine impact. (3/6)
23.10.2025 16:19 — 👍 1 🔁 0 💬 1 📌 0
🩸Natural immune boosting occurs when pathogen triggers a detectable immune response in the (vaccinated or previously infected and recovered) host without causing a transmissible infection. (2/6)
23.10.2025 16:19 — 👍 2 🔁 0 💬 1 📌 0
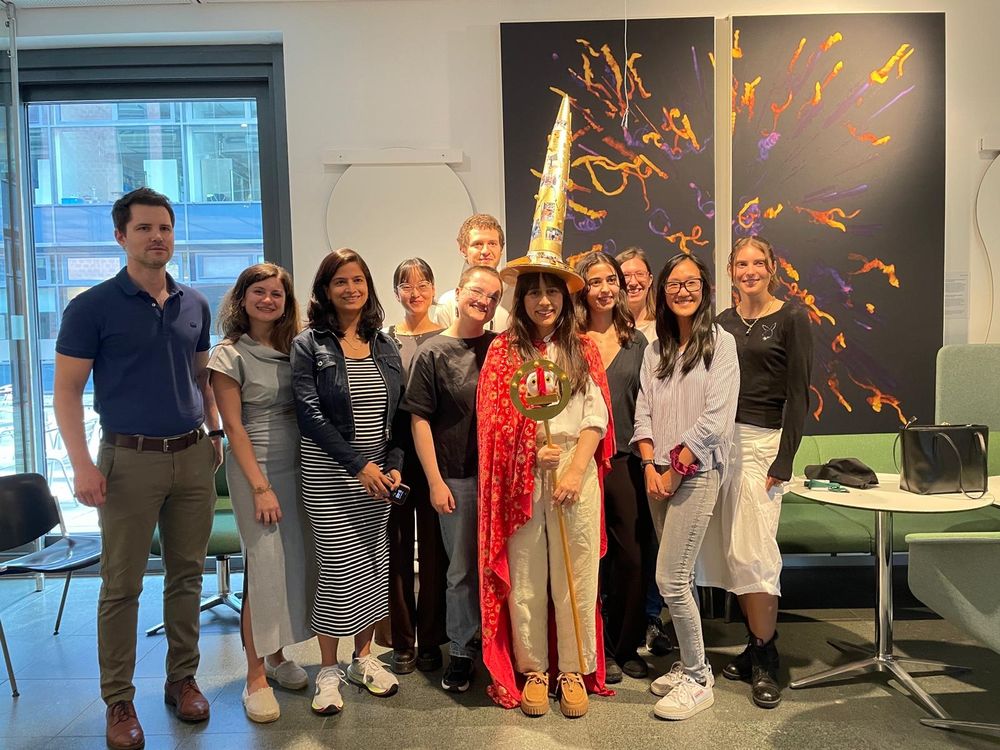
Massive congratulations to the new Dr. Laura Barrero Guevara (@labarreroguevara.bsky.social), who successfully defended her PhD on causal inference and infectious diseases yesterday, with summa cum laude!! Check out her work here rdcu.be/ewCNj and here doi.org/10.1093/infd... 🥳🎉
17.07.2025 10:10 — 👍 13 🔁 0 💬 0 📌 1
(10/10) Big thank you to our co-authors! Laura Barrero Guevara, Sarah Kramer and Tobias Kurth!
10.12.2024 14:35 — 👍 1 🔁 0 💬 0 📌 0
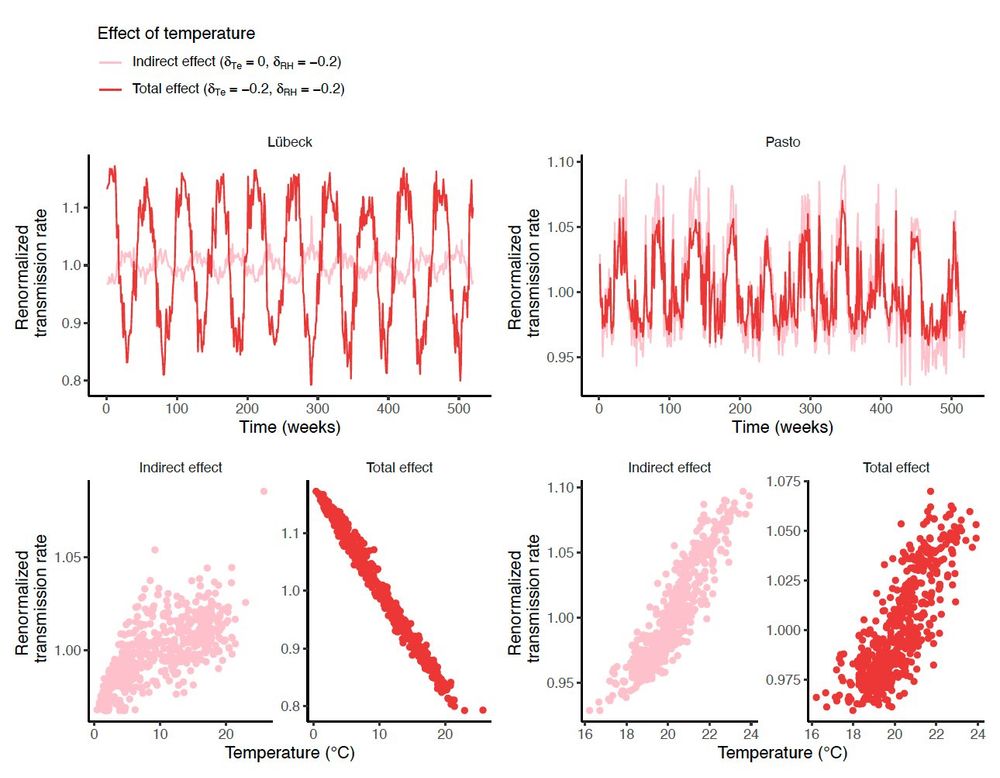
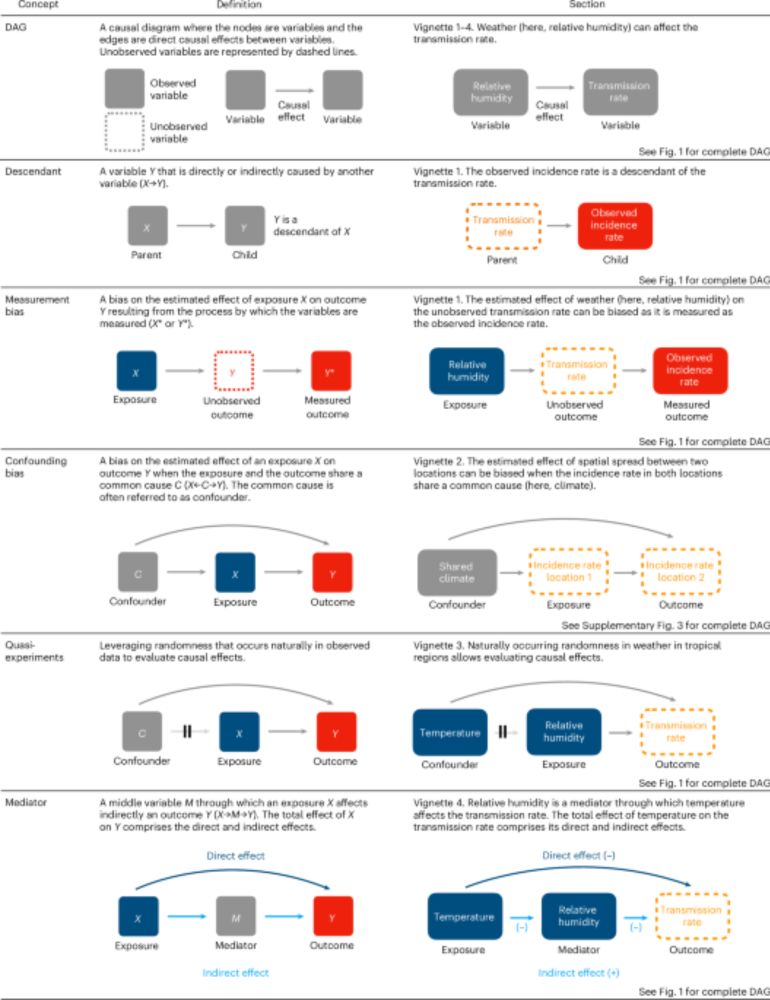
(8/10) Fourth vignette: causal inference concepts can help to interpret the direct and indirect effects of weather on transmission. For example, temperature can affect transmission directly and indirectly (through humidity), and these effects vary by local climate.
10.12.2024 14:35 — 👍 0 🔁 0 💬 1 📌 0
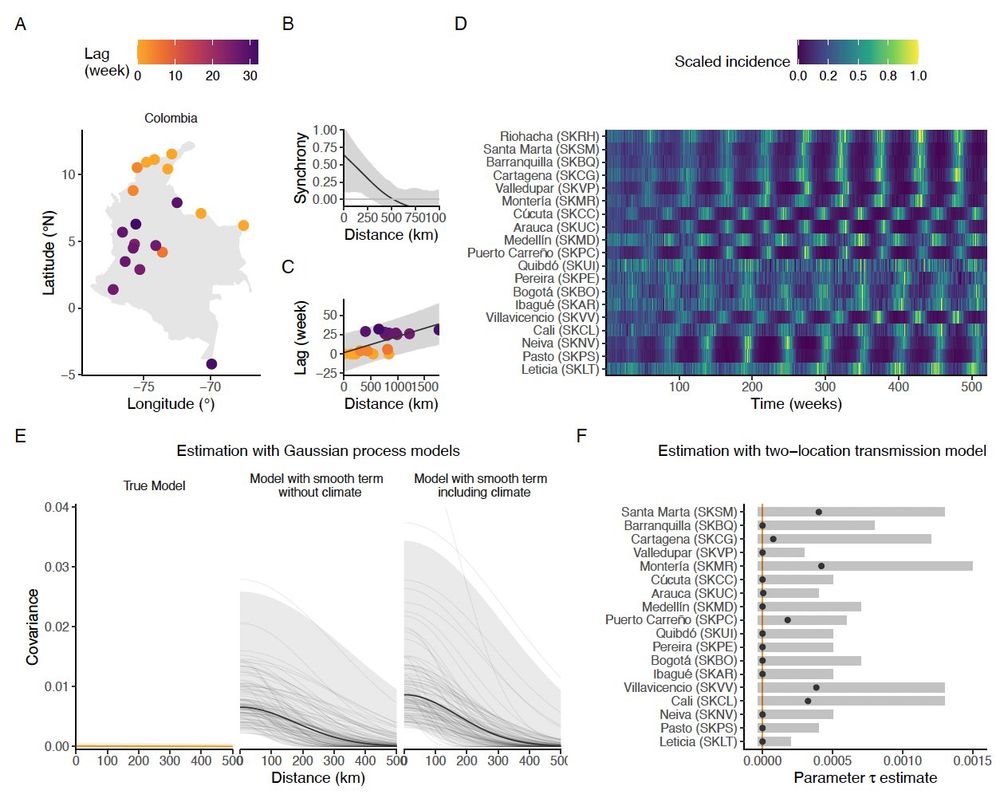
(7/10) Third vignette: causal inference helps identify and avoid confounding bias. Gradients in climate across locations can masquerade as spatial spread of disease.
10.12.2024 14:35 — 👍 0 🔁 0 💬 1 📌 0
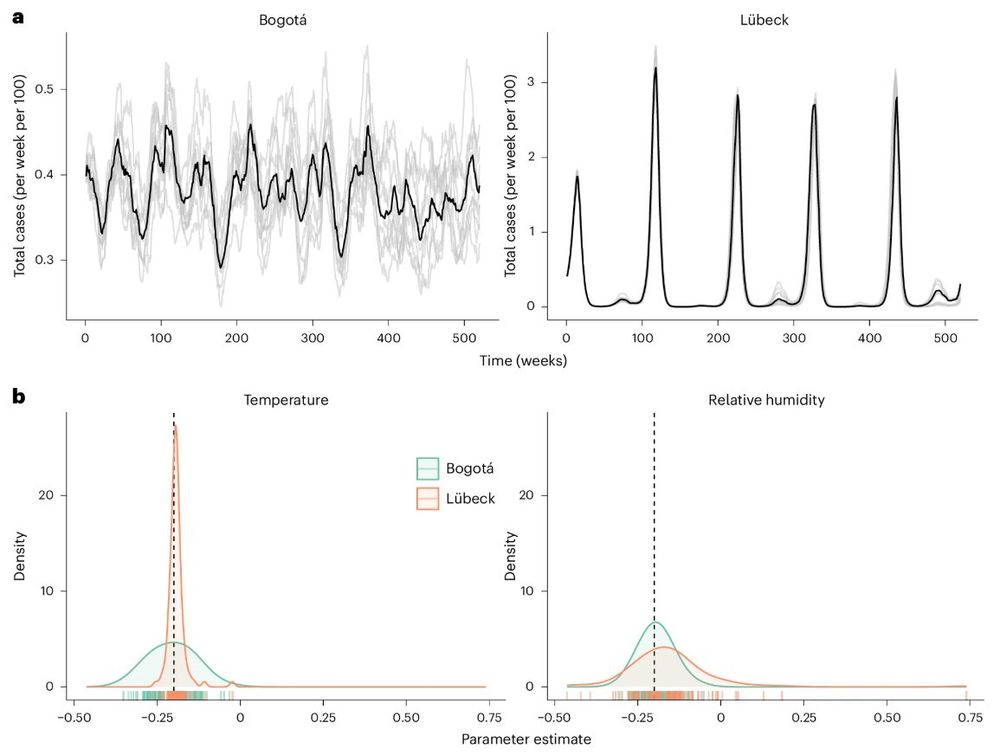
(6/10) Second vignette: causal inference can inform strategic choices of a study location to achieve the set-up of a natural experiment. By comparing temperate and tropical climates, we highlight how local conditions can help isolate the causal weather variable.
10.12.2024 14:35 — 👍 0 🔁 0 💬 1 📌 0
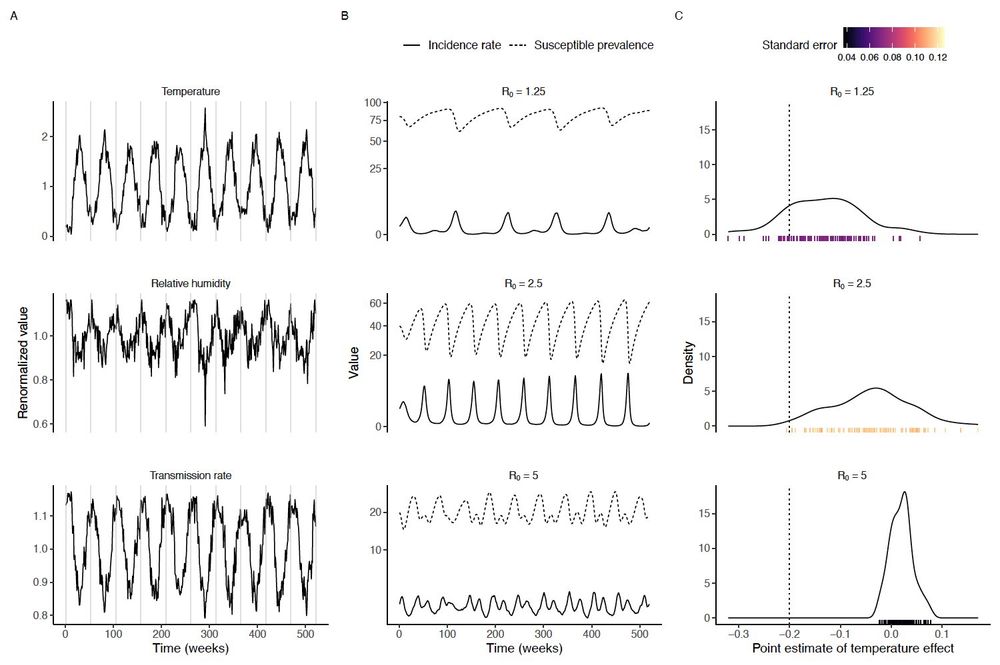
(5/10) First vignette: causal inference concepts can guide study design. Considering the complex causal paths between weather, transmission, and incidence, we show that measurement bias is a concern for time-series regression studies linking weather and incidence.
10.12.2024 14:35 — 👍 0 🔁 0 💬 1 📌 0
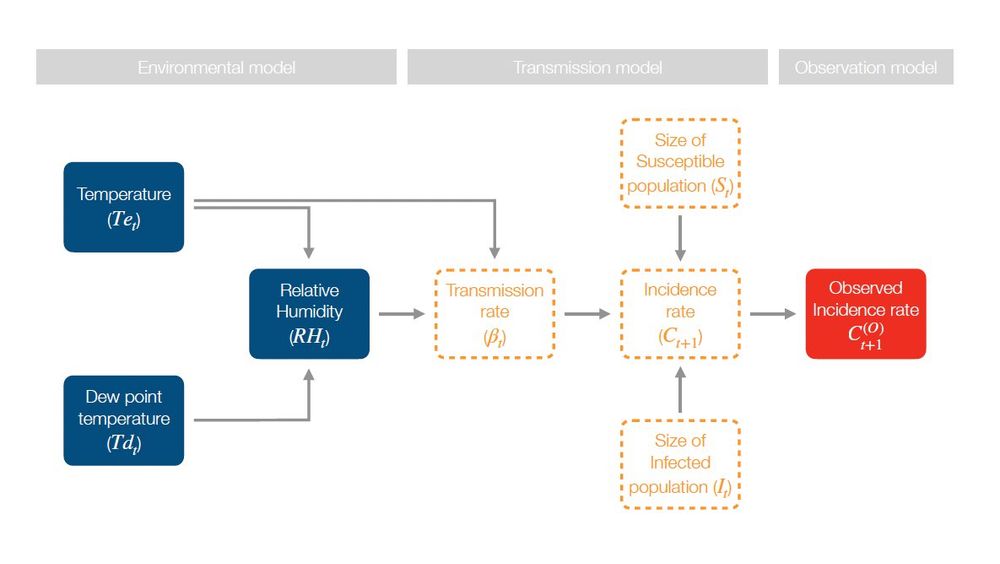
(4/10) Our new paper shows how applying causal inference concepts can help. We illustrate this with four short case studies based on our causal graph #dag ⬇️ linking weather, disease transmission, and reported cases.
10.12.2024 14:35 — 👍 0 🔁 0 💬 1 📌 0
(3/10) In practice, this often means using observational data—case counts and weather variables. Yet, interpreting such data can be challenging, as associations do not necessarily imply true causal effects.
10.12.2024 14:35 — 👍 0 🔁 0 💬 1 📌 0
(2/10) A key question arising from climate change is how it will impact the transmission of infectious diseases. Predicting these effects demands understanding how weather affects their transmission dynamics.
10.12.2024 14:35 — 👍 0 🔁 0 💬 1 📌 0
Causal inference concepts can guide research into the effects of climate on infectious diseases - Nature Ecology & Evolution
A series of case studies is used to illustrate how concepts from causal interference can be used to guide research into the effects of weather on the transmission and population dynamics of infectious...
How does weather affect the transmission of #infectiousdiseases, and how can we predict the effects of #climatechange on them? Our new article in @natureportfolio.bsky.social Ecology & Evolution explores these questions using #causalinference and #transmissionmodels. See the 🧵for more! (1/10)
10.12.2024 14:35 — 👍 18 🔁 3 💬 1 📌 1
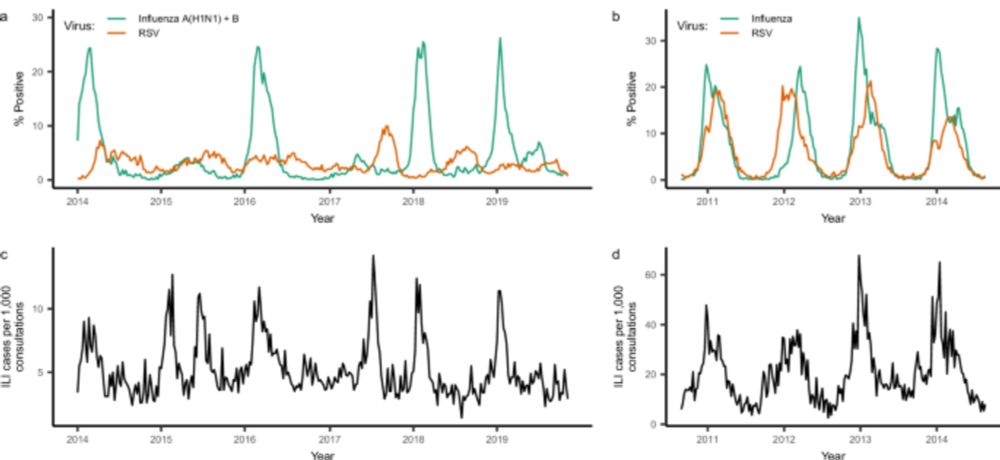
(6/7) We also used our model to explore the potential for using live influenza #vaccines to control RSV outbreaks. We found that the effectiveness of this strategy is likely to depend on the size and timing of flu and RSV outbreaks in a given location.
27.11.2024 17:02 — 👍 0 🔁 0 💬 1 📌 0
(5/7) We found evidence of a moderate to strong, negative interaction between flu and RSV – being infected with either virus may provide protection against infection with the other. Our results also suggest this protection could last for anywhere from 1 to 5 months.
27.11.2024 17:02 — 👍 0 🔁 0 💬 1 📌 0
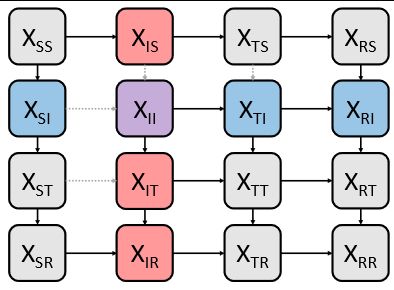
A schematic of a two-pathogen interacting transmission model.
(4/7) Here, we used a mathematical model of #flu and #RSV cocirculation to estimate the strength and duration of the interaction between the two viruses. Specifically, we fitted our model to flu and RSV data from Hong Kong and Canada.
27.11.2024 17:02 — 👍 0 🔁 0 💬 1 📌 0
(3/7) However, mathematical models can explicitly account for these complex and random processes.
27.11.2024 17:02 — 👍 0 🔁 0 💬 1 📌 0
(2/7) Characterizing interactions between viruses is surprisingly difficult. Many statistical methods fail when faced with data on infectious disease transmission, a complex and partly random process.
27.11.2024 17:02 — 👍 0 🔁 0 💬 1 📌 0
Veterinarian, One Health PhD researcher, and all-round nerd. I work on modelling the systems in which antimicrobial resistance occurs at the livestock-human interface.
🔬 Assistant Prof, Pathology @Duke | Director, Clin Micro Lab
🧫 Former Clin Micro Fellow @Memorial Sloan Kettering
👩🏻🔬 Former Postdoc @broadinstitute.org
🎓 PhD @The Rockefeller University
Focus: Diagnostics, AMR, Structural Biology
Bringing together global expertise, knowledge, research and teaching to help humanity adapt faster to outbreaks of disease.
Postdoc in mathematical modelling of infectious diseases at
@institutpasteur, Paris (MMMI Unit).
Transmission dynamics, Household studies, Seroepidemiology, Public Health, Animal Health #IDSky
PhD candidate at Uni of Lübeck. Interested in health behavior, simulation modeling, and behavioral interventions. Love coffee, podcasts, and the too many hobbies I never have time for. She/her.
Professor Infectious Disease Epidemiology@Hannover Medical School and Head Department of Epidemiology@Helmholtz Centre for Infection Research, https://helmholtz-hzi.de/epidemiologie; President of the German Society for Epidemiology, https://www.dgepi.de/
Head of Infection Biology Unit at RWTH Aachen University, speaker of @spp2225.bsky.social, speaker and founder of @infect-net.bsky.social
Anthropologist - Bayesian modeling - science reform - cat and cooking content too - Director @ MPI for evolutionary anthropology https://www.eva.mpg.de/ecology/staff/richard-mcelreath/
Assistant Professor in infectious disease modeling at LSHTM
Current obsessions include wastewater surveillance 💩, tool development for real-time outbreak response, forecasting, and nowcasting of infectious diseases
Professor of Epidemiology Harvard Chan SPH, Director, @ccdd-hsph.bsky.social. Views my own.
Infectious disease modeler | tuberculosis | pathogen interaction | global health | Johns Hopkins School of Public Health
🇳🇵| 🇺🇸
PhD | Epidemiology, Applied #CausalInference, #PublicHealth, Stroke research, improving quality, peer review, higher ed & research assessment reform
@ Charité in #Berlin
Likes: improving science & improv comedy
#EpiSky #Epidemiology #HigherEd #AcademicSky
Researcher at @clinicalepi.de
Mathematics, epidemiology and data visualization.
Postdoc at @clinicalepi.de at University of Münster, Germany.
Personal website: rasmuspedersen.com
Assoc Research Prof/Epidemiologist/Public Health | JohnsHopkins Epi CC Columbia alum | all views my own