Yes, that did the trick! Thank you!
25.09.2025 06:41 — 👍 1 🔁 0 💬 0 📌 0
my_header <- paste0("Ham", "burger")
tt(dat) |> group_tt(
j = list(
my_header = 1:3,
"Halloumi" = 4:5,
"Tofu" = 7))
results in a label spanning column 1, 2 and 3 named "my_header" instead of the desired "Hamburger".
Is there a way to have a spanning label resulting from code?
24.09.2025 12:26 — 👍 0 🔁 0 💬 1 📌 0
Hi @vincentab.bsky.social , a question. Is it possible to use an R expression as a label spanning columns in tt:group_tt? So that in example below "Hamburgers" is resulting from an R expression?
tt(dat) |> group_tt(
j = list(
"Hamburgers" = 1:3,
"Halloumi" = 4:5,
"Tofu" = 7))
24.09.2025 11:58 — 👍 0 🔁 0 💬 1 📌 0

Een rechthoekige driehoek met zijden 3, 4 en 5
Fijne Pythagoras dag!
9-16-25 :pythagoras:
16.09.2025 07:22 — 👍 148 🔁 37 💬 14 📌 5

An LLM that never hallucinates
There are two big errors we can make with information, but one often gets forgotten
Want a large language model that never hallucinates? Easy: just get it to always print “I don’t know”, regardless of the input.
If you find this solution is a bit unsatisfying, you’re not alone. But it hits on a crucial trade-off with learning machines and decision-making more generally.
New post:
10.09.2025 17:53 — 👍 36 🔁 11 💬 2 📌 1

library(tinytable)
dData <- data.frame(one = c(1,1),
two = c(2,2),
three = c(3,3))
dData |>
tt(theme = "void") |>
group_tt(j =
list("no" = 1,
"yes" = 2:3)) |>
style_tt(
line = "tblr",
line_width = 0.01, # doesnot show
line_color = "red"
)
dData |>
tt(theme = "void") |>
group_tt(j =
list("no" = 1,
"yes" = 2:3)) |>
style_tt(
line = "tblr",
line_width = 0.1, # does show
line_color = "red"
)
Thanks. I did try that, see the screenshot with code making it as alt-text. With line_width of 0.1 it is OK, with line_width of 0.01 there is grey to be seen, despite having set theme = "void". Is there something else I can do to get a very thin colored line?
09.09.2025 17:02 — 👍 0 🔁 0 💬 1 📌 0
group – tinytable
A question; you write about how to format text in grouped columns: vincentarelbundock.github.io/tinytable/vi...
But how can I style the borders? I can't find the way to colorize the border between the row with colnames and the added row with group names. Do you maybe have a suggestion?
09.09.2025 14:02 — 👍 0 🔁 0 💬 1 📌 0
This will (hopefully :) ) make table polishing in #quarto #rstats #typst so much more easy: #tinytable in vincentarelbundock.github.io/tinytable/vi...
08.09.2025 15:18 — 👍 10 🔁 1 💬 2 📌 0
My workaround is making separate plots, and then combine them with {patchwork} with a plot_spacer() for the empty slots.
07.09.2025 11:09 — 👍 0 🔁 0 💬 0 📌 0
Cédric Scherer
Blog by Cédric Scherer
@cedricscherer.com has a nice collection of links on his website: www.cedricscherer.com/top/links/
07.09.2025 11:03 — 👍 5 🔁 1 💬 0 📌 0
🦋🪨s!
01.09.2025 19:01 — 👍 1 🔁 0 💬 0 📌 0
Interesting! Indeed I did learn some new things:) First one I will probably use is `update_geom_defaults()`. Thank you!
29.08.2025 10:56 — 👍 1 🔁 0 💬 0 📌 0
ggiraph-book
Anyone an idea where I can find the source code of ardata.fr/ggiraph-book/ ? The github link on the website is dead. #ggplot2 #rstats #ggiraph. Thanks!
20.08.2025 14:37 — 👍 2 🔁 3 💬 1 📌 0
The cover of Bayesian Data Analysis book
The cover of Regression and Other Stories book
The cover of Active Statistics book
All three books I've co-authored are freely available online for non-commercial use:
- #Bayesian Data Analysis, 3rd ed (aka BDA3) at stat.columbia.edu/~gelman/book/
- #Regression and Other Stories at avehtari.github.io/ROS-Examples/
- Active Statistics at avehtari.github.io/ActiveStatis...
02.08.2024 13:35 — 👍 312 🔁 131 💬 6 📌 4
Interesting! Can you share a link to a version this paper?
03.08.2025 17:56 — 👍 1 🔁 0 💬 1 📌 0
That’s it I’m firing R because my results weren’t significant
02.08.2025 00:28 — 👍 126 🔁 18 💬 7 📌 3

Raw data when reading a puz file

A crossword, read with {crosswordio} and plotted with {grid} graphcs
Introducing {crosswordio} - an #RStats pkg to read/write/plot crosswords in "PUZ" format.
https://github.com/coolbutuseless/crosswordio
#RStats
28.07.2025 08:20 — 👍 27 🔁 9 💬 0 📌 0

Statistical Transformations | ggplot2 Uncharted
ggplot2 layers apply statistical transformations to data before plotting. Customizing these using the stat argument and stat_*() layers enables flexible, advanced visualizations.
#rstats #ggplot Revelation of the day: `geom_*()` and `stat_*()` are wrappers for `layer() ` with respectively a fixed geom or stat argument. Now `stat_*()` suddenly feels less complex. Thank you @cedricscherer.com and @yan-holtz.bsky.social for making www.ggplot2-uncharted.com
23.07.2025 13:48 — 👍 9 🔁 2 💬 1 📌 0

Render text in color for Markdown / Quarto | Format refs to packages in inline text
Render text in color for Markdown / Quarto | Format refs to packages in inline text - colorize.R
For a book I'm writing I want to print text in colors. #rstats #quarto
This gist: gist.github.com/friendly/b2a... defines a colorize() function that can be used easily for HTML and LaTeX/PDF documents in .qmd and .rmd files.
20.07.2025 17:34 — 👍 17 🔁 5 💬 2 📌 1
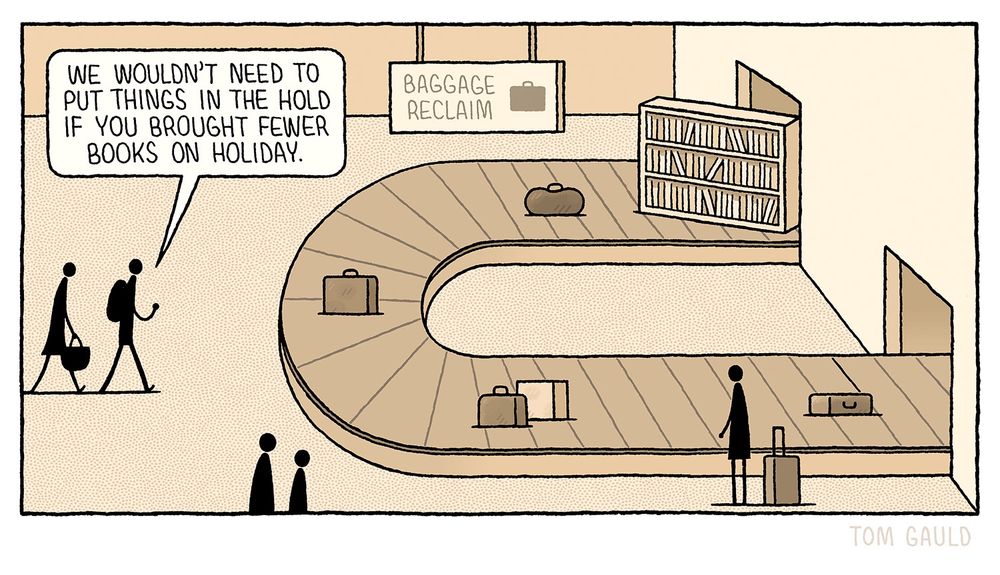
Two figures approach the Baggage Reclaim area of an airport.
One says “We wouldn't need to put things in the hold if you brought fewer books on holiday.”
Arriving on the carousel, amongst the bags and suitcases is a very large, well-stocked bookcase.
My cartoon for this week’s @theguardian.com books.
20.07.2025 10:07 — 👍 946 🔁 248 💬 15 📌 45

Conference – rainbowR
Join our conference organising committee! See our conference page for more info.
🌈 🌐 rainbowR conference: online, early 2026 🌐 🌈
Are you LGBTQIA+, do you code in R, and would you like to get involved in rainbowR’s first-ever conference? We are looking for people to join our conference organising committee!
➡️ rainbowr.org/conference
🗓️ 1st meeting: July 9, 4pm UTC
07.07.2025 16:12 — 👍 29 🔁 18 💬 1 📌 3

A browser screenshot showing the linkate extension demo page rendered in HTML. The page displays the linkate hexagonal logo on the left sidebar and demonstrates different types of links (Basic Links, Reference-Style Links, Mixed Link Types) in the main content area. At the bottom, a "Links" section shows a bulleted list containing all URLs automatically collected from throughout the document, including links to Quarto, GitHub, CRAN, R Project, Python, and other resources.

A hexagonal logo for the "linkate" extension featuring a dark blue background with white text reading "linkate" at the bottom. The center displays an abstract network design with interconnected oval shapes in orange and red gradients connected by thin lines, representing linked elements converging around a central hub.
Scattered links 🔗 driving you crazy in a post?
The linkate Quarto extension automatically collects every URL and creates a tidy "Links" section at the bottom. Just add one line to your YAML!
📚 Docs: quarto.thecoatlessprofessor.com/linkate/
💻 Repo: github.com/coatless-qua...
#quarto
06.07.2025 08:58 — 👍 35 🔁 10 💬 2 📌 0
Misschien is het wel of niet leuker dan exploding kittens?
02.07.2025 17:41 — 👍 1 🔁 0 💬 0 📌 0
I guess that means you are starting with your most favorite food? It is a bit sad when working on version 20, probably in not a too happy mood since it is version 20 already, that you are also confronted with a name of a not so favorite food. I wish you a lot of really favorite foods & few versionnr
02.07.2025 09:19 — 👍 2 🔁 0 💬 1 📌 0
A big hug for you and your loved ones
30.06.2025 06:18 — 👍 2 🔁 0 💬 0 📌 0
Maybe suppressMessages() works?
23.06.2025 18:40 — 👍 2 🔁 0 💬 1 📌 0

Een vrouw die ik zeer bewonder zei ooit: toekomstdromen uitspreken vergroot de kans dat ze uitkomen. Nu dan. Ik zou dolgraag maatschappijkritische rijmpjes willen maken voor een kwaliteitskrant. Gerijmde columns, als het ware, zoals bijgevoegd voorbeeld. PS Het was @ionica.mathstodon.xyz.ap.brid.gy
21.06.2025 07:23 — 👍 42 🔁 19 💬 2 📌 0
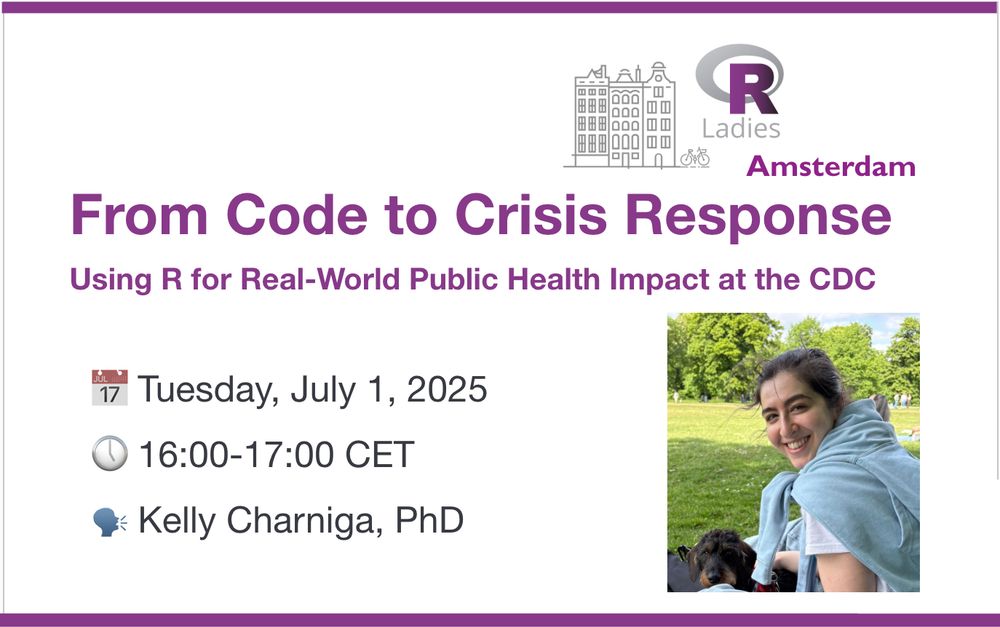
R-Ladies Amsterdam event flyer for "From Code to Crisis Response: Using R for Real-World Public Health Impact at the CDC" presented by Kelly Charniga, PhD. The event is scheduled for Tuesday, July 1, 2025 from 16:00-17:00 CET. The flyer features the R-Ladies Amsterdam logo with illustrated Dutch buildings and a bicycle, and includes a photo of the smiling presenter wearing a light blue hoodie outdoors with a small dark dog.
🚨 New Event 🚨
From Code to Crisis Response: Using #rstats for Public Health Impact at the CDC w/ @kcharniga.bsky.social
📅 July 1, 2025
⏰ 16:00-17:00 CET
🔗 www.meetup.com/rladies-amst...
Join us to learn practical R applications in crisis response and beyond!
#rladies #EpiSky #IDSky @rladies.org
16.06.2025 09:20 — 👍 18 🔁 14 💬 0 📌 2
Expressive probabilistic programming language for writing statistical models. Fast Bayesian inference. Interfaces for Python, Julia, R, and the Unix shell. A rich ecosystem of tools for validation and visualization.
Home https://mc-stan.org/
Analytical chemist in industry working on materials characterization and data science. Interested in #rstats, modeling, & sustainability. Owner of many pets.
Professor of statistics, dean of the faculty of Behavioural & Social Sciences Groningen, @rug-gmw.bsky.social @unigroningen.bsky.social. I like LEGO and good music
a Bayesian econometrician developing methodology for empirical macroeconomic analyses and programming in 𝗥 and 𝗰𝗽𝗽.
See my 𝗥 packages 𝗯𝘀𝘃𝗮𝗿𝘀 and 𝗯𝘀𝘃𝗮𝗿𝗦𝗜𝗚𝗡𝘀!
https://bsvars.org/
@bsvars.org
#bsvars #bsvarSIGNs #rstats #econsky
Professor of Biostatistics and Epidemiology at the London School of Hygiene & Tropical Medicine.
Open Source no-profit Organization | Local chapter of R-Ladies Global | @RConsortium
Linktree: https://linktr.ee/rladiesrome
📩 rome@rladies.org
machine et machouille du Rstats
Open Data Infrastructure for Social Science and Economic Innovations, NL | NWO Roadmap Recipient
The ASA History of Statistics Interest Group brings together everyone with an active interest in the history of statistics to share research and resources.
Nerd. #RStats
[bridged from https://fosstodon.org/@coolbutuseless on the fediverse by https://fed.brid.gy/ ]
|| PhD Statistics | Research Software Engineer | Loves #rstats | Outdoors person | Coffee person | Photography person | Serial Hobbiest | he/him ||
The stats book guy. Metal fan masquerading as Prof of Quantitative Methods. Learn R with the discovr package. (http://discovr.rocks/discovr/).
Open-source scientific and technical publishing system brought to you by posit.co.
github.com/quarto-dev/quarto-cli
ex-academic, co-founder RLadiesSydney, developer #RYouWithMe, sharer of #rstats learning https://jenrichmond.github.io/
Research Data Management Consultant | cghlewis.com
Co-organizer @r-ladies-stl.bsky.social
Co-organizer POWER Data Management Hub | https://osf.io/ap3tk/
Author of DMLSER: https://datamgmtinedresearch.com/
RDM Weekly: https://rdmweekly.substack.com/
Sworn in Data Janitor
blog: http://brodrigues.co
youtube: http://is.gd/NjybjH
mastodon: http://is.gd/nOyGht
twitter: @brodriguesco
"nix solves this"
Hello! I'm a statistician & developer with a huge passion for the R language #rstats for statistical computing and Linux. I always enjoy learning with fun projects and following brilliant members of the community.
Antimicrobial Resistance Research and Epidemiology
Working for Doctors without Borders #MSF
Former: #WHO #LSHTM #MarieCurieFellowship
#AMR #medsky #episky #microsky #aidsky #idsky
#python, #rstats, #shiny, #datascience training and consultancy. We help organisations extract the most from their data.