IPUMS-DHS
IPUMS-DHS facilitates analysis of Demographic and Health Surveys, administered in low- and middle-income countries since the 1980s.
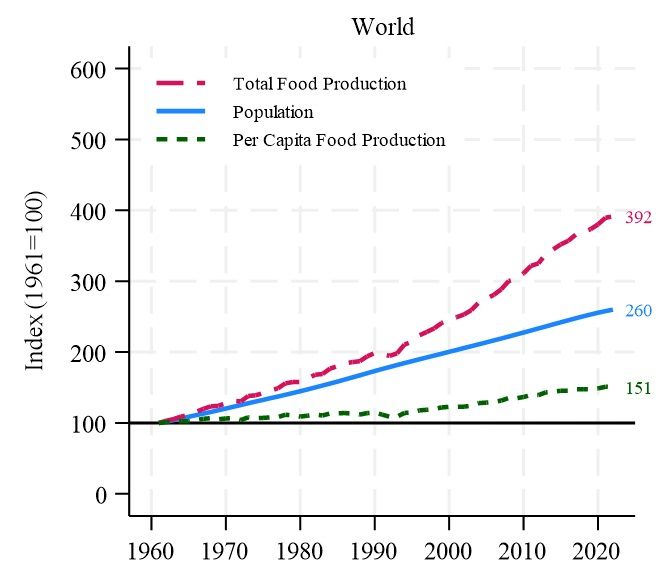
U Minnesota IPUMS has the DHS data. BUT web site says:
"Registration and access for IPUMS DHS is managed by The DHS Program, which is not reviewing new user applications or requests for expanded access from currently approved users at this time. IPUMS DHS data remain available to approved users."
26.02.2025 17:43 — 👍 7 🔁 5 💬 0 📌 0

The #PAA2025 preliminary program is online: submissions.mirasmart.com/PAA2025/Itin...
Make sure you are registered before rates increase in March: www.populationassociation.org/paa2025/reg-...
24.02.2025 23:41 — 👍 29 🔁 20 💬 0 📌 0
14) This is due to the combination of the steep income gradient in emissions and the fact that population growth will be heavily concentrated in the low-emissions lower-income countries, with higher income countries collectively experiencing population decline.
24.01.2025 17:35 — 👍 1 🔁 1 💬 0 📌 0
13) Surprisingly, although UN projections imply the addition of over 2 billion people by 2084, projections of CO2 in 2084 are almost identical whether we assume that 2019 populations are constant or assume that every country follows UN projections.
24.01.2025 17:34 — 👍 1 🔁 2 💬 1 📌 0
12) The emission-reducing impact of the 500 million population decline in high-emission higher income countries (UMICs and HICs, including China) offsets the emission-increasing impact of the 2.9 billion population increase in low-emission lower-income countries (LICs and LMICs).
24.01.2025 17:34 — 👍 2 🔁 0 💬 0 📌 0
11) Population growth makes almost no difference for projections of energy and CO2. Global CO2 is projected to fall 50% in the absence of population change due to declines in energy/income intensity and carbon/energy intensity. Adding UN population projections, CO2 falls by 52%.
24.01.2025 17:34 — 👍 1 🔁 0 💬 0 📌 0
10) Water consumption would increase only 1% due to income growth, but would increase 21% when UN population projections are added to the simulations.
24.01.2025 17:33 — 👍 0 🔁 0 💬 0 📌 0
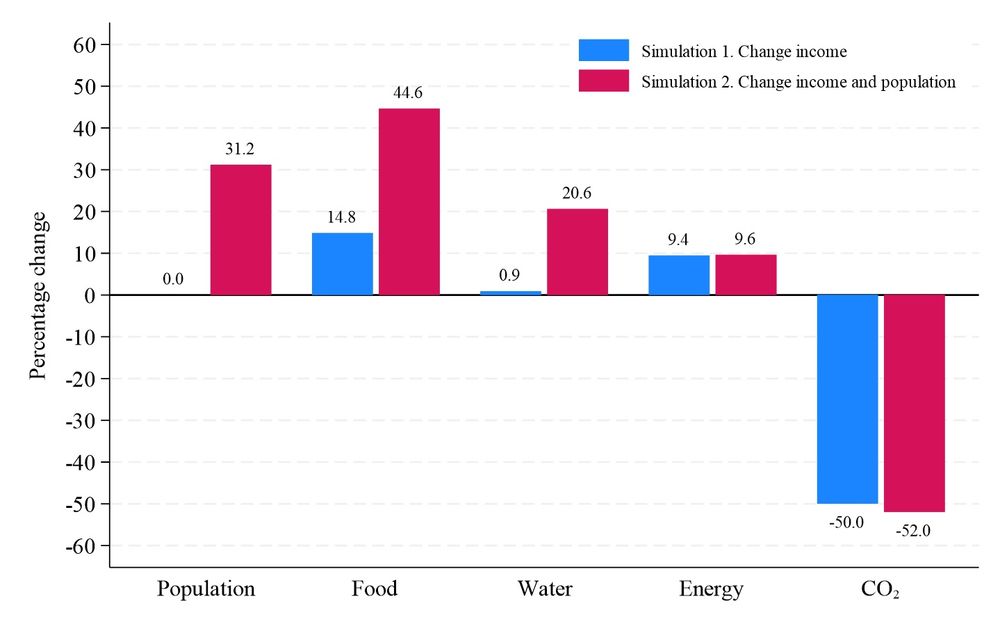
9) I simulate future trends with and without the UN projected population changes. Total world food consumption is projected to increase 15% by 2084 due to income growth alone. This increases to 45% when each country follows the median UN population projections.
24.01.2025 17:33 — 👍 1 🔁 0 💬 0 📌 0
8) I project world food, water, energy, and CO2 to 2084. Projected income growth is combined with income/consumption gradients for food and water, and is combined with projected declines in energy/income intensity and carbon/energy intensity for energy and CO2.
24.01.2025 17:32 — 👍 0 🔁 0 💬 0 📌 0
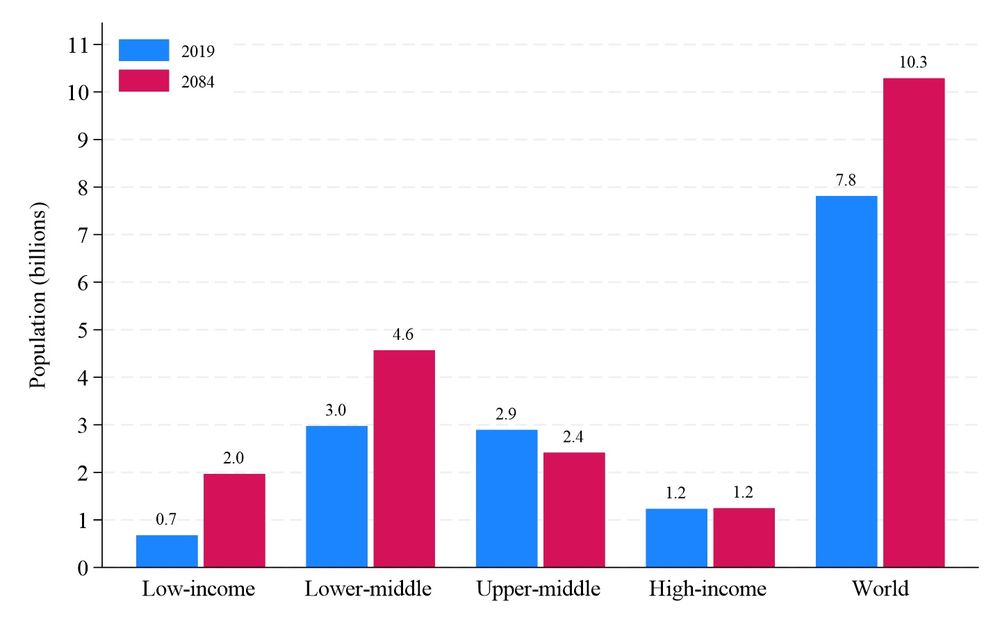
7) Second, population growth to 2084 is concentrated in low-income (LICs) and lower-middle-income (LMIC) countries, which collectively will add 2.9 billion people 2019-84. Upper-middle-income (UMIC) and high-income (HIC) countries will lose 0.5 billion, including a 600 million drop in China.
24.01.2025 17:32 — 👍 1 🔁 0 💬 0 📌 0
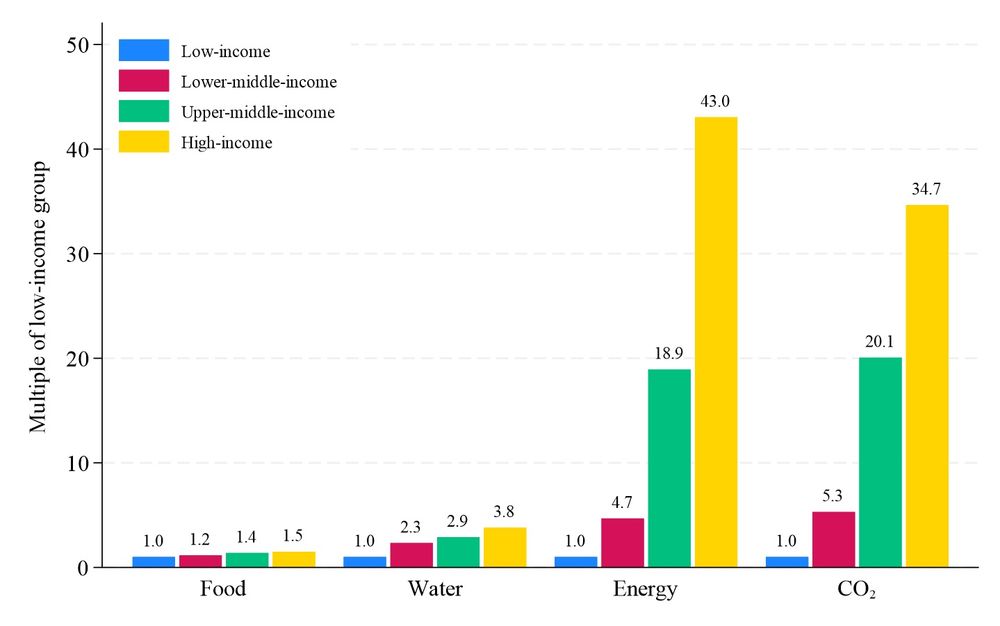
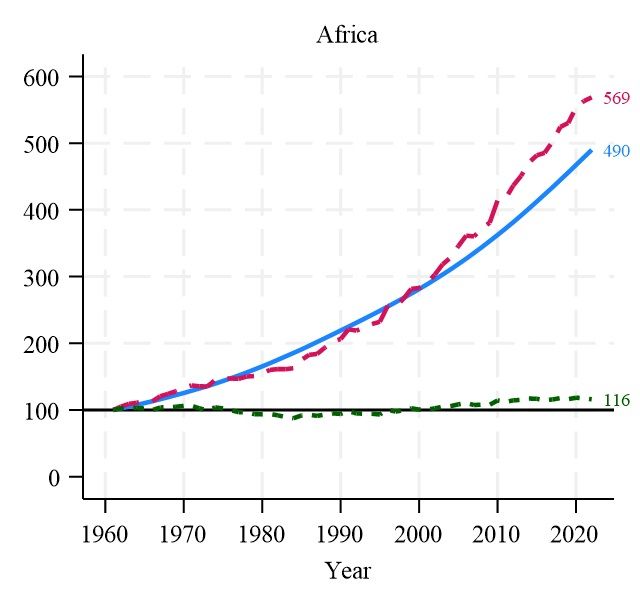
6) First, per capita consumption levels differ significantly by income level, with steeper gradients for energy and CO2 than for food and water. Food p/c is 1.5 times higher in high-income countries (HICs) than low-income countries (LICs), but CO2 p/c is 35 times higher in HICs than LICs.
24.01.2025 17:31 — 👍 1 🔁 0 💬 0 📌 0
How will two billion more people affect food, water, energy, and CO2? - N-IUSSP
David Lam looks at the resource impact of the projected 2.1 billion increase in world population by 2084. He concludes that population change will increase demand for food and water, ... Read more
5) Looking forward, I simulate the impact of UN population projections on food, water, energy, and CO2. I project from 2019 to 2084, using 2019 as the base year to avoid the impact of COVID. Results are summarized in a recent post on N-IUSSP. Three graphs explain the key points:
24.01.2025 17:30 — 👍 1 🔁 0 💬 0 📌 0
4) There are clear economic explanations for why food and resources have met the population challenge better than water and emissions. Food and most non-renewable resources are responsive to price signals caused by increasing demand. This is much less true for water and emissions.
24.01.2025 17:29 — 👍 0 🔁 0 💬 0 📌 0
3) The record of recent decades is less encouraging for water and greenhouse gases. Many countries face serious water shortages, and CO2 emissions have dramatically increased. Climate change is obviously a major challenge in coming decades.
24.01.2025 17:29 — 👍 0 🔁 0 💬 0 📌 0
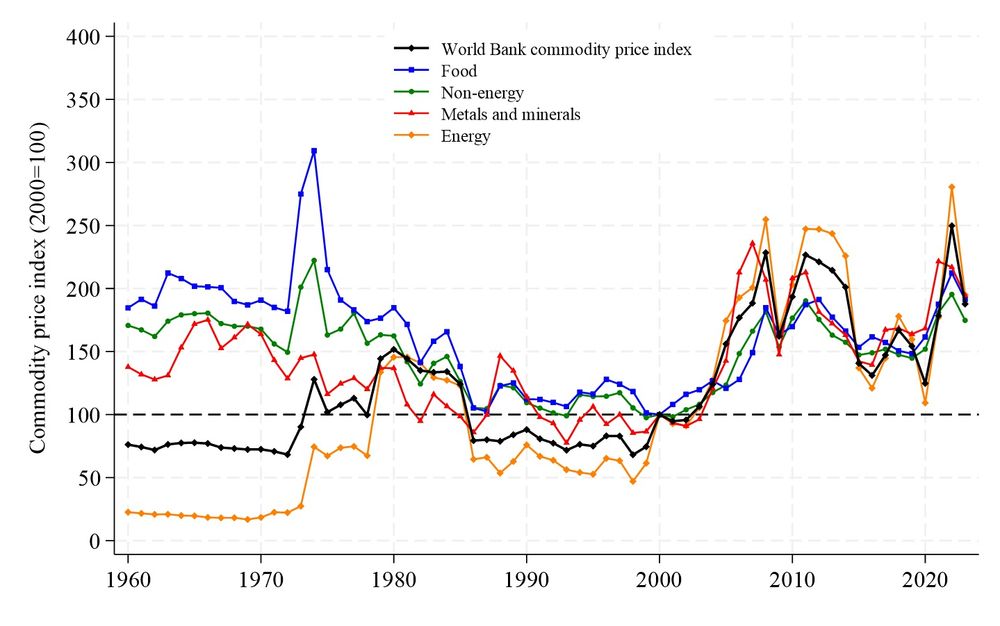
2) We have not had major shortages of non-renewable resources, in spite of adding over 5 billion people since 1960. Pre-COVID, real prices of most non-petroleum resources were around 1960s levels. After COVID spikes, prices are returning to 1960s levels.
24.01.2025 17:28 — 👍 0 🔁 0 💬 0 📌 0
Monitoring the Future: Base Year & Follow-Up Core Panel Data, Ages 18-30, United States, 1976-2021 [Restricted-Use]
New data alert! Monitoring the Future Panel core data for young adults (ages 18-30) from 1976-2021 are now available through the @icpsr.bsky.social @nahdap.bsky.social data portal: bit.ly/MTFcore
17.01.2025 18:08 — 👍 21 🔁 9 💬 0 📌 0
When school overlaps with farming: Measuring reduced educational advancement and simulating solutions in Africa
The social costs of calendars.
🏫When the school year competes with farm work, it becomes a barrier to educating rural children. 🧑🌾 But changing the school calendar can help!
A summary of research thus far, including my new collaboration in #Madagascar, on the @ifpri.org blog: on.cgiar.org/3P5HNjn
@cgiar.org #FCMinitiative
17.12.2024 20:29 — 👍 18 🔁 7 💬 2 📌 2

The Dorothy S. Thomas Award is presented annually for the best graduate student paper on the interrelationships among social, economic and demographic variables. Nominations for this and other @popassocamerica.bsky.social awards are due by Jan. 31 2025! #PAA2025 ow.ly/l10X50U2wgH
10.12.2024 19:30 — 👍 16 🔁 8 💬 1 📌 1
Midwest International Economic Development Conference
The 22nd Midwest International Economic Development Conference (MWIEDC) will be held at UIUC March 28–29, 2025. Co-hosted by Ag Econ and Econ. Mushfiq Mobarak @mushfiq-econ.bsky.social keynote. Always one of my favorite conferences.
Deadline for submissions Jan 8, 2025.
03.12.2024 15:38 — 👍 42 🔁 28 💬 2 📌 3
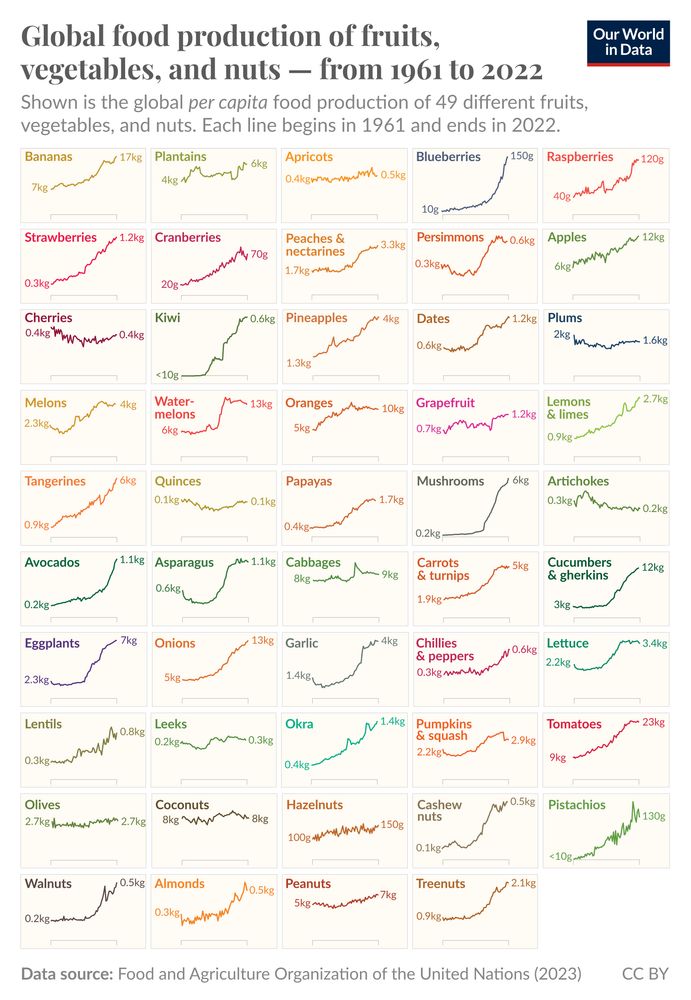
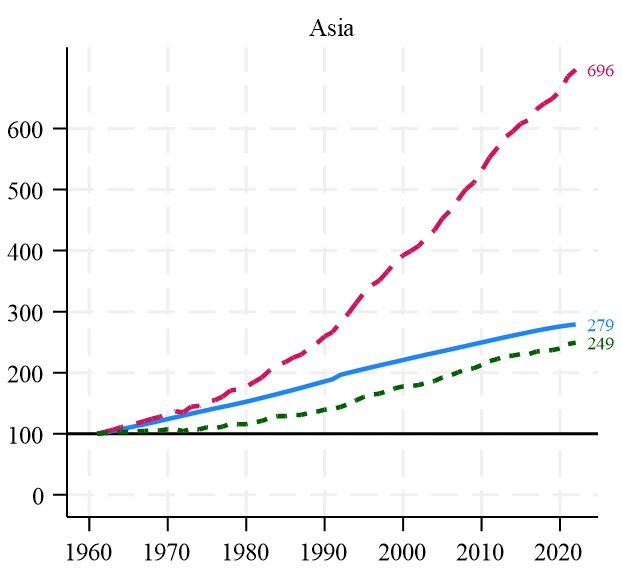
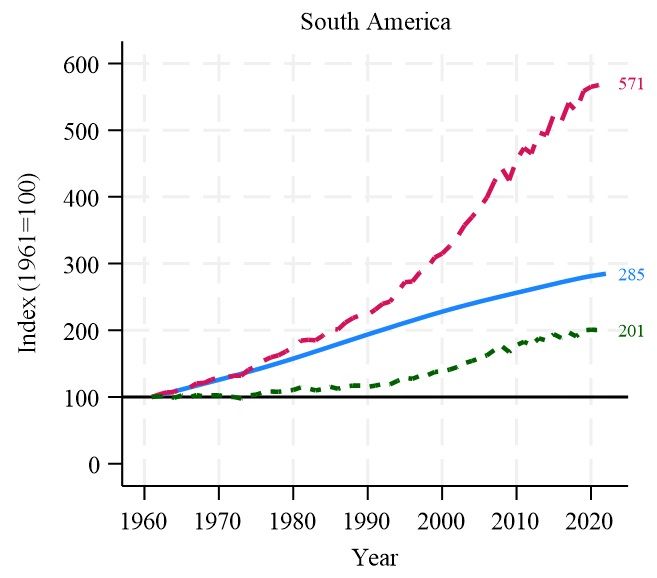
The world population grew fast over the last 60 years, but farmers grew fruits and vegetables even faster
25.11.2024 17:05 — 👍 207 🔁 64 💬 9 📌 15
https://www.nber.org/conferences/gender-economy-spring-2025
Submit your papers for the spring 2025 NBER Gender in the Economy meeting!
The theme is "Women in the Digital World".
Submission Deadline: 12/9/24
Meeting: 2/28/25 in Cambridge
t.co/DGsccq6Blw
21.11.2024 01:02 — 👍 90 🔁 38 💬 2 📌 2
The National Archive of Criminal Justice Data disseminates data from 3,300+ studies, almost two million variables, linked to a bibliography of 28,000+ citations.
Historical demographer and data impresario
Wired profile: https://www.wired.com/1995/03/ruggles/
Publications: https://users.pop.umn.edu/~ruggl001/
Data: https://www.ipums.org/
https://lisapearce.web.unc.edu/
Official account for the Department of Sociology at University of Wisconsin-Madison.
https://sociology.wisc.edu/
Assistant Professor (Instruct.), University of Houston. Applied Micro: Development, Labor, Health. Studies early-childhood interventions and human capital development in developing countries.
Website: www.mdshahadath.com
Aotearoa New Zealand & global population issues from a multidisciplinary perspective. Hosting NZPopCon at Te Papa 10-11 July 2025, more info here: https://population.org.nz/
The Population Studies Center of the University of Pennsylvania has fostered research and training in population since its founding in 1962 and is led by Director Emilio Alberto Parrado.
Assistant Professor in Economics at CREST-ENSAE-IP Paris. CEPR Affiliate.
Development, labor, and environmental economics.
Welcome!
www.fgrosset.com
Epidemiologist, lover of the ocean and ice cream. Mom of two toddlers. Founder of “Your Local Epidemiologist”. https//yourlocalepidemiologist.substack.com
Demography and epidemics
https://nyuad.nyu.edu/en/academics/divisions/social-science/faculty/stephane-helleringer.html
Economist
Under the blue sky
Based in Geneva 🏔️
https://etiennelerossignol.wordpress.com
Associate Professor of Public Policy @fordschool @umich. Social demographer studying children and families, poverty, and social policy. Mitad Española. She/her.
Associate prof of sociology, university of Michigan. Also interested in Ann Arbor politics and why there are so many cars.
Survey methodologist and statistician at the Survey Research Center, Institute for Social Research, University of Michigan
#survey | #sampling | #statistics | #RStats
Survey Methodoligist, Survey Research Center, Institute for Social Research, University of Michigan
Prof of Comm & Media and Polisci @UMich studying how people get & use political information and social measurement.
Competencies: data sci, DIY solar, election analytics, carpooling, #polcom, #polpsych, survey methods, AI literacy (views are my own)
Research Professor @ Univ. of MI Institute for Social Research (ISR) and Department of Biostatistics. Usually discussing statistics, surveys, sports, music, and leadership. Personal website: www.umich.edu/~bwest