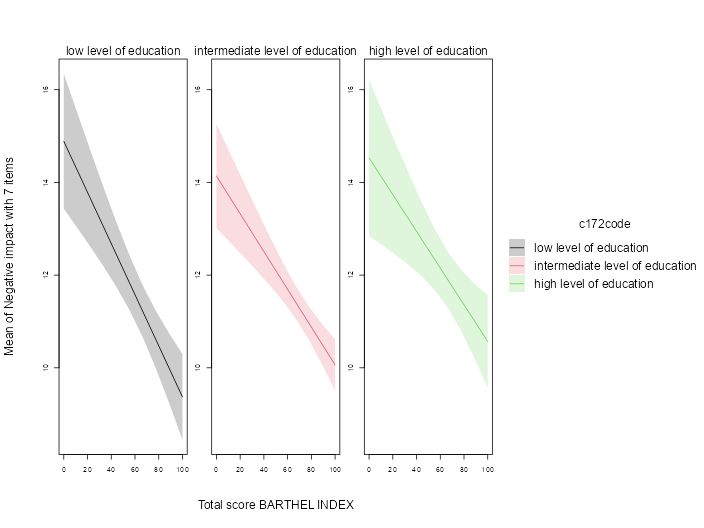
Case Study: Measuring and comparing absolute and relative inequalities in R
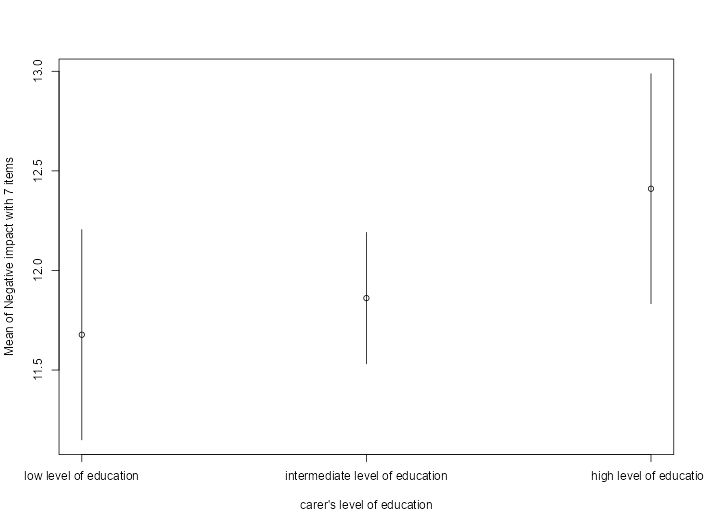
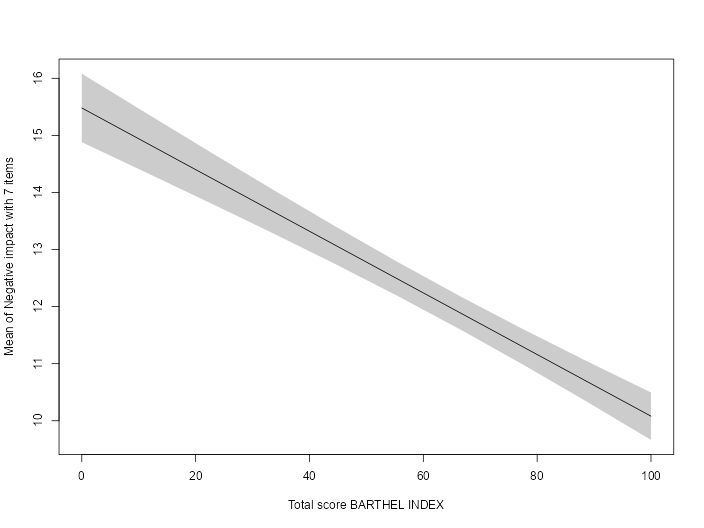
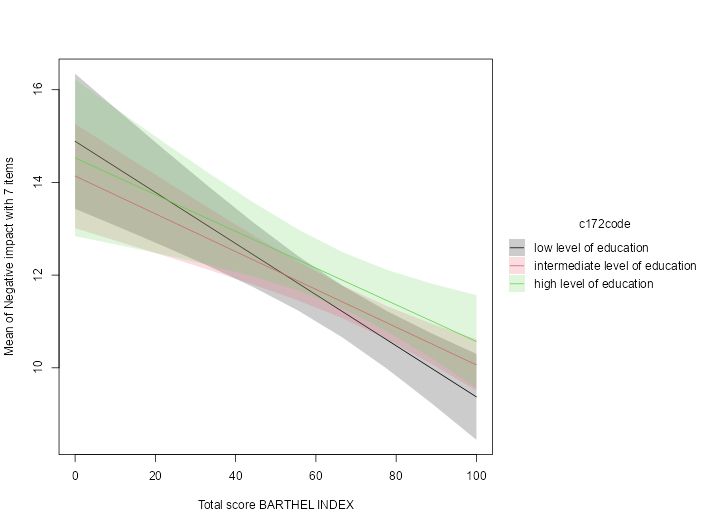
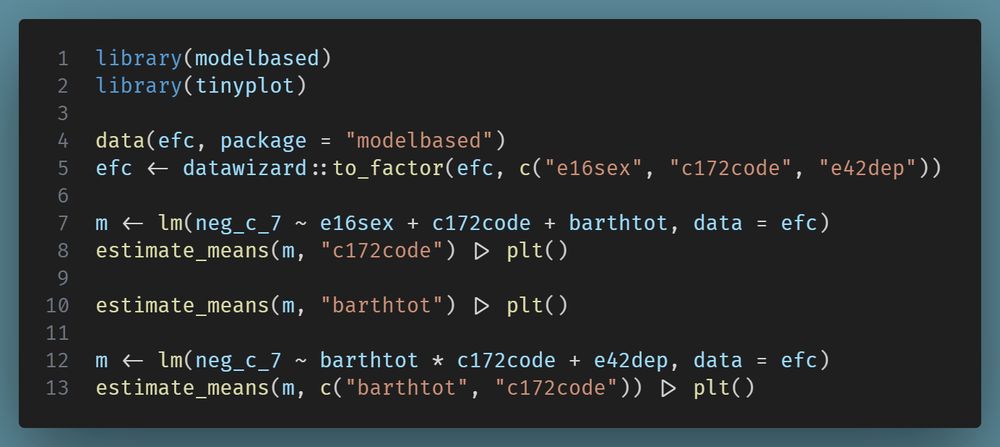
How to summarize the total effect of a categorical variable like education? A new vignette shows how to compute absolute and relative inequality with the #easystats {modelbased}📦in #rstats. Get a single, interpretable number to quantify overall group disparities!
easystats.github.io/modelbased/a...
28.07.2025 07:13 — 👍 19 🔁 2 💬 0 📌 1
Modelbased for Quick and Beautiful Model Visualization · I'm a Chordata! Urochordata!
Modelbased for Quick and Beautiful Model Visualization in #rstats imachordata.com/2025/07/25/m... Thanks, @easystats.github.io!
25.07.2025 20:38 — 👍 8 🔁 6 💬 0 📌 0
Just dodging is not yet implemented in {tinyplot}, but hopefully coming soon!
22.07.2025 15:27 — 👍 2 🔁 1 💬 0 📌 0
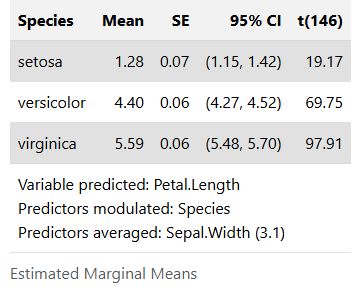
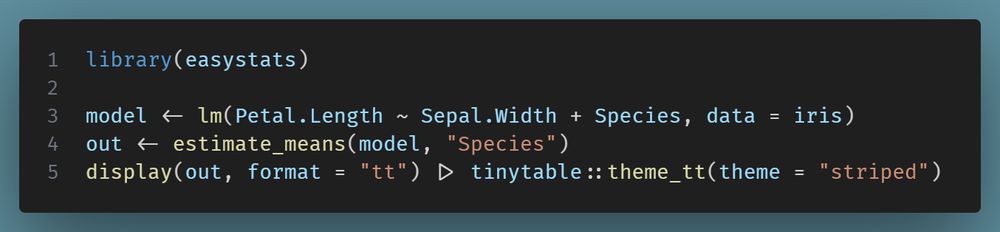
Since `display(format = "tt")` returns a `tinytable` object, you can easily modify the table to meet your needs.
22.07.2025 07:46 — 👍 1 🔁 1 💬 0 📌 0
#statstab #386 {bayestestR} Evaluating Evidence and Making Decisions using Bayesian Statistics by @mattansb.msbstats.info
Thoughts: Want to start using Bayesian stats? Here is a quick but comprehensive guide in #R
#bayesian #bayes #mcmc #easystats #guide
mattansb.github.io/bayesian-evi...
14.07.2025 22:14 — 👍 8 🔁 5 💬 2 📌 0
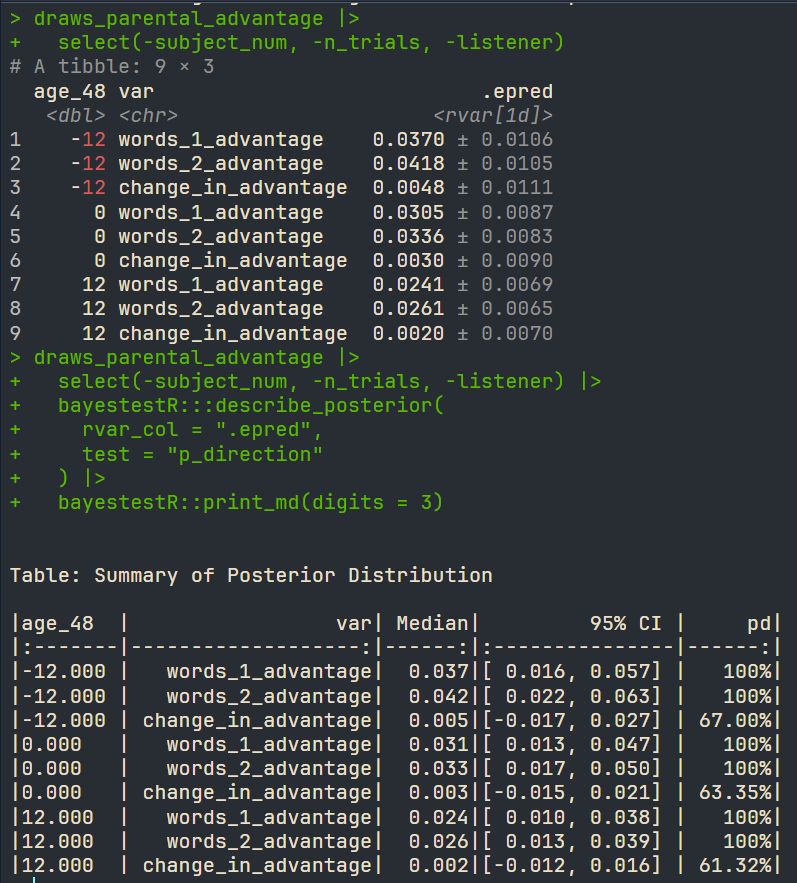
screenshot showing the row dataframe with a column of rvars and the markdown-formatted-table output of describe_posterior() + print_md()
bayestestR::describe_posterior() works on rvar columns
14.07.2025 20:52 — 👍 5 🔁 3 💬 2 📌 0
But I think the rvar-support is more recent ;-)
14.07.2025 20:58 — 👍 0 🔁 0 💬 0 📌 0
Learning resources
You may find some of the resources useful, e.g. there are two sets of slides for the {modelbased} package: easystats.github.io/easystats/ar...
(and of course the website, which gets regular updates: easystats.github.io/modelbased/)
14.07.2025 07:21 — 👍 3 🔁 1 💬 0 📌 0
- 📦parameters, performance: improvement to all functions related to factor or principal component analysis, as well as psychometric testing (Cronbach's alpha, omega...)
- 📦modelbased: better support for brms-mixture models
More updates in other packages are in the pipeline...
10.07.2025 17:49 — 👍 4 🔁 1 💬 0 📌 0
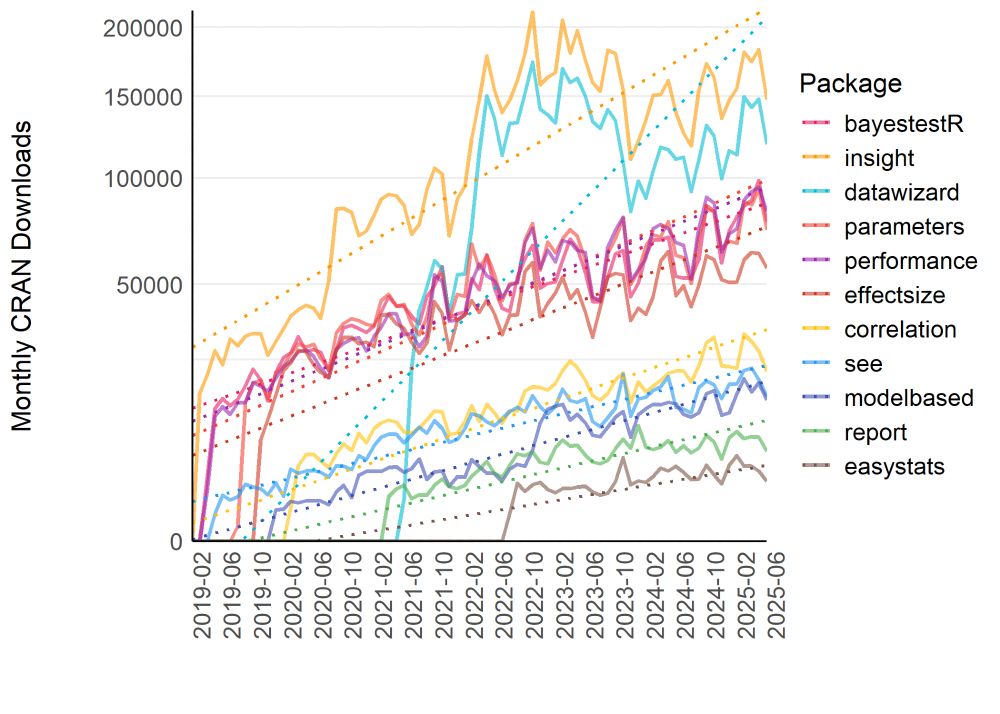
Yay, we have reached the 30 million downloads mark (and > 10k citations of our packages)! #easystats #rstats
(nice metrics, despite not 100% accurate, but still...)
05.07.2025 13:46 — 👍 21 🔁 4 💬 0 📌 2
Since we got questions regarding if model predictors also predict class membership or only the mean outcome for each class, we added a short paragraph including a summary table and some example code at the end of the vignette, clarifying the different GMM options:
easystats.github.io/modelbased/a...
25.06.2025 10:24 — 👍 7 🔁 1 💬 0 📌 0
Note that these new features require the current GitHub versions of our packages, which you can install via `easystats::install_latest()`.
24.06.2025 17:35 — 👍 2 🔁 1 💬 0 📌 0
An Introduction to Growth Mixture Models with brms and easystats
Unlock hidden patterns in longitudinal data! 🚀 Our new vignette shows how to use brms & easystats to perform Growth Mixture Models, identify unique developmental trajectories, and visualize & interpret your findings with ease. #rstats #brms #easystats
easystats.github.io/modelbased/a...
24.06.2025 17:33 — 👍 21 🔁 5 💬 1 📌 1
We do use the same approach as car::vif() (we actually report gvif).
If you have an example where our output deviates from car::vif() please do share!
24.06.2025 17:05 — 👍 1 🔁 0 💬 1 📌 0
Personally I prefer using datawizard::standardize(), and specifically using it *in the formula*.
So
mtcars$hp_z <- scale(mtcars$hp)
mpg ~ hp_z
Becomes
mpg ~ standardize(hp)
This solves both issues you raise in your post.
#rstats @easystats.bsky.social
04.06.2025 19:33 — 👍 11 🔁 3 💬 1 📌 1
And there's a non-documented option "specific", which is equivalent to `estimate_relation()`.
31.05.2025 13:13 — 👍 0 🔁 0 💬 0 📌 0
Page 3 in the paper (or the docs: easystats.github.io/modelbased/r...)
31.05.2025 13:09 — 👍 0 🔁 0 💬 0 📌 0
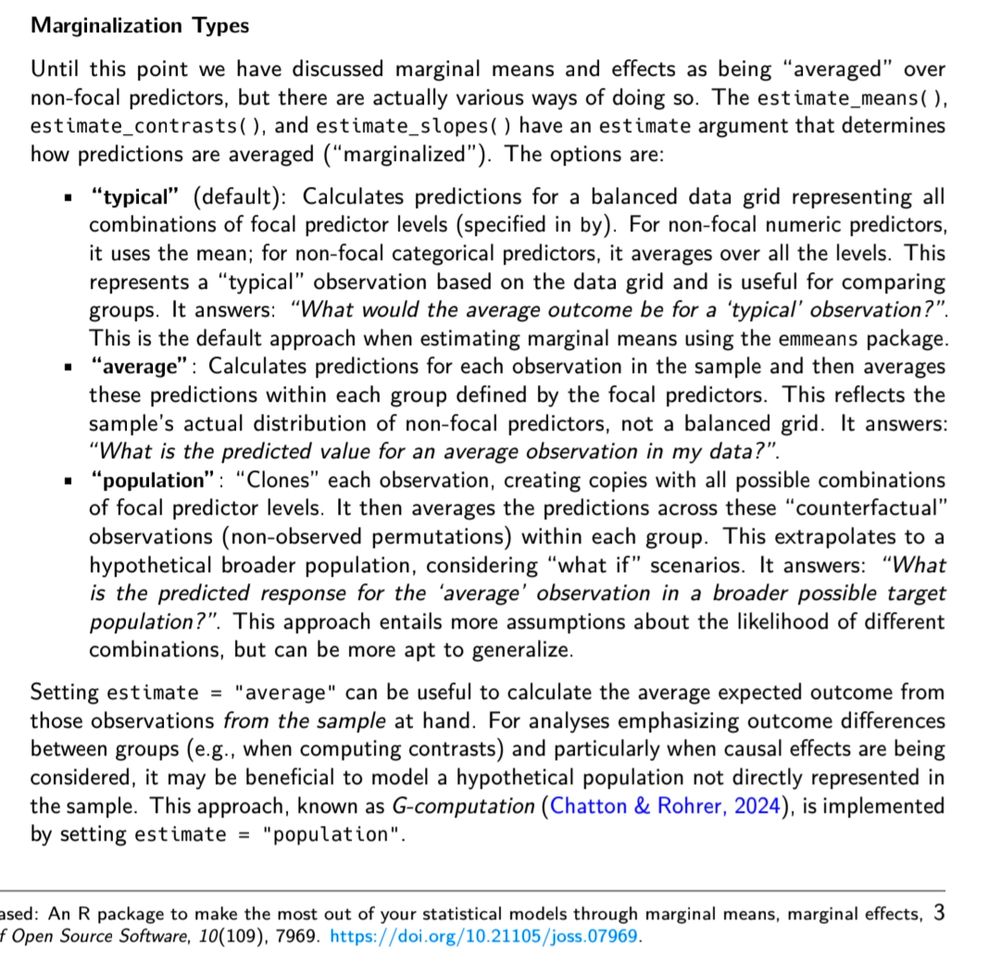
Yes, see argument `estimate`. Using this argument, you should be able to easily reproduce results from emmeans and marginaleffects::avg_predictions. It's more a matter of naming things/wording, where the modelbased approach differs from emmeans or marginaleffects.
31.05.2025 11:46 — 👍 1 🔁 0 💬 1 📌 0
We're happy to have an accompanying publication for another #rstats #easystats package published! Thanks to @vincentab.bsky.social and @tjmahr.com for reviewing the manuscript!
30.05.2025 16:36 — 👍 26 🔁 10 💬 2 📌 0
Messy data is our bread and butter!
27.05.2025 13:58 — 👍 1 🔁 0 💬 0 📌 0
Yes, exactly 💯
27.05.2025 13:57 — 👍 0 🔁 0 💬 0 📌 0
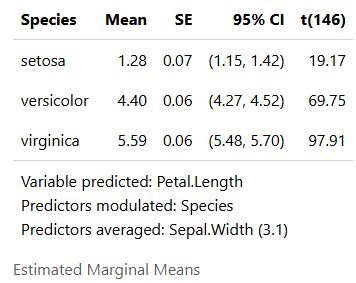
performance::check_group_variation(iris, select = "Sepal.Width", by = "Species")
#> Check Species variation
#>
#> Variable | Variation | Design
#> --------------------------------
#> Sepal.Width | both |
datawizard::demean(iris, select = "Sepal.Width", by = "Species") |>
dplyr::glimpse()
#> Rows: 150
#> Columns: 7
#> $ Sepal.Length <dbl> 5.1, 4.9, 4.7, 4.6, 5.0, 5.4, 4.6, 5.0, 4.4, 4.9, 5.4, 4.…
#> $ Sepal.Width <dbl> 3.5, 3.0, 3.2, 3.1, 3.6, 3.9, 3.4, 3.4, 2.9, 3.1, 3.7, 3.…
#> $ Petal.Length <dbl> 1.4, 1.4, 1.3, 1.5, 1.4, 1.7, 1.4, 1.5, 1.4, 1.5, 1.5, 1.…
#> $ Petal.Width <dbl> 0.2, 0.2, 0.2, 0.2, 0.2, 0.4, 0.3, 0.2, 0.2, 0.1, 0.2, 0.…
#> $ Species <fct> setosa, setosa, setosa, setosa, setosa, setosa, setosa, s…
#> $ Sepal.Width_between <dbl> 3.428, 3.428, 3.428, 3.428, 3.428, 3.428, 3.428, 3.428, 3…
#> $ Sepal.Width_within <dbl> 0.072, -0.428, -0.228, -0.328, 0.172, 0.472, -0.028, -0.0…
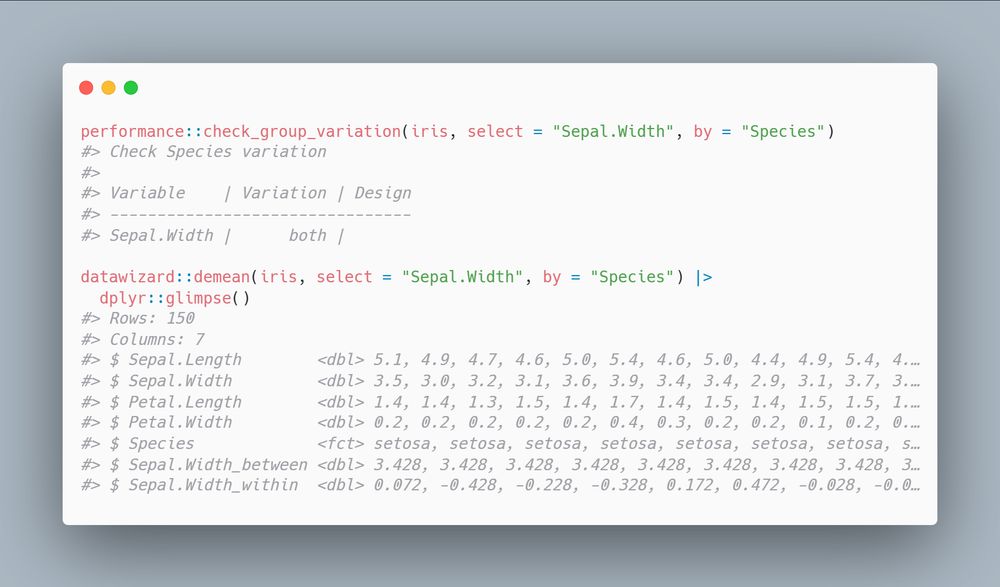
This function can also be used to detect any predictors that might cause heterogeneity bias - variable that vary both within and between groups, that can be treated with datawizard::demean()
easystats.github.io/datawizard/r...
27.05.2025 06:48 — 👍 10 🔁 0 💬 0 📌 0
mlmRev::egsingle |>
performance::check_group_variation(
select = c("female", "grade", "math"),
by = c("schoolid", "childid"),
include_by = TRUE
)
#> Check schoolid variation
#>
#> Variable | Variation | Design
#> ------------------------------
#> childid | both | nested
#> female | within | crossed
#> grade | both |
#> math | both |
#>
#> Check childid variation
#>
#> Variable | Variation | Design
#> -----------------------------
#> schoolid | between |
#> female | between |
#> grade | both |
#> math | both |
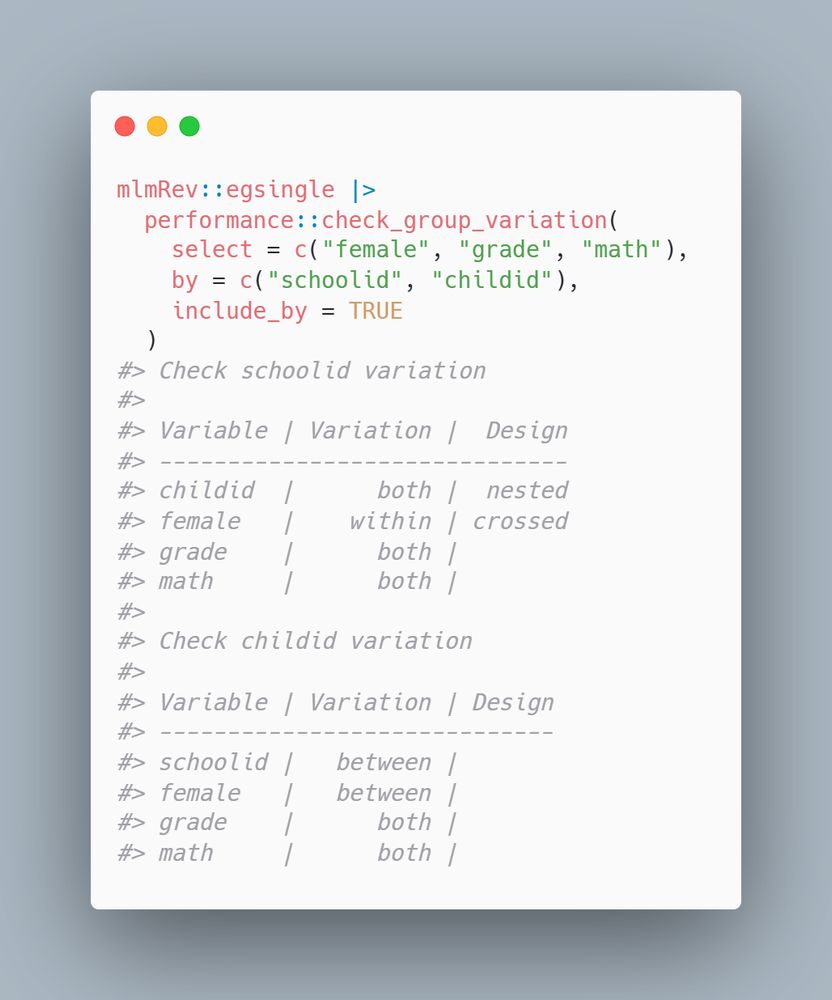
🆕 Introducing check_group_variation() in the {performance} #Rstats package! 🎉
This function makes it easy to checks if variables vary within or between levels of grouping variables.
Perfect for understanding and designing mixed models 🚀
easystats.github.io/performance/...
#stats #easystats
27.05.2025 06:48 — 👍 44 🔁 14 💬 3 📌 0
It's slightly different, it adjusts for trial count.
22.05.2025 21:36 — 👍 3 🔁 0 💬 1 📌 0
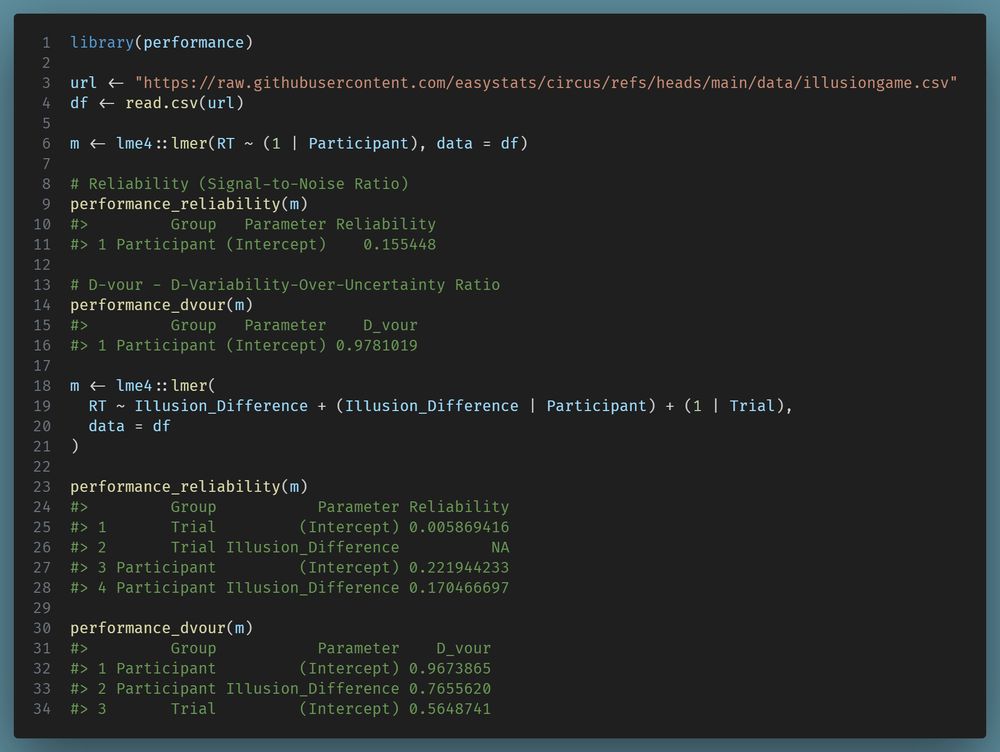
One function per week, this time we look closer at random effects variances in mixed models: `performance_reliability()` & `performance_dvour()`. Is the variability in your data due to noise within groups, or actual differences between groups? #easystats #rstats easystats.github.io/performance/...
22.05.2025 20:50 — 👍 11 🔁 1 💬 2 📌 0
🧮 Statistics & data science
💊 Clinical trials & R&D & Epidemiology
💻 R enthusiast
👩💻 Stats @ loyal.com
https://jesslgraves.github.io
Eye-tracking, Pupillometry, Word nerd, Learning and Memory, Language, R, Stats, Quant, Director Human Neuroscience Lab @bostoncollege www.drjasongeller.com
Assoc Prof of Methodology and Statistics at Maastricht University. Interests: meta-analysis, ESM/EMA, mixed-effects models, computational statistics, research software, R, FLOSS, GNU/Linux, chess, piano, lolcats. The views expressed are those of my cats.
Creating open materials for teaching reproducible research https://psyteachr.github.io
🇨🇦 Distinguished Research Professor at the University of Calgary. Creator of the PROCESS macro for SPSS, SAS, and R. Director of the Canadian Centre for Research Analysis and Methods. afhayes.com haskayne.ucalgary.ca/ccram/academy (he/him) 🇺🇦
Not for profit organization founded by the R Core Team to provide support for the R project. A reference point for interaction with the R development community.
Assistant Professor of Communication at the University of South Carolina | PhD from Ohio State | political communication, public opinion, some other stuff
You might know me from my jtools, interactions, and panelr #rstats packages
https://jacob-long.com
CS/Math Stat/UCSF Assoc Prof
R Foundation/R Consortium
https://futureverse.org, https://mastodon.social/@henrikbengtsson
#RStats
Scientist and software developer. Creator of tidyplots.org. Website jbengler.de.
Economics and data science | Former academic now working in the tech sector | Views my own | 🇿🇦 in 🇺🇸 | https://grantmcdermott.com/
🧑💻 "Chaotic Good Developer" at ThinkR 🦹♀️ Long-distance runner 🏃♀️ Vegan 🌱 Metalhead 🤘Here to complain about computers 💻
CTO at a specialty insurance company. Perpetual cocktail party host, open source fan, econometrician, agricultural economist, and OReilly Author.
Professor of Epidemiology/Global Health. Caring about kindness in academia. @busph Free Associations podcast co-host pophealthex.org/fa
PhD in economics from LISER, Luxembourg, now looking for research software engineer or data science positions. Mostly here to talk about #rstats
https://github.com/etiennebacher
Using statistics and programming to turn data into (maximum) utility. Former neuroscientist. Preaches Bayesianism, utilitarianism, and effective charities.
Retired professor of psychology at University of Oxford. Interests in developmental neuropsychology and improving science. Blogs at deevybee.blogspot.com
Data science (AKA statistics). Likes conditioning on the data (AKA Bayes). Blog at https://www.sumsar.net. Works at http://Normative.io.
Senior Data Scientist in insurance. Dr in economics. Here for #RStats 📊 & 🐍. Family 👨👩👧👦 guy who loves coffee ☕️ & tea 🫖 and 🇯🇵
Author of Practical R for Mass Communication & Journalism
❤️ #RStats, writing & cities designed for walking/biking
Having fun with #GenAI
(Mostly) retired; former tech journalist
Also #VibrantAging #Running #Photography #Crochet #ASL #NoBridge
Em. Prof., UC Davis. Many awards, incl. book, teaching, public service. Many books, latest The Art of Machine Learning (uses qeML pkg). Former Editor in Chief, the R Journal. Views mine. heather.cs.ucdavis.edu/matloff.html