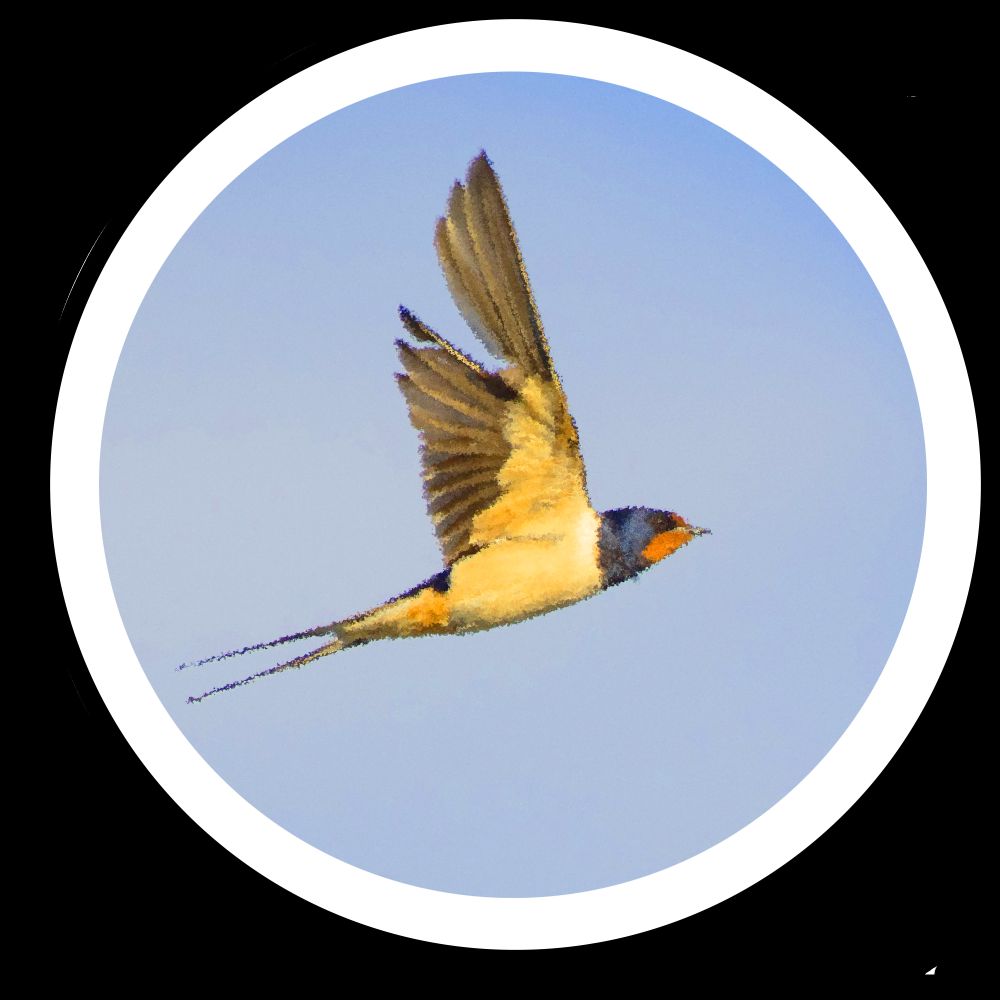
Final push through the BBRC rarity reports to have the complete UK's rare bird records on my interactive website:
tony-rinaud.shinyapps.io/WP_rare_birds/
Here is the current entries for the Naumann's thrush in the Western Palearctic!
#Birding #Mega #RareBirds #Rstats #Ecology
16.09.2025 11:22 — 👍 2 🔁 0 💬 0 📌 0
Time to publish ethically: DAFNEE, a database of academia-friendly journals in ecology and evolutionary biology.
New preprint: we advertise DAFNEE, a database of academia-friendly eco-evo-archaeo journals. 1/6
#AcademicPublishing #ecoevo #archaeology #EthicalPublishing #SocietyJournals #DiamondOpenAccess
doi.org/10.32942/X24...
24.06.2025 18:42 — 👍 77 🔁 69 💬 1 📌 6
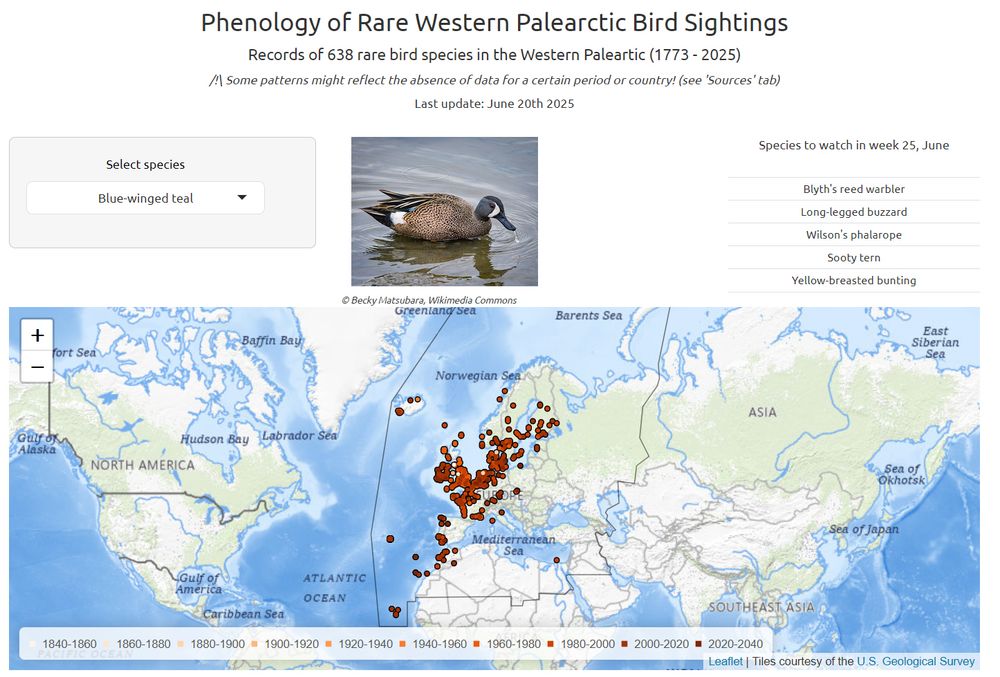
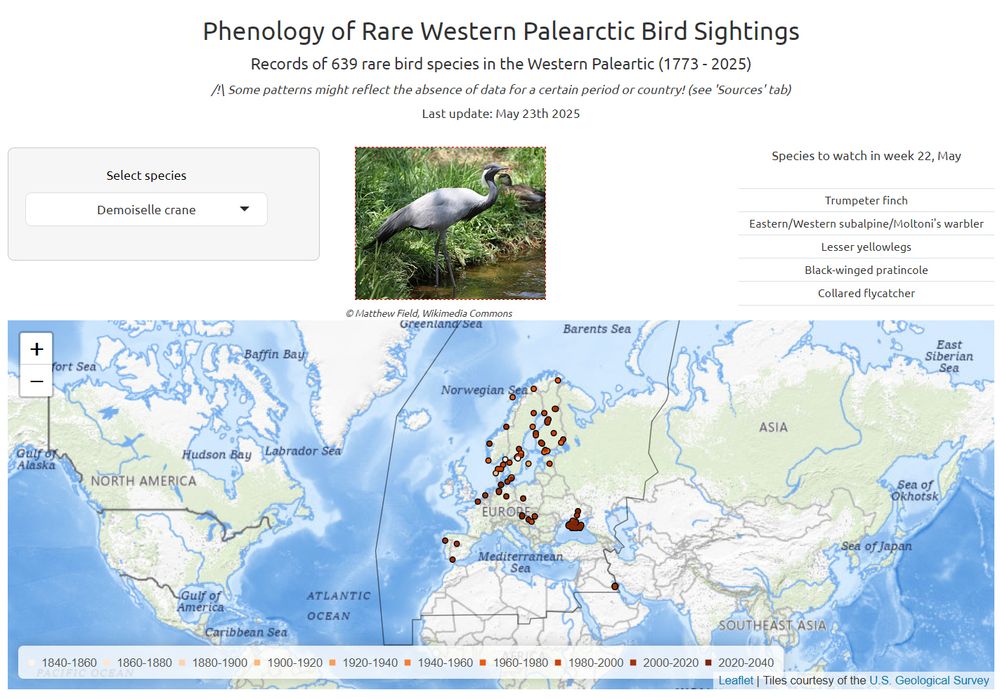
A fresh version of the Rare birds in Western Palearctic is live on tony-rinaud.shinyapps.io/WP_rare_birds/!
New sightings are coming from Syria, Poland and Luxemburg.
Many thanks for the respective members for their help!
#Rstats #Shiny #RareBirds #WPBirding #MEGA
@bio-data.bsky.social
20.06.2025 21:10 — 👍 6 🔁 4 💬 0 📌 0
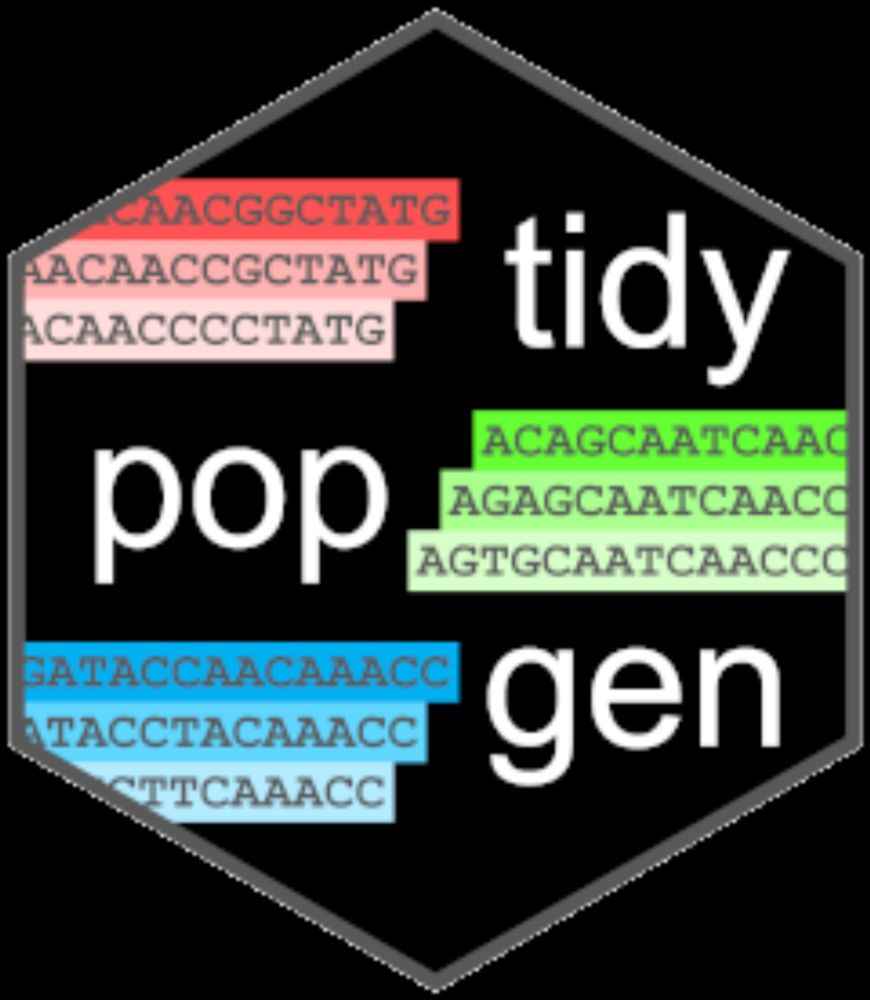
Tidy Population Genetics
We provide a tidy grammar of population genetics, facilitating the manipulation and analysis of data on biallelic single nucleotide polymorphisms (SNPs). `tidypopgen` scales to very large genetic data...
We are excited to announce that tidypopgen – a new package for rapid population genetic workflows in R – is now available at evolecolgroup.github.io/tidypopgen/ 🧬💻 Read more in the preprint describing its features here: www.biorxiv.org/content/10.1... #popgen #Rpackage #genetics 1/2
20.06.2025 12:19 — 👍 46 🔁 21 💬 2 📌 2
Link to this website: tony-rinaud.shinyapps.io/WP_rare_birds/
20.06.2025 12:59 — 👍 0 🔁 0 💬 0 📌 0
#Rstats #Rare_birds #Birding #Shiny #BioData
20.06.2025 12:59 — 👍 0 🔁 0 💬 1 📌 0
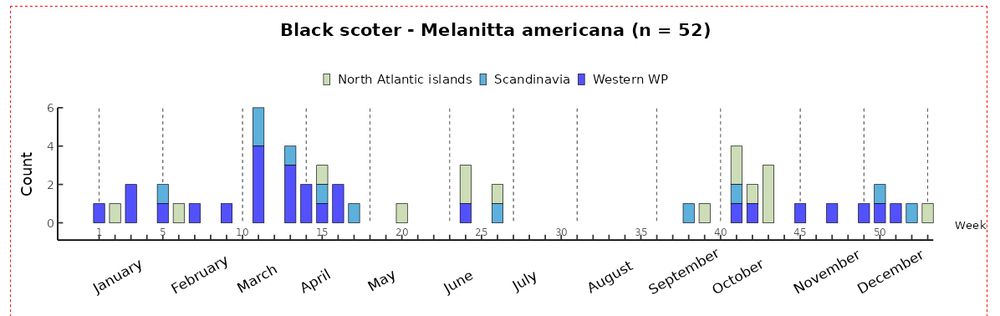
Reach out to Biodata if you need custom visualizations for your biological datasets!
This example is taken from my interactive website about rare bird sightings in the Western palearctic. It represents the yearly distribution of Black scoter sightings in this region, colored for subregions. #Rstats
20.06.2025 12:58 — 👍 4 🔁 2 💬 1 📌 0
a) and b) panels are for the grey partridge, the dominated species and c) and d) for the red-legged partridge, the dominant in this relationship.
16.06.2025 04:22 — 👍 0 🔁 0 💬 1 📌 0
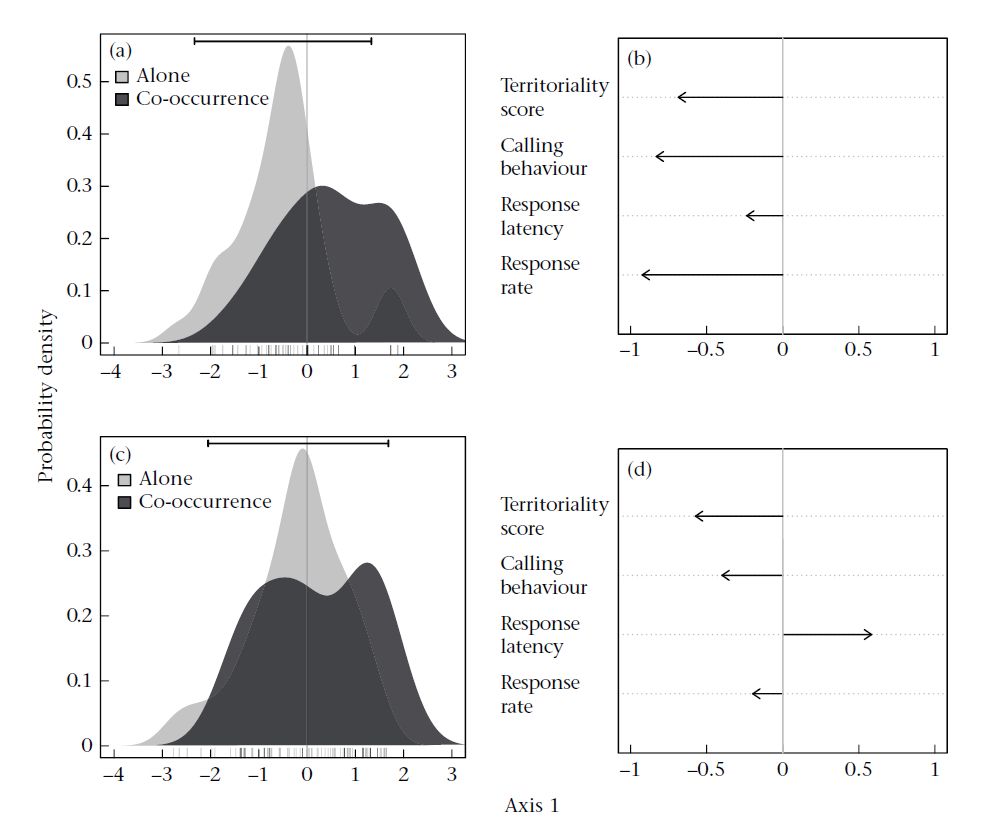
I wanted to show you an output from a behavioural discriminant analysis that I developed while studying interspecific competition between two sympatric farmland partridges.
The bigger, more agressive species was shifting the behavioural display of the dominated one!
#Ecology #Birds #AnimalBehaviour
16.06.2025 04:19 — 👍 1 🔁 1 💬 1 📌 0

Check our services on this page: www.bio-data.fr/book-online
From personalized data analyses and visualizations to custom script to optimize your workflow, we are happy to deliver state-of-the-art outputs from our 10+ years experience!
06.06.2025 10:32 — 👍 1 🔁 1 💬 0 📌 0
Get in touch if you need genomic or transcriptomic analyses for your research or conservation projects!
bio-data.fr/contact
13.06.2025 09:49 — 👍 0 🔁 0 💬 0 📌 0
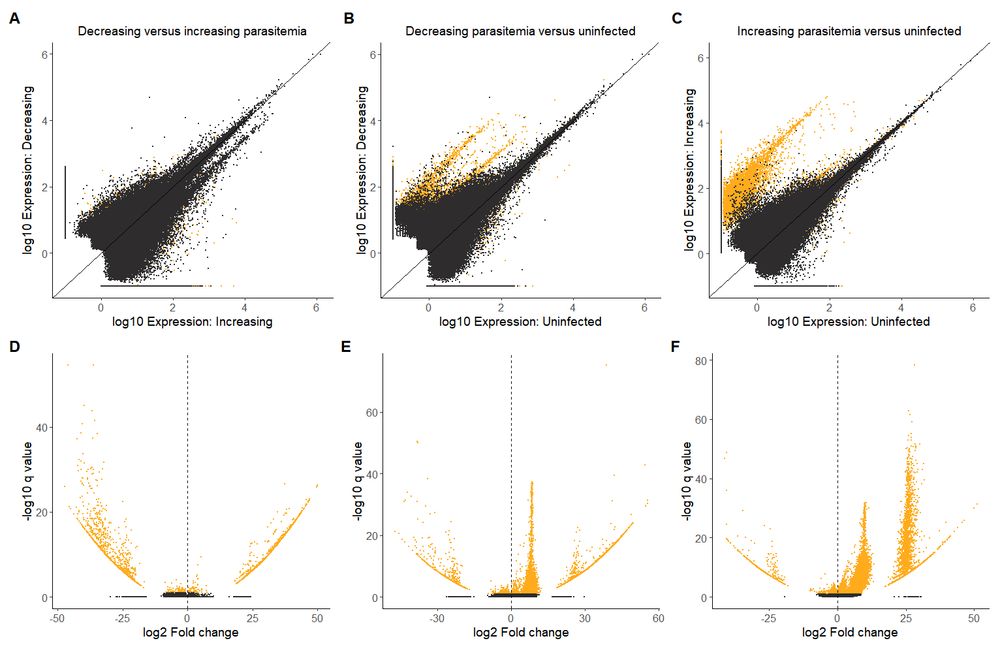
Another project under prep is a host transcriptomic reaction to blood parasite infections in young wild raptors!
This is the gene expression difference between hosts in subsequent infection stages, seen using volcano and Mean-Adjusted plots.
#Rstats #Bioinformatics #RNAseq #Bloodparasites #Raptors
13.06.2025 09:47 — 👍 4 🔁 0 💬 2 📌 0
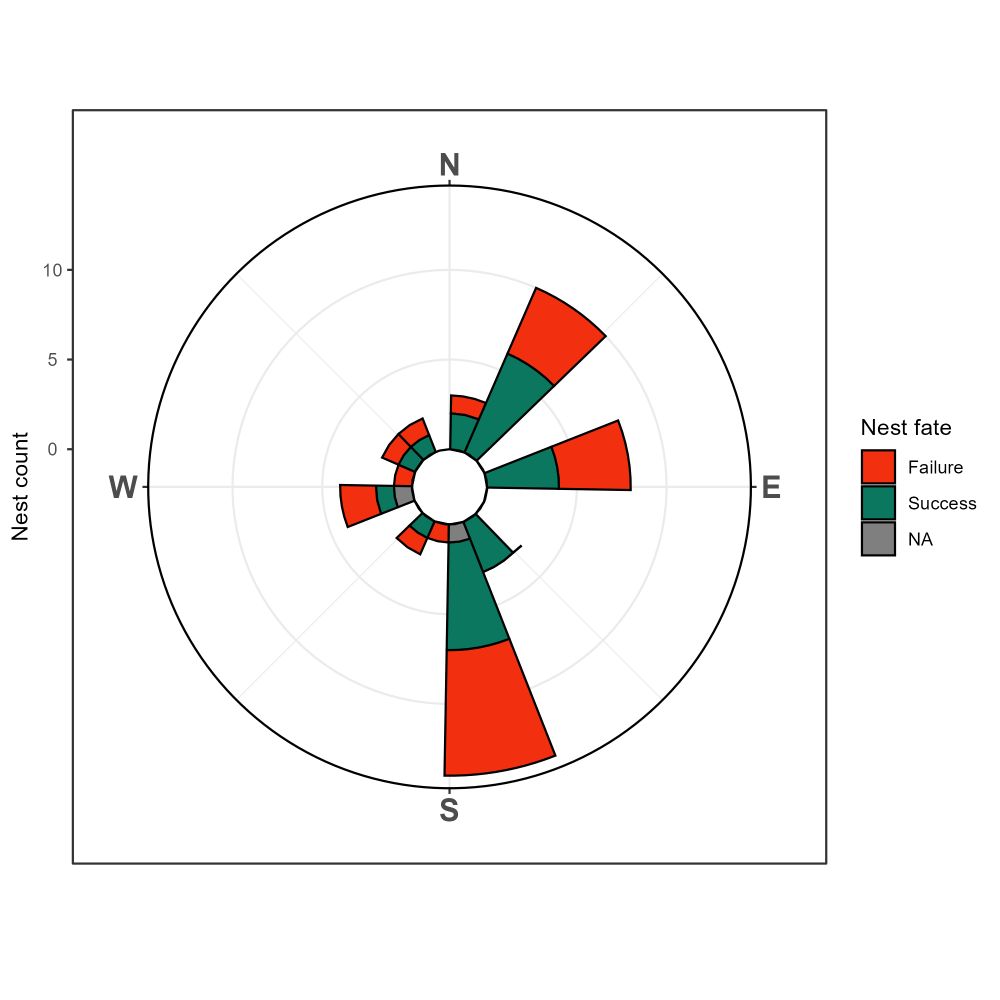
Another example of data visualization I am working on at the moment: nesting success of a North American passerine according to nest opening orientation!
#Rstats #Dataviz #Birding #Science #Ecology
12.06.2025 07:32 — 👍 4 🔁 0 💬 1 📌 0
Check our services on this page: www.bio-data.fr/book-online
From personalized data analyses and visualizations to custom script to optimize your workflow, we are happy to deliver state-of-the-art outputs from our 10+ years experience!
06.06.2025 10:32 — 👍 1 🔁 1 💬 0 📌 0
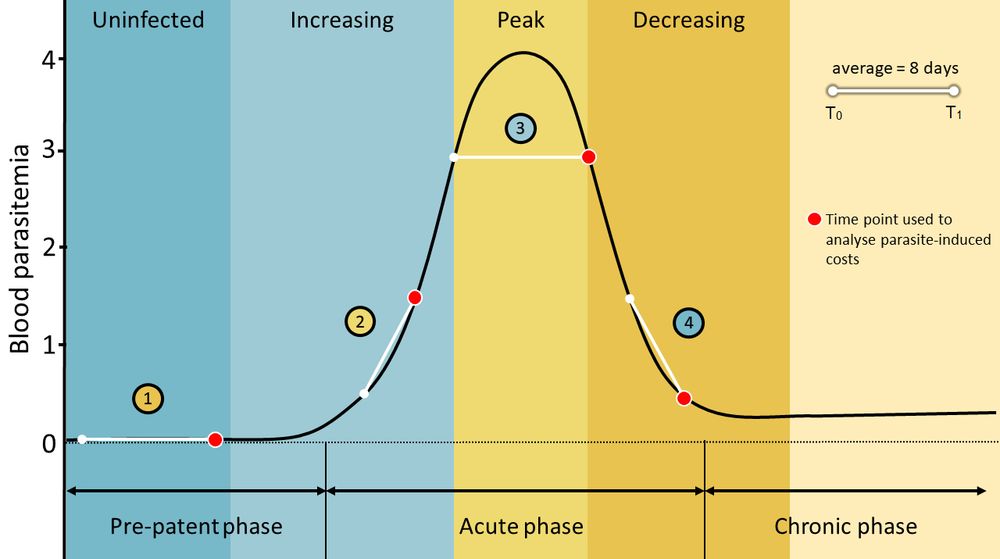
This figure represents a theorical infection course from Leucocytozoon parasites in the host blood. The different stages of infection are depicted on the y-axis in colour bands and blood parasitemia (or infection intensity) is on the x-axis.
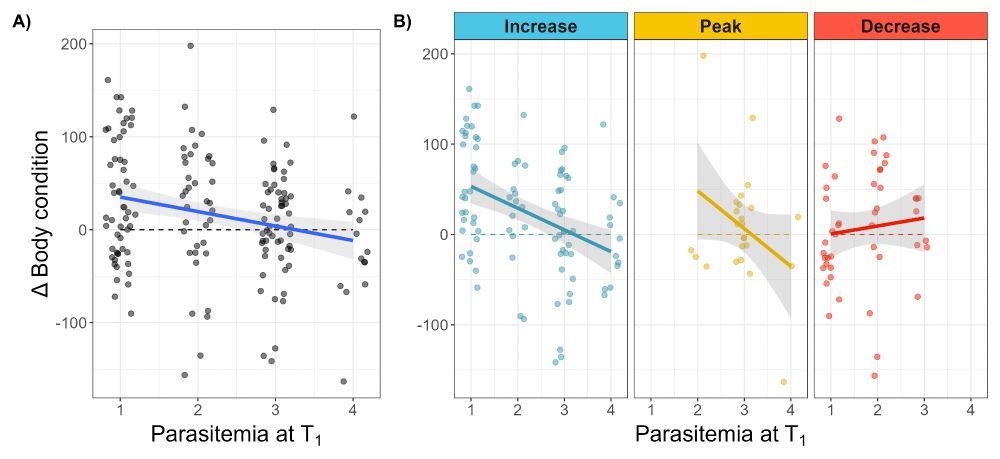
This figures showcase the relationship between host body condition and the blood parasitemia (or infection intensity), in A) for all infection stages, in B) for each infection stage (Incresing, peak and decreasing parasitemia).
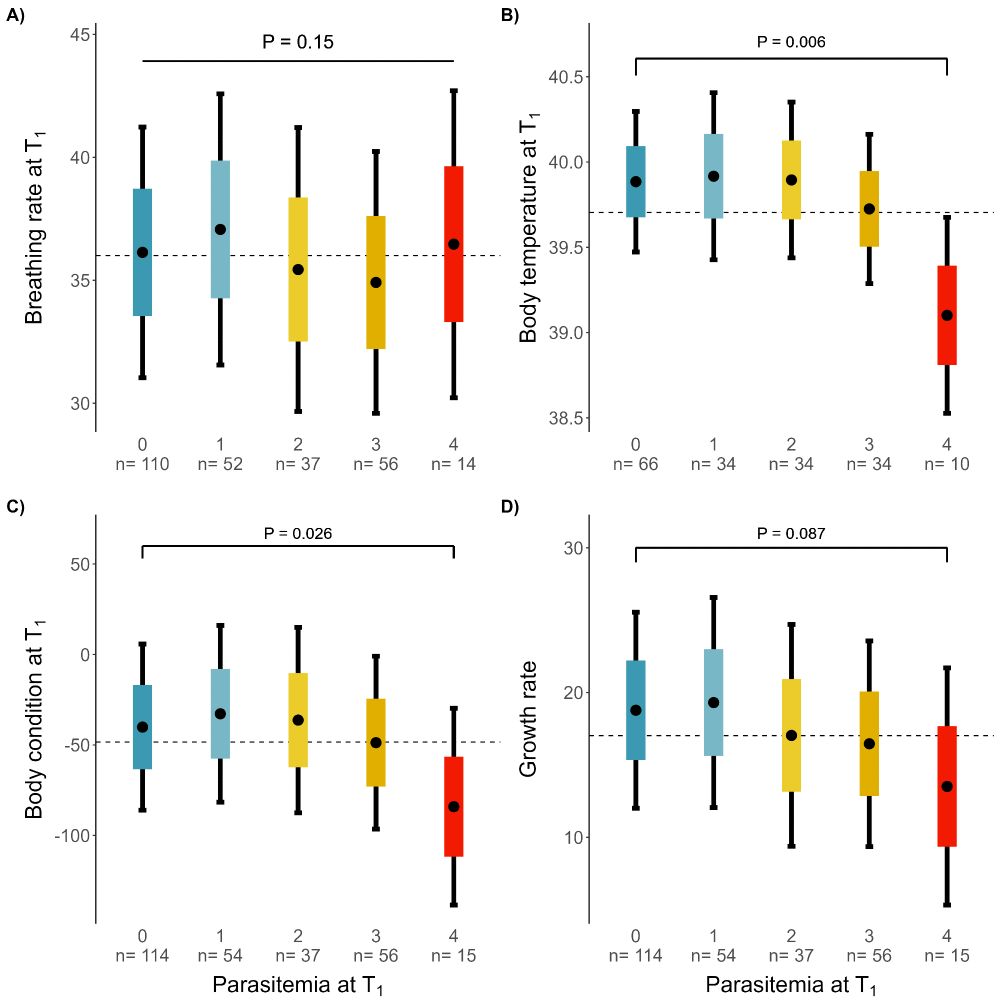
This last figure shows the relationship between four physiological parameters and the host parasitemia (or infection intensity). P-values are displayed at the top of each of the four boxplots.
These are some figures extracted from my latest scientific publication in Frontiers in Ecology and Evolution
www.frontiersin.org/journals/eco...
Contact us for high-end personalized visualization from ecological datasets!
#Rviz #Stats #Sciences #Ecology #Research
02.06.2025 17:45 — 👍 1 🔁 2 💬 1 📌 0
My most recent project, a shiny interactive website:
tony-rinaud.shinyapps.io/WP_rare_birds/
I designed a custom R code to showcase key statistics from a dataset about rare bird sightings in the Western Palearctic.
Reach out @bio-data.bsky.social if you need a personalized interactive website!
03.06.2025 10:13 — 👍 2 🔁 2 💬 0 📌 0
This figure represents a theorical infection course from Leucocytozoon parasites in the host blood. The different stages of infection are depicted on the y-axis in colour bands and blood parasitemia (or infection intensity) is on the x-axis.
This figures showcase the relationship between host body condition and the blood parasitemia (or infection intensity), in A) for all infection stages, in B) for each infection stage (Incresing, peak and decreasing parasitemia).
This last figure shows the relationship between four physiological parameters and the host parasitemia (or infection intensity). P-values are displayed at the top of each of the four boxplots.
These are some figures extracted from my latest scientific publication in Frontiers in Ecology and Evolution
www.frontiersin.org/journals/eco...
Contact us for high-end personalized visualization from ecological datasets!
#Rviz #Stats #Sciences #Ecology #Research
02.06.2025 17:45 — 👍 1 🔁 2 💬 1 📌 0
Dryad is an open data publishing platform and community, committed to making data-sharing and re-use easy, powerful and compelling. #nonprofit #opensource #openaccess. https://datadryad.org/
Please contact help@datadryad.org for support.
GWIS | MorphoBank | Historical Biology | SORTEE | SSB | EcoEvoRxiv
assistant professor @lewisandclark
she/her | hapa🍚
previously: @cefemontpellier @utaustin
fun times: 🤽🏽♀️🧘🏽♀️🏊🏽♀️🏃🏽♀️🏋🏽♀️🖌️🪡🧵
Double Degree International Master Program between 🇩🇪 Würzburg & 🇳🇴 Bergen in 🌱Ecology, 🌿Conservation & 🌡️Global Change
https://www.ecology-conservation.de/
The goal of the Canadian BioGenome Project is to produce high-quality reference genomes 🧬 for all Canadian species 🌎
Sequencing Canada's Biodiversity 🌿🦋🐍🧬🐢🦌🐸🌳🐿🐙🦈🦦
Learn more: https://linktr.ee/canadianbiogenome
Web development, data management and visualizations. Consulting services for scientific and r&d communities. https://www.researchelements.org/
Climate scientist at the National Centre for Atmospheric Science, University of Reading | IPCC AR6 Lead Author | MBE | Views own | https://edhawkins.org
Warming Stripes: http://www.ShowYourStripes.info
Behavioural ecologist investigating the smell of birds | Animal behaviour | Chemical communication | Ornithology | https://marc-gilles.github.io/ | he/him
Behavioural ecologist studying cognition, social behaviour, gut microbiota & urbanisation | R enthusiast | Assistant Prof. at Université de Rennes #NewPI | She/her
http://camilletroisi.weebly.com
PhD Bio Sci. Behavioural ecology & comparative cognition, mostly on birds. Loves corvids & D&D. she/her 🐦
Houston Professor of Ornithology, University of Saskatchewan. Ornithology and behavioural ecology, especially chemical communication and microbial ecology. Views are my own. #NewPI 🪶🌈
Vagrant ornithologist currently located in Oviedo, Spain and working for Pivotal Future. Birds, parasites, ecology, demography, speciation. He/him 🇬🇧🇸🇪🏳️🌈
Views my own.
Birds, parasites, vectors. Researcher and lecturer. Thoughts often random, always mine. Owned by two loopy labradors 🏳️🌈 #LincolnSwans
My lab studies wildlife microbiomes at Uppsala University, Sweden.
SciLifeLab Group Leader.
Previously at Brown University & Smithsonian.
Molecular Ecology, Evolution, Genomics, Hologenomics, Conservation Biology.
she/her. https://www.videvall.com/
Doctor of Birds at SUNY Oswego. Opinions = mine, not representative of NY state government. I run a banding station: @rcbobirds on IG.
Squid biologist
Science communicator
Artist
Philadelphian
I run @SkypeAScientist.bsky.social
Creator of the SquidMobile
https://linktr.ee/Sarahmackattack
Forbes Bio Station Director
Wetland Bird/Waterfowl @ Illinois Natural Hist Survey
Posts do not represent my employer
President @wilsonornithsoc.bsky.social
Gardening
she/her
aurielfournier.github.io
forbes-bio-station.inhs.illinois.edu
Conservation biologist, scicomm, wild cat research. Views my own. She/her.
Scientist (he/him) @cnrs.bsky.social https://oliviergimenez.github.io/
Grown statistician • Improvised ecologist • Sociologist apprentice
Statistical ecology • Bayesian statistics • Mammals
#rstats