Avoid travelling in touring coaches to avoid airborne disease
#COVIDisNotOver #COVIDisAirborne
@airspotrob.bsky.social
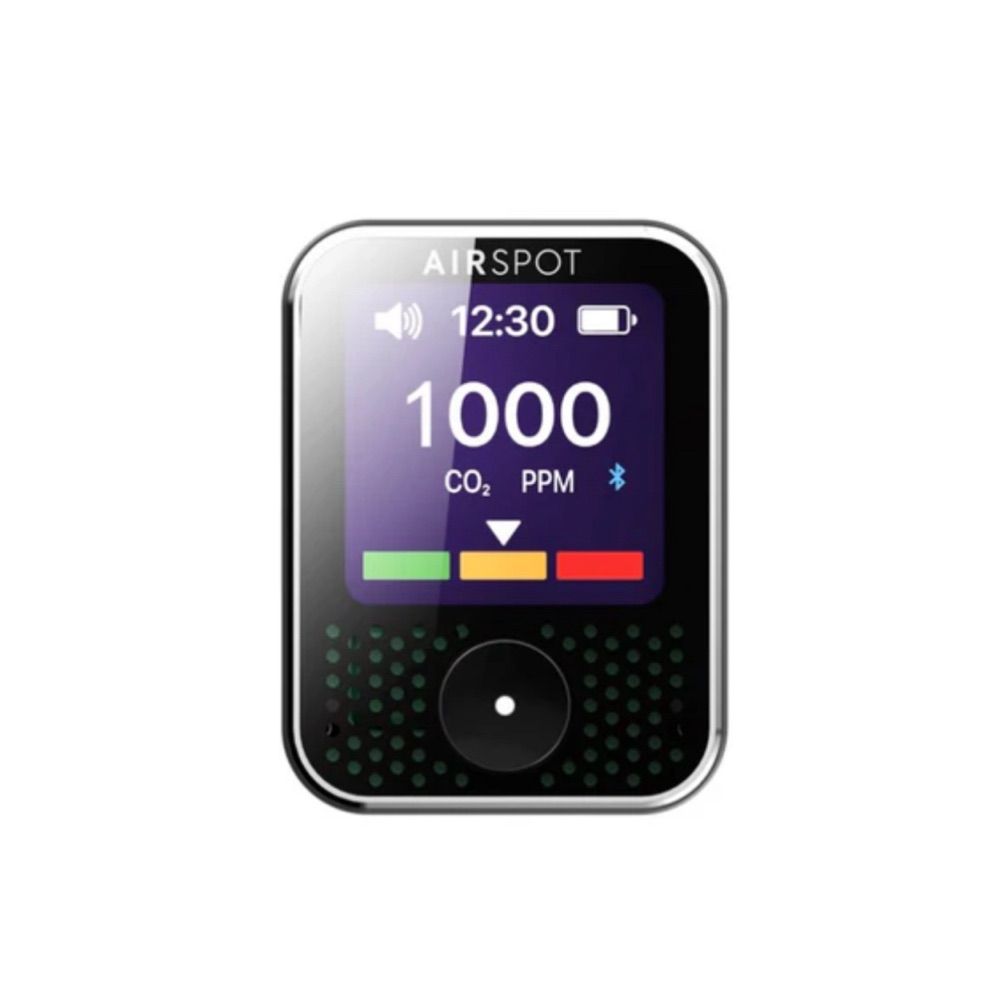
AirSpotHealth.com Our Smallest CO2 Monitor! #CleanIndoorAir #COVIDisAirborne
Avoid travelling in touring coaches to avoid airborne disease
#COVIDisNotOver #COVIDisAirborne
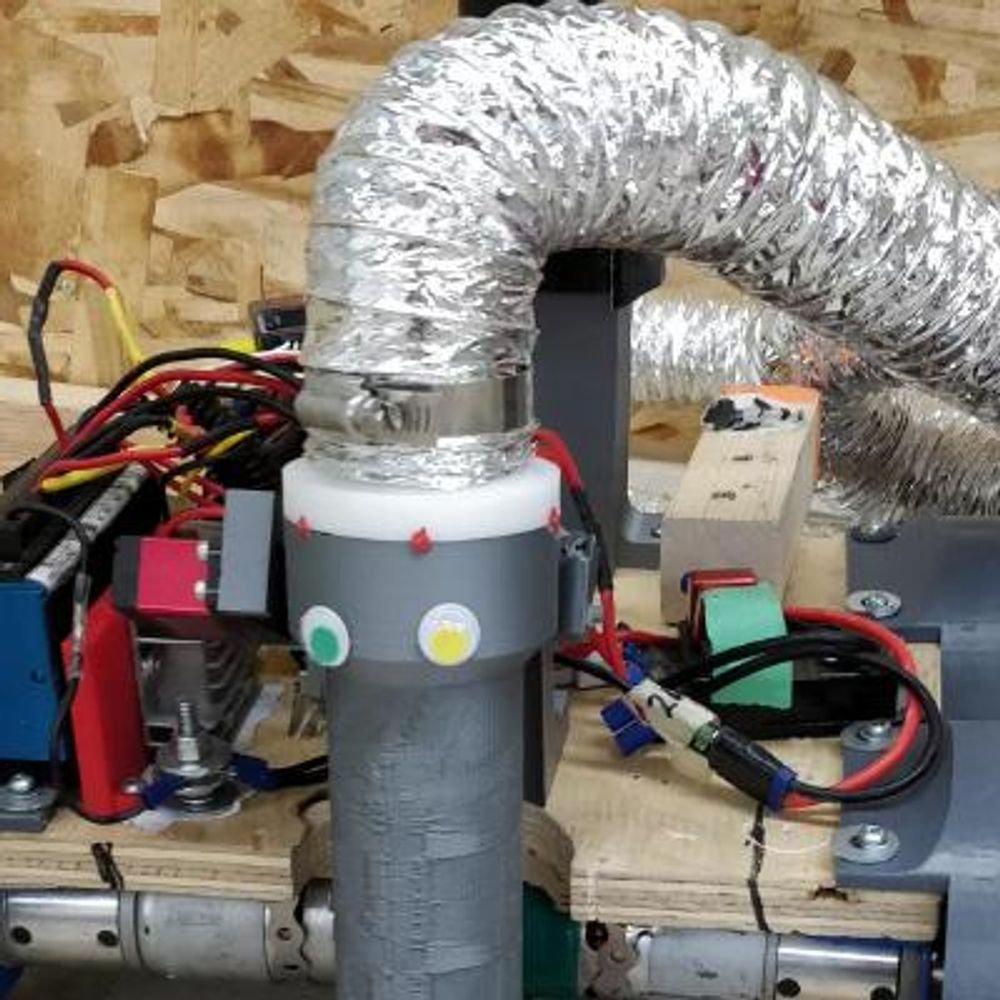
I travelled a couple of times on Flixbus and had an aweful experience with the air quality. I had to complain all times about a lack of air ventiallation
22.02.2026 18:54 — 👍 1 🔁 1 💬 0 📌 0
New Transcriptomic Clock Unveils T Cell Aging in COVID,HIV
"Patients with acute COVID, they found two clear effects. First, COVID altered T cell composition, including significant reductions in naïve CD8 and naïve CD4 T cells. Second, the infection increased the biological age of naïve CD8 T cells"

Screenshot of a social media post by The Yeti of Kananaskis (@kananaskinyeti). The post reads: “People are willing to try anything to not get sick except the only thing that reliably works because that one thing can’t be done secretly and spoils the illusion that everything is alright.” Timestamp: 5:16 AM · Feb 18, 2026. Views: 25K Views.
The Yeti of Kananaskis @kananaskinyeti.bsky.social
"People are willing to try anything to not get sick except the only thing that reliably works because that one thing can’t be done secretly and spoils the illusion that everything is alright."
Source: x.com/kananaskinye...

Figure 9 from a Western Australia COVID-19 report showing COVID-19 notifications and test positivity by notification week from 2023 to 2026 YTD. Blue bars represent weekly PCR-confirmed COVID-19 cases (left axis, up to 1,600), and a black line represents percentage test positivity (right axis, up to 20%). The chart shows multiple waves, with large peaks in 2023 and early 2024 where positivity reaches around 15–18%. Activity declines through late 2024, with smaller waves in 2025. By early 2026, both cases and positivity are low. The most recent data point shows around 90 notifications for the week, with test positivity just under 3% (approximately 2.5–3%).

Figure 10 from a Western Australia COVID-19 report showing the 7-day average of COVID-19 cases currently in hospital or in ICU from 2023 to 2026 YTD. Blue bars represent total hospitalised cases, and orange bars represent ICU cases (a subset of hospitalised). The y-axis shows number of hospitalised cases (up to 300), and the x-axis shows week ending dates from early 2023 to early 2026. The chart shows several waves, with peaks above 200 hospitalisations in 2023 and smaller peaks through 2024 and 2025. Trends generally decline over time. By early 2026, hospitalisations are low and stable at around 18 patients per day, with ICU cases near zero.

Figure 11 from a Western Australia COVID-19 report showing SARS-CoV-2 concentration in wastewater and COVID-19 notification rates in the Perth metropolitan area from 2023 to 13 February 2026. A dark blue line represents the 14-day weighted average of wastewater viral concentrations (left axis, up to 30,000 genome copies per 50 mL), and a yellow line represents the 14-day average COVID-19 case rate per 100,000 population (right axis, up to 100). The chart shows large peaks in wastewater and case rates during 2023 and early 2024, followed by smaller waves through 2024 and 2025. By early 2026, both wastewater levels and case rates are very low, with the most recent data near baseline, indicating low viral activity in the community.

Dashboard titled “SARS-CoV-2 variant lineages” showing the distribution of variants in clinical samples (top graph) and wastewater samples (bottom graph) in the Perth metropolitan area from 17 August 2025 to 1 February 2026. Filters at the top include date ranges (last 6 months selected), last 12 months, last 18 months, all dates, calendar YTD, and explanatory notes. The clinical samples chart (stacked bar graph) shows changing proportions of variants over time. Earlier months (September–October 2025) include a mix of variants, with some BA.2/BA.5-related lineages. By late 2025 into early 2026, newer variants dominate, including KP, NB.1.8.x, XBB, XEC, and XFG lineages, with proportions shifting week to week. The wastewater samples chart (stacked bar graph) shows similar trends but with more variability, including detection of multiple variants simultaneously. Later months show increasing presence of newer lineages such as XEC and XFG, alongside KP and NB.1.8.x. A legend at the bottom lists variant lineages including BA.2.75.x, BA.2.86.x, BA.2.x, BA.3.2.x, BA.4.x, BA.5.x, JN.1.x, KP.3.x, KP.x, NB.1.8.x, Recombinant lineages, XBB.x, XEC.x, and XFG.x. A button below reads: “Click here to view wastewater surveillance trends report.”
WA weekly COVID update: Week ending 16 Feb 2026
🔸COVID positivity rate: 2.8% est. (+0.7%)
🔹Reported cases: Increased to 90 (+34.3%)
🔹Hospitalisation: Stable at 18 per day (Stable)
🔹ICU: 7-day average is zero (+0.0%)
Source: health.wa.gov.au/Articles/F_I...

Screenshot of The Boston Globe article titled “A father fights for his daughter’s future as she struggles with long COVID,” by Felice J. Freyer (updated Feb 20, 2026). Subheading notes researchers now recognize eight forms of long COVID, with slow treatment progress. Main image shows Samantha Crausman, 28, lying in bed wearing an eye mask, covered with a blanket in a dim bedroom with pillows and items nearby. Reflected in the window, her father, Dr. Robert S. Crausman, stands outside on a porch wearing a mask and winter clothing, looking in. The scene highlights strict precautions to avoid reinfection, including limited contact and visitors staying outside.
Samantha Crausman, 28, has had ongoing symptoms since a COVID infection 4 years ago. She and her parents were fully vaccinated when they got COVID in 2022, but only she didn’t recover. At risk of worsening with reinfection, her family still lives with strict pandemic-level protections.
#LongCOVID

Australia Weekly COVID Update, 20 Feb 2026. SA up +36.5% (weekly update; 5 deaths). WA up +34.3% (weekly update; avg 18/day in hospital). VIC up +29.0% (fortnightly/weekly update). QLD up +15.8% (weekly update; 37 in hospital). NSW up +13.0% (weekly update). TAS monthly reporting, next update 6 March. ACT Health ended weekly reporting for 2025; will resume in autumn/winter 2026. NT no longer publishes data. Aged care: Australian Government no longer publishes weekly COVID-19 case data.
AUSTRALIA Weekly COVID Update: 20 Feb 2026
🔹SA: ⬆️ (+36.5%) 5 deaths reported
🔹WA: ⬆️ (+34.3%) Avg 18/day in hospital
🔹VIC: ⬆️ (+29.0%)
🔹QLD: ⬆️ (+15.8%) 37 in hospital
🔹NSW: ⬆️ (+13.0%)
🔸TAS: Next update: 6 Mar
🔹Aged Care: The Australian government ended weekly COVID-19 reporting.
Device tops out at 5000ppm
Who knows what it really was
Wow, that's wild. I had no idea this kind of bus had such poor ventilation. Makes me wonder how being in an elevatot compares?
22.02.2026 00:47 — 👍 3 🔁 1 💬 1 📌 0
Avoid travelling in touring coaches to avoid airborne disease
#COVIDisNotOver #COVIDisAirborne

AirSpot now stocks AMD Earloop Masks and AMD Headband Respirators for our Australian customers.
Don’t know what you want or if they will fit? That’s ok!
Simply buy individual masks or respirators to try them out before you purchase a whole box.
airspothealth.com/collections/...

NSW Health public health alert graphic with a warning icon. Large text reads: “Measles alert for multiple locations in NSW.” Dated 13 February 2026, with NSW Government logo at the bottom.

Screenshot of an NSW Health article titled “Measles alert for multiple locations in NSW,” dated 13 February 2026. The article reports four new measles cases in NSW, outlines exposure sites across Sydney, Illawarra Shoalhaven, western NSW and the mid north coast, lists symptoms, advises monitoring for up to 18 days after exposure, and urges vaccination and testing.

Table listing measles exposure sites in NSW with columns for location and address, date and time, and “monitor for symptoms until.” Locations include pharmacies, emergency departments, clinics, petrol stations, cafés, supermarkets, bakeries, veterinary clinics, and shopping centres across Sydney, Ryde, Heathcote, Albion Park, Calderwood, Robertson, Fitzroy Falls, Toormina, Gladesville, and Coffs Harbour. Exposure dates range from 8–13 February 2026, with symptom monitoring advised until late February or early March 2026, depending on site.

Continuation of an NSW Health table listing measles exposure sites, with columns for location and address, date and time, and “monitor for symptoms until.” Locations include cafés, hospital emergency departments, pharmacies, supermarkets, a cathedral, a swim centre, airports, flights, and train lines across Bellingen, Westmead, Bathurst, Gregory Hills, Granville, Parramatta, Coffs Harbour, Sydney Airport, and Sydney rail lines. Exposure dates range from 26 January to 8 February 2026, with symptom monitoring advised until mid to late February 2026.
Measles alert for multiple locations in NSW
"NSW Health is advising people to be alert for signs and symptoms of measles after being notified of 4 new cases across the state."
Source: www.health.nsw.gov.au/news/Pages/2...
Locations: www.health.nsw.gov.au/Infectious/m...

Screenshot of a sports news article titled “Face masks and no handshakes: Olympians follow ‘corona rules’ in Milan.” Subheading explains that while the COVID-19 pandemic is said to be behind us, fear of viruses remains in sport and Olympic teams are taking measures to prevent infection. Byline reads Sports editorial team, dated February 2, 2026, 7:12 PM. Below the headline is a photo of Jenning de Boo and Femke Kok, both wearing face masks and bright orange team jackets, walking indoors with others behind them. Photo credit: © Pim Ras Photography.
The Dutch Olympic team is taking several precautions: "We're not shaking hands anymore, but we're giving fist bumps," says Verheijen. "We're wearing face masks in crowded areas and making sure we wash and disinfect our hands thoroughly." This decision was made to minimize the risk of illness.
09.02.2026 23:15 — 👍 261 🔁 73 💬 13 📌 15Have you added your CO2 Reading to our AirSpot map yet?
map.airspothealth.com
To learn more about our CO2 Map, you can find our blog post here:
airspothealth.com/a/blog/airsp...
Palace cinemas have been doing a great job of improving ventilation - starting back in 2020! Went last night and CO2 did not get about 650 ppm using my @airspotrob.bsky.social
06.02.2026 23:34 — 👍 10 🔁 1 💬 0 📌 0
Australian Winter Olympic athletes (in blue and highlighter green) wearing respirator masks as they board their bus to the Opening Ceremony.

a group of american athletes all masking in respirators at a press conference.
so many respirators on olympians faces; just because you’re not a professional athlete doesn’t mean that you n those around you don’t have something worth protecting too.
07.02.2026 04:16 — 👍 174 🔁 52 💬 2 📌 11
Screenshot of a The Conversation article showing a baby being held by an adult while coughing. Headline reads: “Whooping cough cases are at their highest level in 35 years – so why the surge?” Published February 5, 2026.
"Australia is battling its biggest rise in whooping cough cases in 35 years."
"During 2024 and 2025 Australia recorded 82,513 whooping cough cases – the highest number since monitoring began in 1991."
Source: archive.md/20eq5

South Australia: Measles circulating undetected in Adelaide after infectious case identified, SA Health says
"SA Health said the adult acquired the infection locally, with chief public health officer Nicola Spurrier describing the case as "very much a concern".
www.abc.net.au/news/2026-02...
You can find links and further details here:
airspothealth.com/a/blog/libra...
You can also locate Library locations via our map:
map.airspothealth.com
4/4

- Frankston Libraries – 2 Available + 1 on Display at Frankston Library
- Geelong Regional Libraries – All borrowed
- Glen Eira Libraries – 1 Available
- Goulburn Valley Libraries – 1 Available
- Merri-bek Libraries – All borrowed + 1 on Display at Brunswick Library
2/4

Frankston Library now has an interactive AirSpot display at 60 Playne Street, Frankston.
AirSpot Devices are also available at:
- Bayside Libraries – 1 Available
- Brimbank Libraries – All borrowed
- Dandenong Libraries – 2 Available
1/4

A new highly transmissible COVID-19 variant is spreading in Australia. Experts warn it spreads faster, may cause distinct early symptoms, and highlights the need to protect vulnerable people. By Carla Mascarenhas — February 4, 2026.
The new 'highly transmissible' COVID-19 variant: what Aussies need to know
NB.1.8.1, an Omicron sub-lineage, is now widespread across Australia. It is highly transmissible, spreads faster than earlier Omicron variants, has a shorter incubation period, and causes a sharp, stabbing sore throat early.
Looking for a particular location on map.airspothealth.com?
If for example you want to find the retail settings with CO2 under 800ppm, it is easy to filter and find locations near you.
To learn more about our CO2 Map, go to the AirSpot Map heading at airspothealth.com
“…terms like “coronavirus” and “COVID‑19” were added to keyword blocklists by advertisers and platforms, which caused publishers reporting on the pandemic to lose revenue or see their content filtered out of programmatic ad placements….certain public health‑oriented stories lost visibility.”
01.02.2026 13:45 — 👍 131 🔁 52 💬 4 📌 9We did not use the term 'mass poverty' when trying to generate this Ai image
Yet I would be interested now to see what Ai comes up with when we ask it for an image of people on a bus whose breath others would not want to breathe
I'll let you know
Yet please feel free to help
I'm very happy for you to provide alternative video footage
Please do - we are simply trying our best to get a message across about the poor air quality on buses in Sydney which after 6 years has still not been addressed
If you are able to provide something then we are happy to receive it
Thanks
Can you help improve it?
31.01.2026 09:35 — 👍 0 🔁 0 💬 0 📌 0Can confirm.
Yes, 3000ppm CO2 is common on Transport for NSW buses, even off peak.
It's absolutely vile, incredibly dangerous, and in criminal breach of duties under the WH&S Act (NSW) 2011.
Almost like they're designed to maim and kill.
Never go near them without a fitted respirator.
Volume on
What's the air quality like on the buses where you live?
#SaferAir #COVIDisAirborne
Have you added to our CO2 Map yet?
map.airspothealth.com
You don’t have to have an AirSpot to contribute!
For those that want to get involved and don’t have a CO2 monitor, you can get 25% off your AirSpot order here:
airspothealth.com/discount/Air...
(Limit of 50 orders)