I'm excited to share a new version of the Air formatter for #rstats, with support for tabular formatting! Super useful with `tibble::tribble()` calls or `data.table::fcase()`.
It's currently experimental as we're looking to get feedback on the feature, so please let us know what you think.
21.10.2025 10:34 — 👍 138 🔁 31 💬 7 📌 2


🌍Exploring Sentinel-2 with the Copernicus Data Space Ecosystem (CDSE)?
Hugh Graham’s guide with vrtility in #rstats. Includes authentication & query of imagery and building cloud-free composites.
permian-global-research.github.io/vrtility/art...
#RSpatial #RemoteSensing #EarthObservation #GIS
24.09.2025 13:03 — 👍 11 🔁 5 💬 0 📌 0

Processing large rasters using terra package for R: combining tiling and time-series modeling
Processing large rasters using terra package for R: combining tiling and time-series modeling
Had a privilege and pleasure to teach terra pkg (created by @roberthijmans.bsky.social et al.) and spatial sampling with R together with Alexandre Wadoux at the #EOSummerSchool2025 at WICC. You can follow the terra tutorial from here: differ.blog/p/processing...
📹: youtu.be/q9sQkg7BeAc?...
15.09.2025 20:53 — 👍 20 🔁 13 💬 0 📌 0
tinyplot –
I had a blast at #useR2025.
Here are my slides on `tinyplot`. grantmcdermott.com/tinyplot/vig...
(Rendering of the title slide is a bit off on mobile. I'll fix when when I get sec.)
10.08.2025 17:39 — 👍 54 🔁 10 💬 4 📌 0
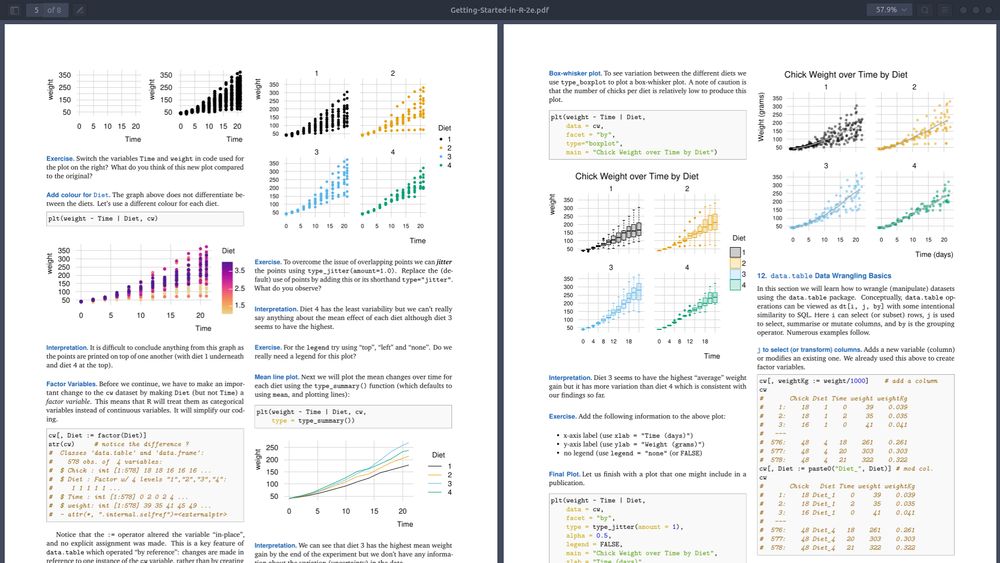
Screenshot of the top parts of pages 5 and 6 of 'Getting Started in R - Tinyverse Edition' at https://github.com/eddelbuettel/gsir-te/
The "Getting Started in R - Tinyverse Edition" eight-page pdf guide now has a 2nd edition using, appropriately, `tinyplot` as the plotting package.
See github.com/eddelbuettel... for more.
#rstats
20.04.2025 19:23 — 👍 107 🔁 24 💬 3 📌 1
Check out Positron’s Plots Pane!
Preview, resize, copy, and save your #Python and #RStats plots directly in your IDE. Never guess what your exported plot will look like ever again 🤩
Learn more about Positron’s layout: positron.posit.co/layout.html#... #Positron
06.08.2025 12:44 — 👍 27 🔁 3 💬 0 📌 0
Polars R Package
#rstats polars 1.0.0 is now available!
polars provides bindings to the eponymous Rust library, a very efficient dataframe library.
This is the outcome of a 1-year long rewrite led by @eitsupi to refactor the internals and match the API of Python polars.
pola-rs.github.io/r-polars/
Details ⬇️
23.07.2025 06:01 — 👍 35 🔁 11 💬 4 📌 1
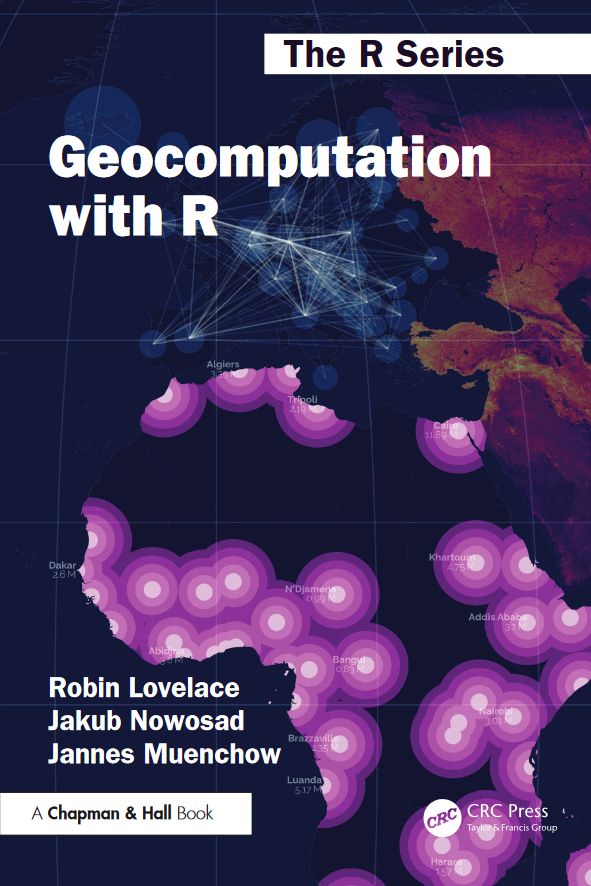
The book cover
Have you read Geocomputation with R?📘
If you found it helpful, we’d really appreciate a quick review — it helps others find the book too!
Goodreads: www.goodreads.com/book/show/21...
Amazon: www.amazon.com/dp/1032248882
Book: r.geocompx.org
#rstats #gis #geocompx #rspatial
23.07.2025 16:03 — 👍 14 🔁 7 💬 1 📌 1
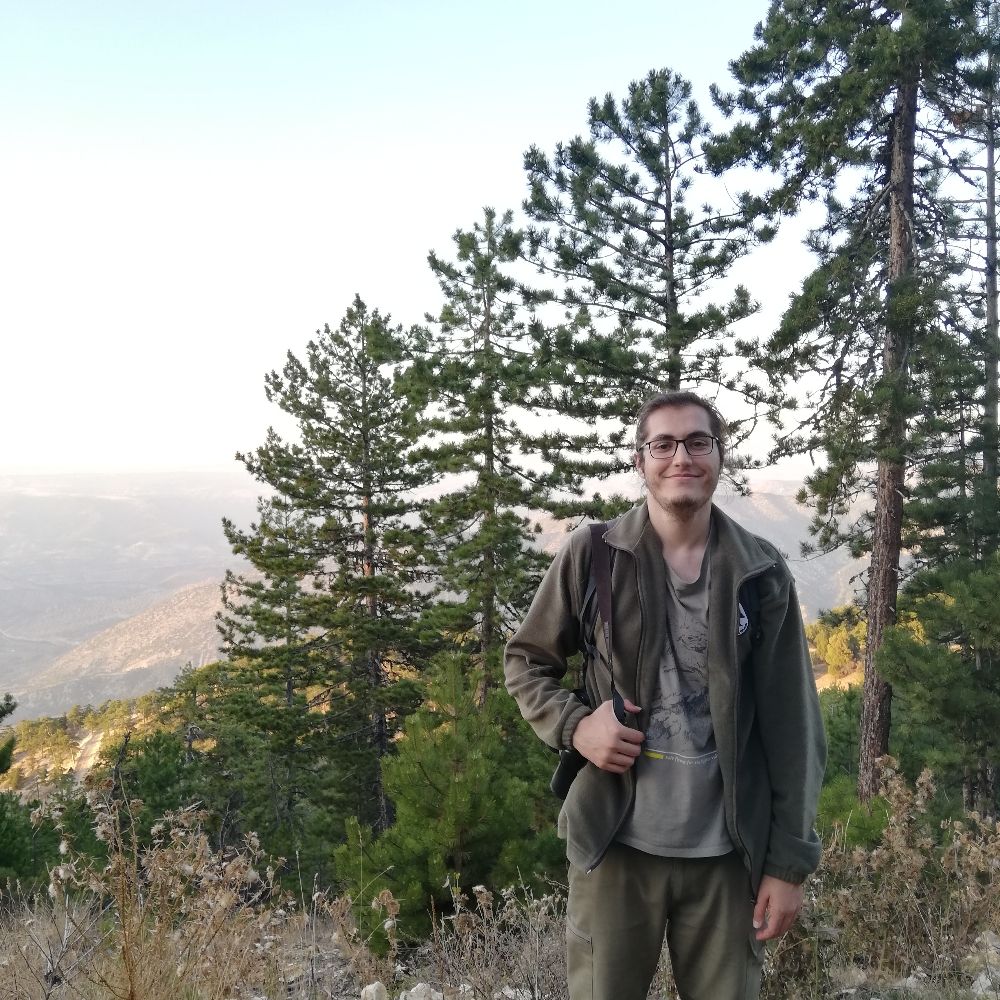
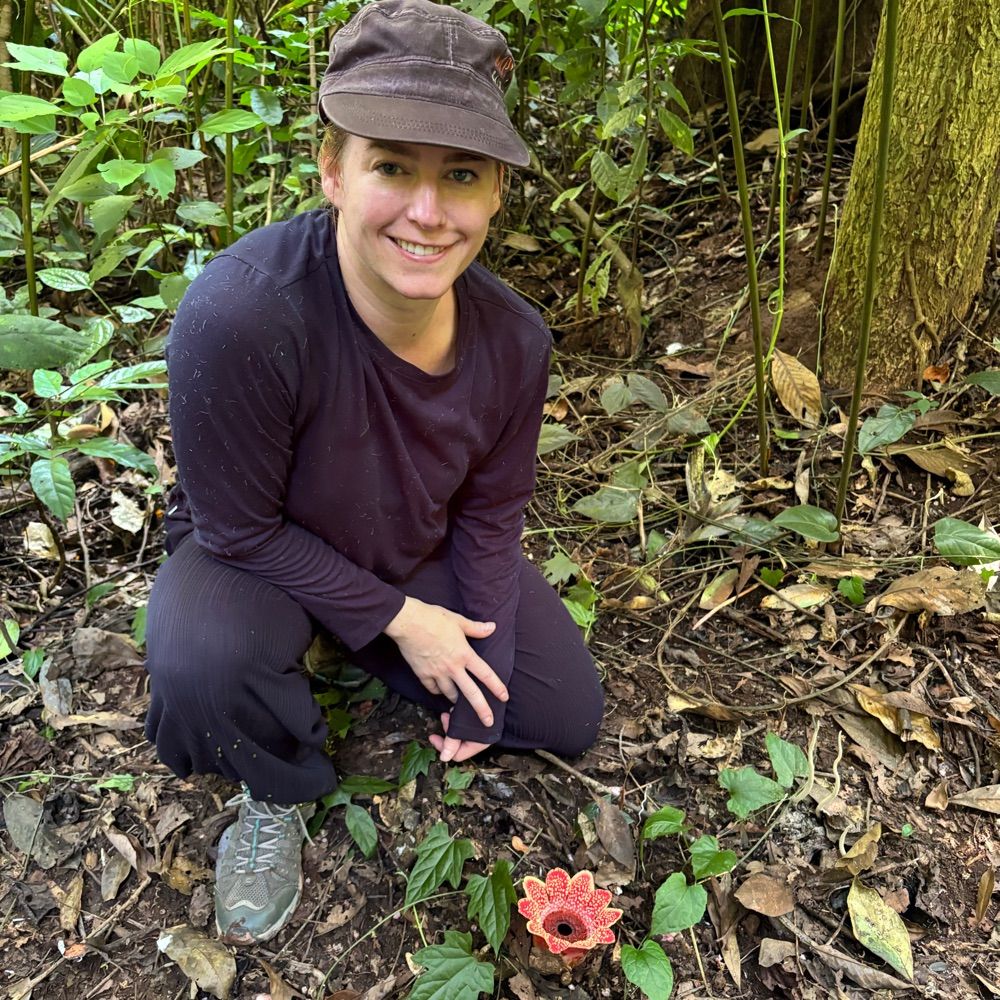
This award means a lot to me, and I’m truly grateful to my advisors, @ctavsanoglu.bsky.social and @fire-ecologist.bsky.social, for their invaluable guidance and support throughout this journey.
11.07.2025 19:42 — 👍 1 🔁 0 💬 0 📌 0
"Aspen (Populus tremuloides) slows fire progression: as aspen cover on the landscape increased, daily area burned and linear spread rate decreased." Harris et al. #EcolAppl @esajournals.bsky.social 🧪🌍🔥🌳🪴
#Flammability matters!
esajournals.onlinelibrary.wiley.com/doi/10.1002/...
09.07.2025 20:20 — 👍 31 🔁 10 💬 1 📌 0

Multimodel Approaches Are Not the Best Way to Understand Multifactorial Systems
Information-theoretic (IT) and multi-model averaging (MMA) statistical approaches are widely used but suboptimal tools for pursuing a multifactorial approach (also known as the method of multiple work...
I like this paper too, but (horn-tooting alert) alternatively, consider not doing model selection at all? doi.org/10.3390/e260... (FWIW I do feel a bit bad about publishing in an MDPI special issue [!!] - long story, I agreed to do it and then felt uncomfortable backing out - wouldn't do it again)
26.01.2025 18:58 — 👍 25 🔁 5 💬 4 📌 3
Original post on fosstodon.org
New post: https://jcarroll.com.au/2025/06/29/counting-digits-quickly/
What if you could just wave a magic wand over your R #rstast :rstats: code and have it transform into something that ran as fast as or faster than C? @t_kalinowski's {quickr} 'R to Fortran Transpiler' does that for you! […]
29.06.2025 02:00 — 👍 12 🔁 7 💬 0 📌 0
Functional Programming Tools
A complete and consistent functional programming toolkit for R.
Bleeding edge update for the #tidyverse purrr package with even more seamless #rstats parallel maps.
Introducing our shiniest new adverb: `in_parallel()`. Just wrap your function to take advantage of blazing fast parallel processing via mirai.
pak::pak("tidyverse/purrr")
purrr.tidyverse.org/dev/
13.06.2025 15:32 — 👍 103 🔁 32 💬 6 📌 1
A screenshot from the blog post
A screenshot from the blog post
A screenshot from the blog post
A screenshot from the blog post
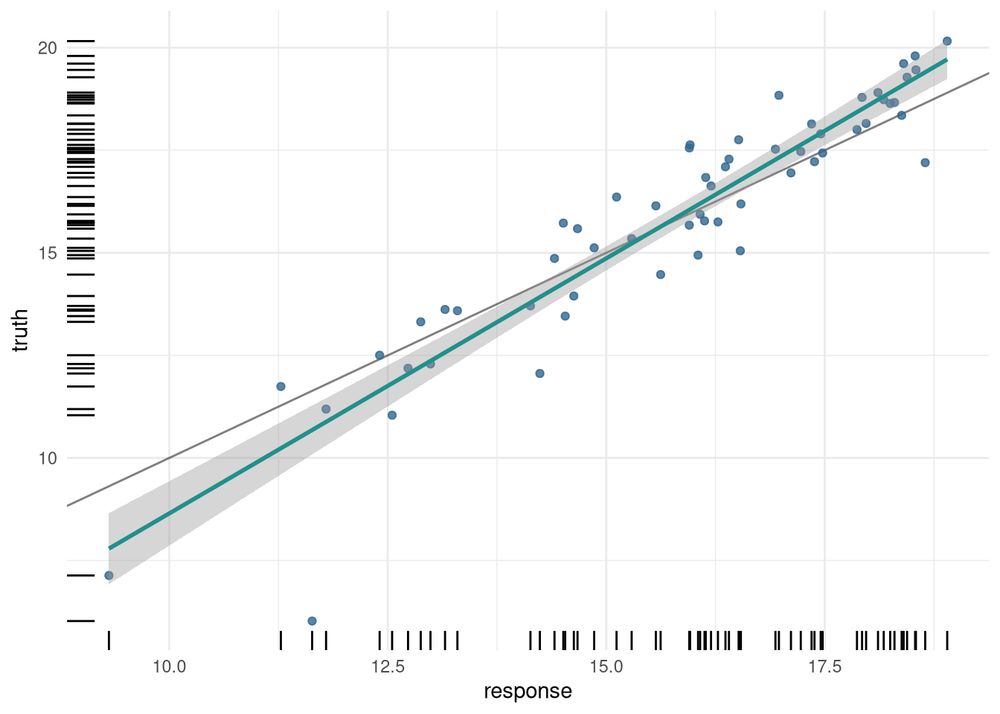
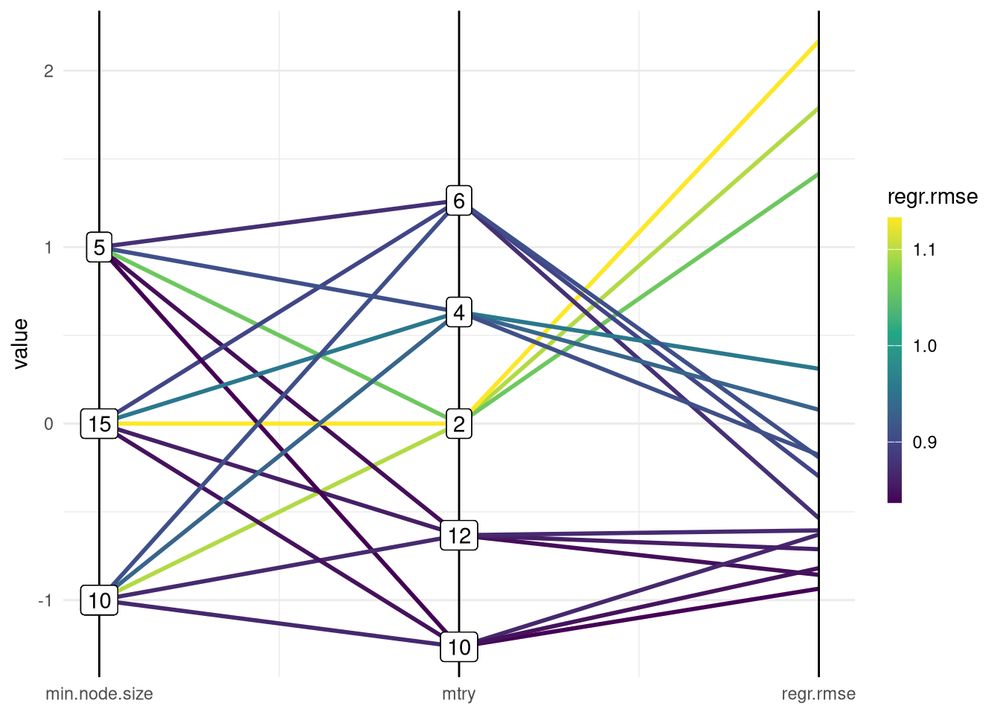
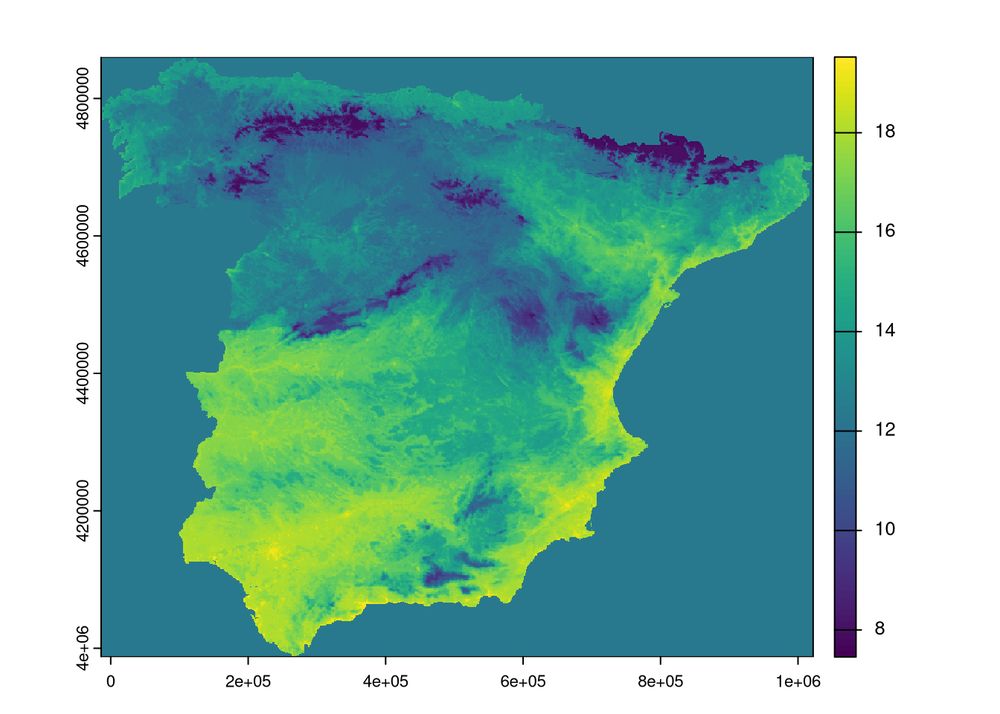
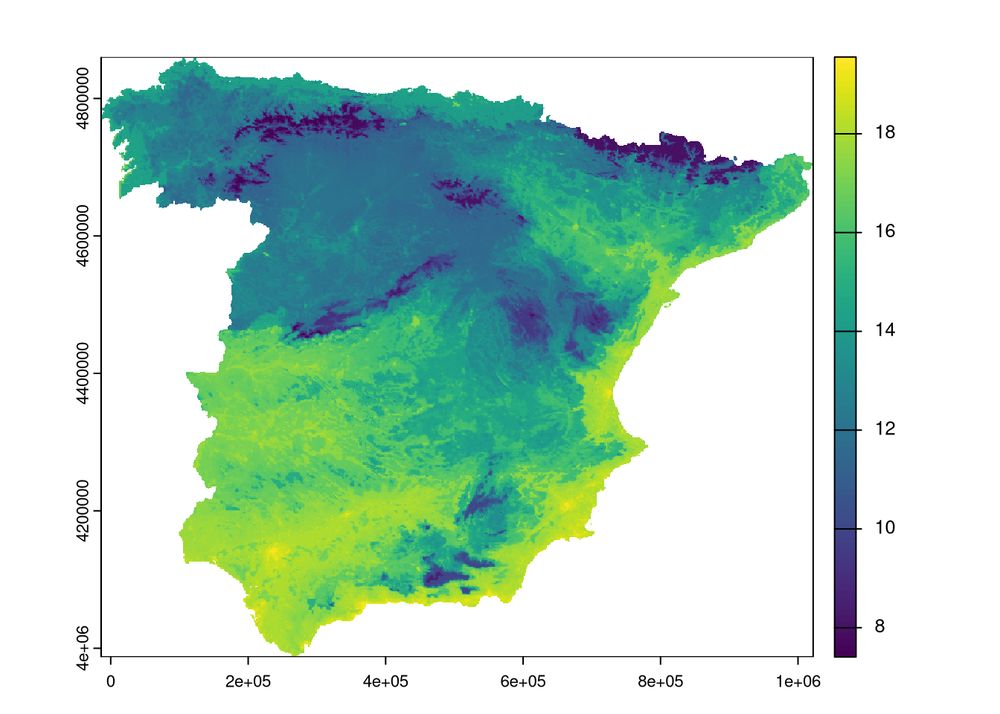
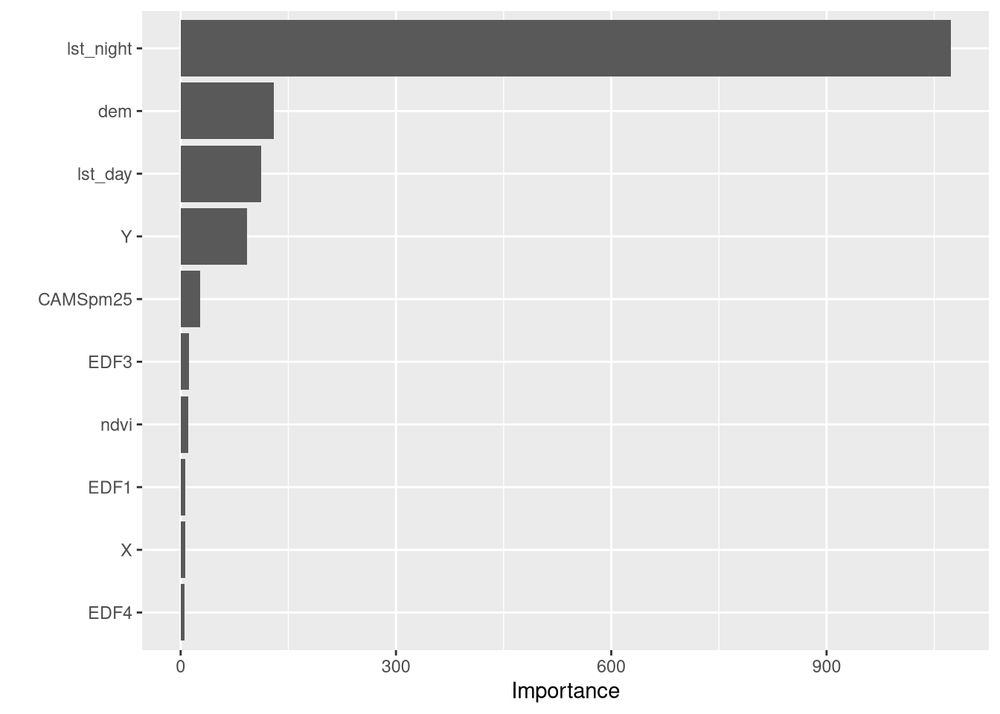
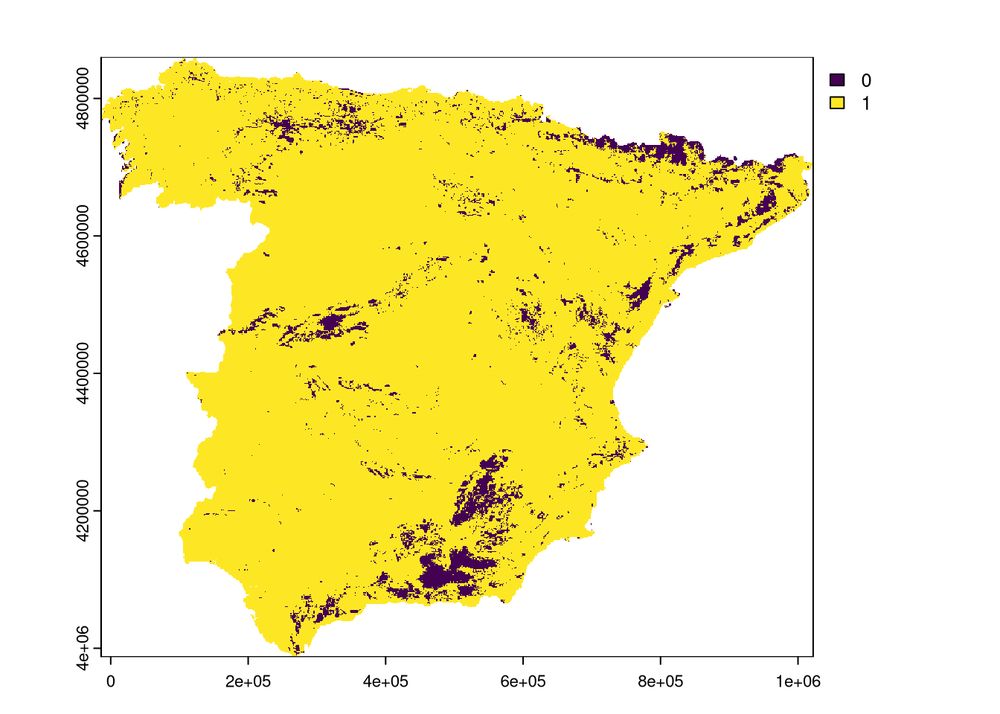
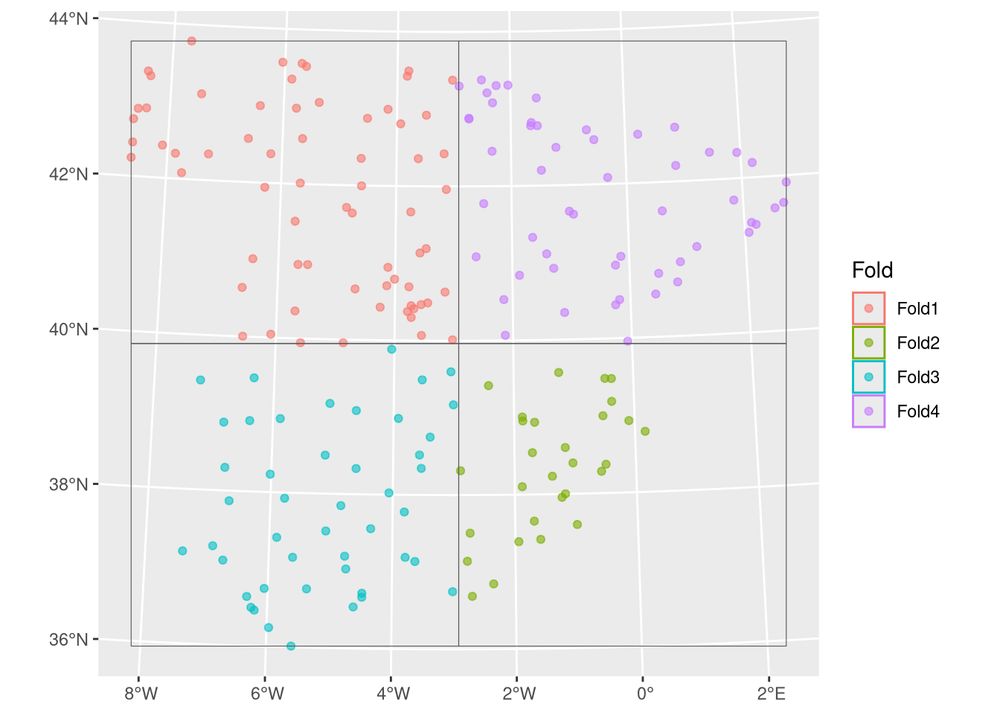
New blog post: Spatial Machine Learning with tidymodels 🌍🧠📦
This post shows how to apply the tidymodels framework to spatial data workflows in R. Part 3 in a series about #sml.
🔗 geocompx.org/post/2025/sm...
#rstats #rspatial #tidymodels #gischat
28.05.2025 14:04 — 👍 44 🔁 16 💬 3 📌 0
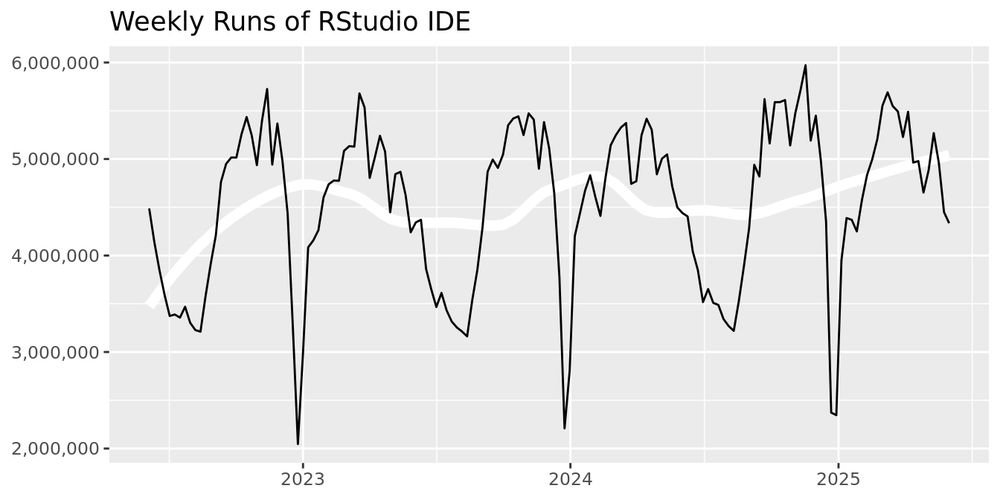
Line chart titled ‘Weekly Runs of RStudio IDE’ showing usage data from 2023 to 2025. The y-axis ranges from 2,000,000 to 6,000,000 weekly runs. The chart displays a cyclical pattern with regular peaks around 5,000,000-6,000,000 runs and dramatic drops to approximately 2,000,000 runs that occur periodically during holiday periods.
Is #rstats dead? I don’t think so.
10.06.2025 18:36 — 👍 182 🔁 30 💬 17 📌 10
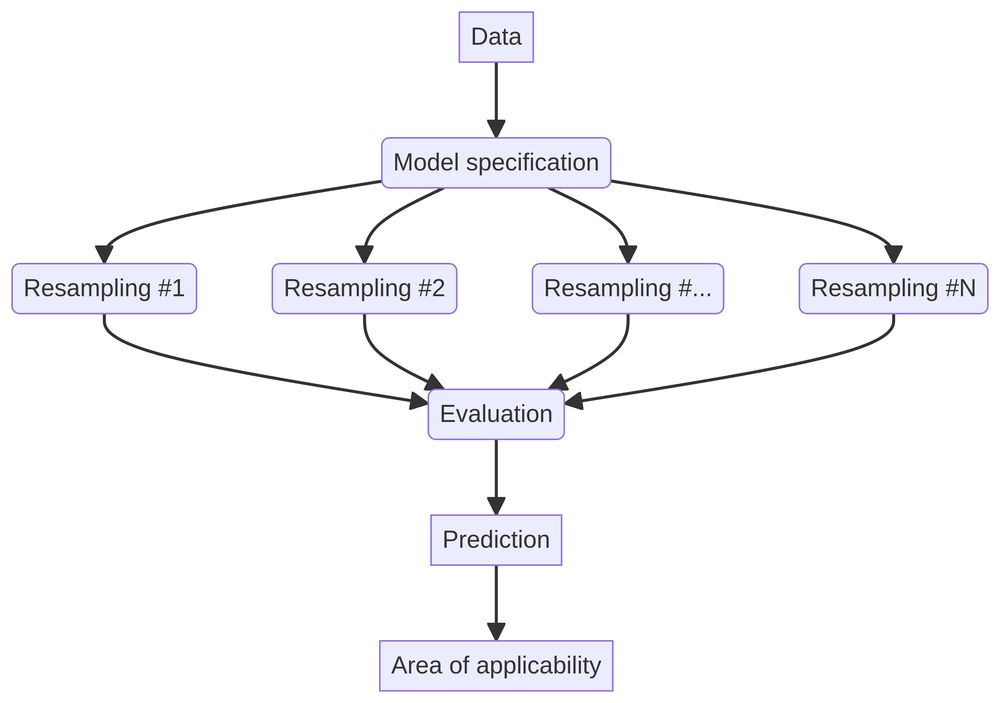
A possible workflow of the spatial machine learning task.
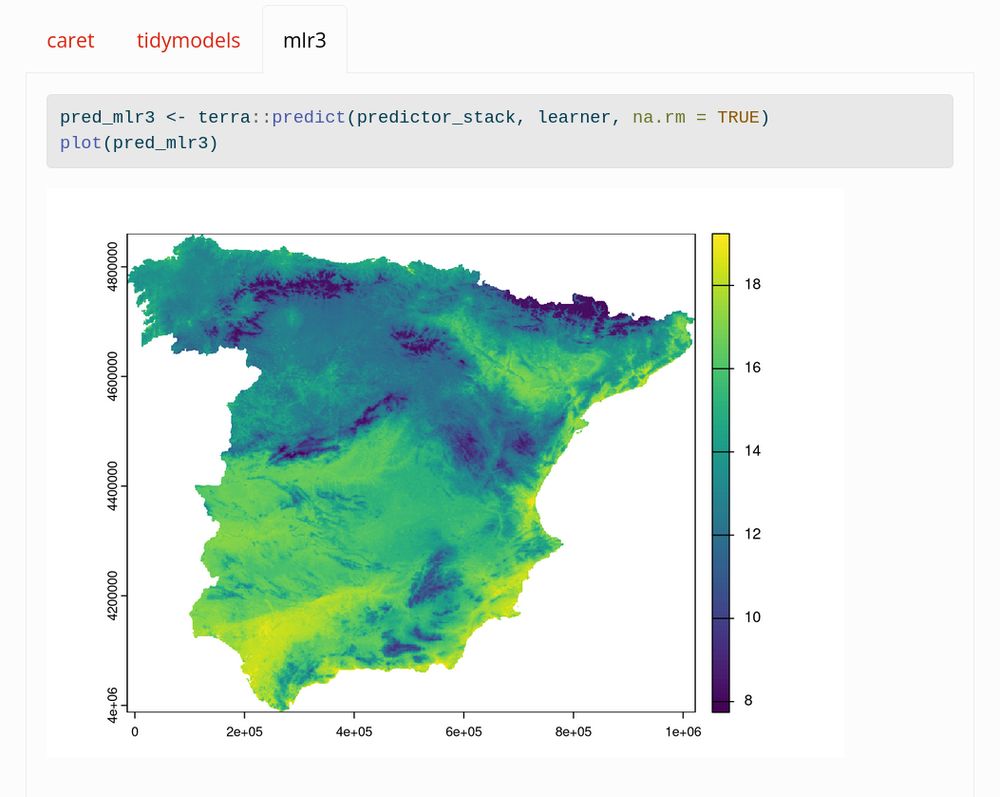
A screenshot of a part of the blog post
🔍 Interested in spatial machine learning with R?🌍
We compare caret, tidymodels, and mlr3 for spatial tasks — and show how their workflows differ.
Read it here: geocompx.org/post/2025/sm...
#MachineLearning #SpatialAnalysis #RStats #rspatial
30.04.2025 14:03 — 👍 34 🔁 11 💬 1 📌 0

Temporal trends of open-access publications (open publication), open data, and code sharing (open code) between 2010 and 2022. Sample size was 77 papers per year, 1001 total. The lines show trends in each open-science component over time, with dashed lines representing non-significant trends, and solid lines indicating significance. Open data (p = 1.48e-06) and code sharing (p = .00157) increased significantly over time, while open-access publications (p = .926) had no statistically significant relationship.
Actual code sharing remains terribly low in ecology (source: doi.org/10.1002/ece3...)
21.01.2025 08:44 — 👍 8 🔁 3 💬 0 📌 2
What advice do folks have for organising projects that will be deployed to production? How do you organise your directories? What do you do if you're deploying multiple "things" (e.g. an app and an api) from the same project?
27.02.2025 14:15 — 👍 101 🔁 29 💬 26 📌 4

Thank you to everyone who has already supported our work on open-source spatial analysis resources like Geocomputation with R/Python! 🙏🌍
If you’ve found our books helpful, consider supporting future updates and free resources: buff.ly/3OMFPUU
#rstats #rspatial #geopython #geocompx
02.03.2025 15:01 — 👍 20 🔁 6 💬 0 📌 0

Wildfires have always been a natural part of ecosystems, even before human activities made them more frequent and severe. Lightning-driven fire regimes are a prime example, as seen here in Marmaris, southwestern Türkiye—the region with the highest occurrence of lightning-induced fires in the country
18.12.2024 19:31 — 👍 2 🔁 3 💬 1 📌 0

Air, an extremely fast R formatter
We are thrilled to announce Air, a new R formatter.
@lionelhenry.bsky.social and I are so excited to finally announce Air - an extremely fast R code formatter! 🎉
With Air, you'll never need to worry about styling your #rstats code ever again. All you need to do is save, and Air takes care of the rest.
www.tidyverse.org/blog/2025/02...
21.02.2025 15:10 — 👍 363 🔁 121 💬 20 📌 20

A screenshot from the website

A screenshot from the website

A screenshot from the website

A screenshot from the website
Aditya Dahiya is documenting his journey through Geocomputation with R with detailed summaries, tables, and maps—often adding fresh insights along the way. 🌍📚
Highly recommended!
Explore his work here: https://buff.ly/42rnAg4
#geocompx #rspatial #gischat
16.02.2025 15:01 — 👍 26 🔁 7 💬 1 📌 0
Bioconductor: Free, open-source software for rigorous, reproducible biological data analysis with R. Join our diverse community of developers and data scientists.
https://bioconductor.org/
I work at CNRS. I post about reproducible research and all things spatial.
Author of {mapsf}, {osrm} and other :rstats: spatial packages. Co-author of the […]
[bridged from https://fosstodon.org/@rcarto on the fediverse by https://fed.brid.gy/ ]
Husband, father, granddaddy; Christian; Math Prof.em. ETH; R Core member;
Yale SOM professor & Bulls fan. I study consumer finance, and econometrics is a big part of my research identity. He/him/his
Ass prof in econ at the University of Bordeaux
Too much code.
https://sites.google.com/site/laurentrberge/
Vegetation ecologist. Traits, diversity, numerical methods, cloud forest. Assoc prof in Vegetation Ecology Lab, NTU, Taiwan. Opinions my. (He/him) 🏳️🌈
Senior Scientist at Naturalis Biodiversity Center NL; macroevolution ☄️, macroecology 🌎, botany 🌺, palms 🌴, megafauna 🐘, frugivory 🦧, traits ☘️
Open source geo developer (especially QGIS!)
paleontology, evolution, human evolution, archaeology, anthropology, politics. lives in Finland.. works in the Old World...and yes, I am Ross from Friends 😊
Visualisation and graphics @posit.co
Classic Generative Art Weirdo using 🖤 and R: http://thomaslinpedersen.art and http://deca.art/thomasp85
he/him
Biostatistician @IDEXX formerly at harvardmed, @BIDMChealth, @nasa. Big data, clinical trials, and medical diagnostics. Mainer. Opinions are my own. he/him
Husband | Father | Manager Advanced Analytics | PhD | Research Scientist | Meditator | he/him | #rstats #rdatatable #openscience 🏳️🌈 🧗♂️
tysonbarrett.com
Professor of Anthropology at Washington State University. Faculty page: https://anthro.vancouver.wsu.edu/people/hagen/
Views expressed are my own and do not reflect those of my employer or other organizations I'm affiliated with.
Biostatistician. Baritone. He/Him.
Product of more than one country.
May contain nuts.
#rstats #python #rdatatable #econsky #duckdb #webscraping #football #እንጀራ
-Mapping the world- Dr. in Physical Geography | Environmental Health - bioclimatology - geography. RC Researcher from 🇩🇪 at @mbgcsic.bsky.social @csic.es in 🇪🇸 #rstats #dataviz
Secretary of the @aeclim.org
📍Galicia
ℹ️ https://dominicroye.github.io
Computational ecologist modelling biocrusts, water and plants. Scientific programmer, R and good scientific practice teacher @FU Berlin
☕️ 📊 🐶 🔸 Protect Trans Kids 🔸 Black Lives Matter
Principal Architect @posit.co, GP Composed Ventures, Co-founder Voltron Data. Open source: Apache Arrow, pandas, Ibis. "Python for Data Analysis" book