 07.08.2025 17:17 — 👍 4 🔁 2 💬 2 📌 0
Can Bluesky say every word in the dictionary?
I dunno but I plan to find out!
I made a website that tracks every single word said on bluesky (as of yesterday).
06.08.2025 15:51 — 👍 584 🔁 132 💬 66 📌 68
My mind is blown 🤯
01.08.2025 15:37 — 👍 5 🔁 2 💬 1 📌 0
Looks fun!
31.07.2025 19:04 — 👍 0 🔁 0 💬 0 📌 0
As the battle for Mecatol Rex rages, change comes to the Galaxy.
Twilight Imperium: Thunder’s Edge is a new expansion to everyone’s favorite galactic conquest and diplomacy board game Twilight Imperium Fourth Edition.
Learn more: www.fantasyflightgames.com/en/news/2025...
31.07.2025 15:12 — 👍 10 🔁 3 💬 1 📌 4
I am being 100% serious when I say a social network being first to break baseball trade stories is a great proxy for its general utility for following the news
31.07.2025 17:56 — 👍 1 🔁 0 💬 0 📌 0
Yeah this a11y setting might be a good start: developer.mozilla.org/en-US/docs/W...
31.07.2025 00:50 — 👍 4 🔁 0 💬 0 📌 0
YouTube video by John Mongani
Harry Caray's call of the Sandberg game vs Cards 1984
One of the greatest baseball players of all time, probably the greatest Chicago Cubs player next to Ernie Banks. His legendary performance against the Cardinals in 1984 will never be forgotten. RIP Ryne Sandberg.
youtu.be/34mz7wQKTB0?...
29.07.2025 01:39 — 👍 9 🔁 2 💬 2 📌 0
i’m gonna — use more — em dashes — so many em — dashes — that not even — an AI could — be assumed — to be the writer — of my posts — this is — how we assert — our — humanity
29.07.2025 14:30 — 👍 31 🔁 2 💬 2 📌 1
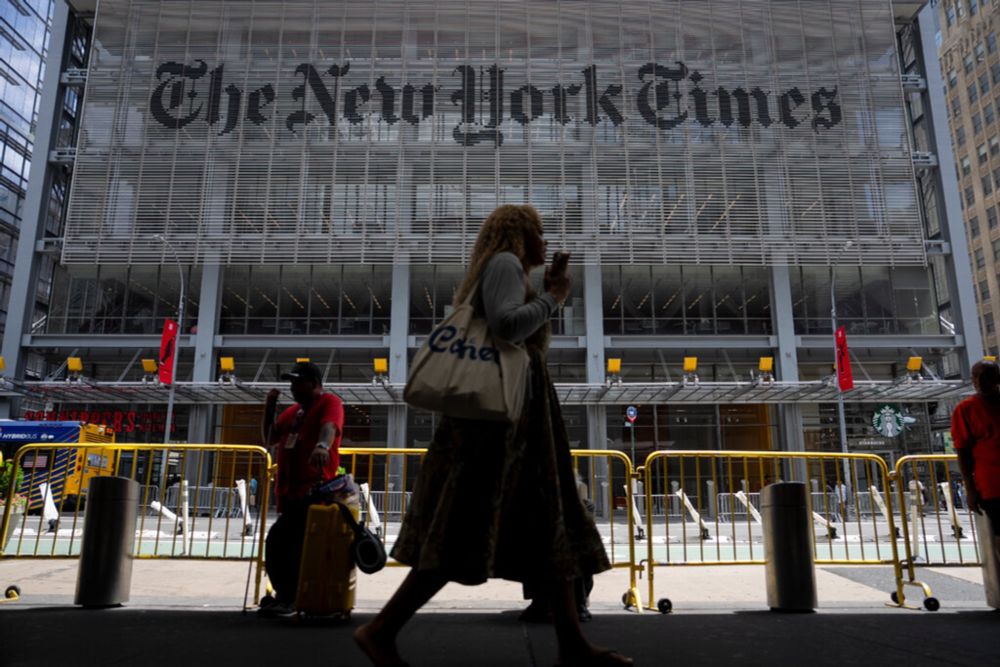
Project Veritas Withdraws Lawsuit Against The New York Times
This is the end of a defamation lawsuit that Project Veritas filed against Stanford Internet Observatory, UW, and the NYT back in 2021.
It lost its case against SIO in 2022, and was ordered to pay $150k in legal fees.
They sue to tie organizations up for years.
www.nytimes.com/2025/07/25/b...
29.07.2025 15:17 — 👍 342 🔁 95 💬 12 📌 2
Working with @lit.dev and finding it a great fit for academic projects.
The components are self-contained WebComponents you can drop anywhere. They rely on web standards, so unlikely to break over time and perfect for research code you build once and don't touch for years.
29.07.2025 15:16 — 👍 26 🔁 5 💬 0 📌 0
Adding "All ATProto traffic needs to go through one central node that controls everything" to the list of Mastodon myths that I'll need to mention in a blog post…
26.07.2025 19:13 — 👍 51 🔁 1 💬 5 📌 0
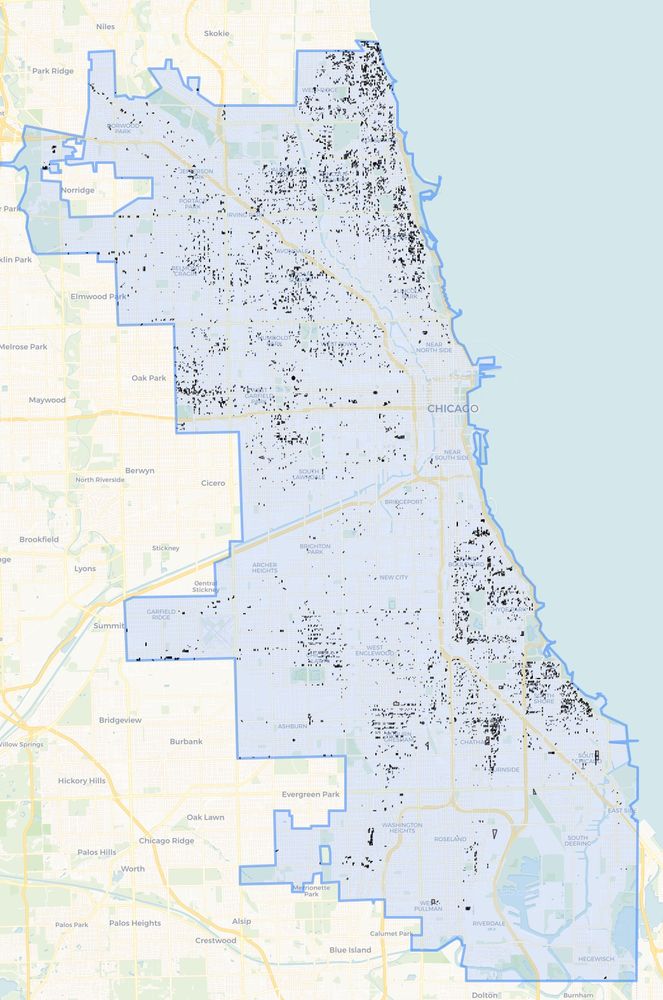
map of Chicago boundary showing small black dots, each one representing a courtyard building
there are 7,681 dots
map of the courtyard buildings in Chicago (this includes buildings with all kinds of courts, not just the obvious ones in the front like the OP above)
24.07.2025 05:58 — 👍 42 🔁 8 💬 7 📌 4

This is evil
23.07.2025 23:25 — 👍 1224 🔁 509 💬 60 📌 42

Want $50 to create your own feed with natural language?
We’re a group of researchers at Princeton studying how people could more easily build their own feeds.
Join our study to try it out and tell us what you think of the experience!
👉 Sign up at forms.gle/MkSGKzxDfBEc... (takes less than 1 min)
22.07.2025 13:57 — 👍 1 🔁 3 💬 0 📌 1
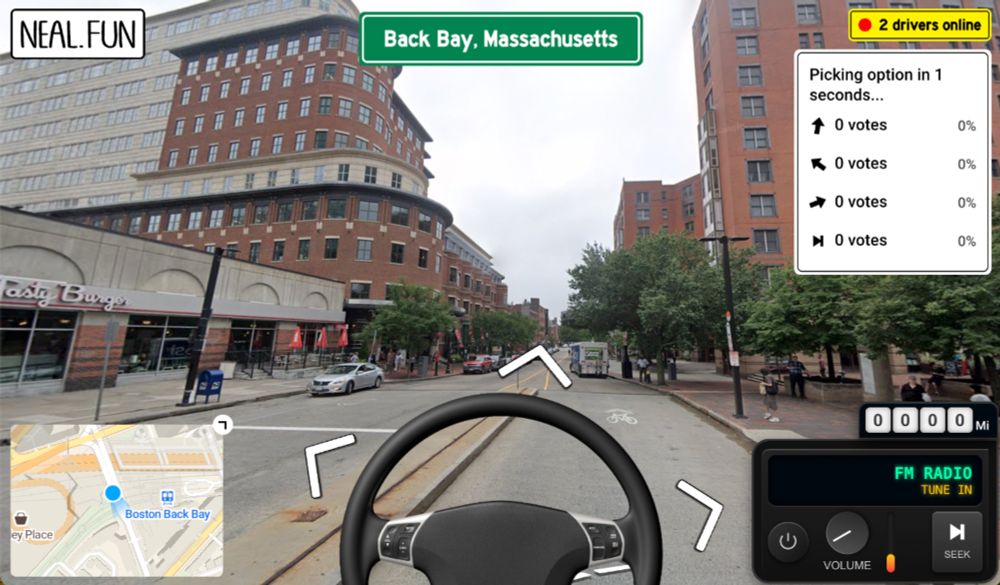
Internet Roadtrip
Let's take a streetview roadtrip
The Internet Roadtrip is now trying to cross Labrador. A 100-foot gap in Street View coverage almost forced them to turn back, but as they approached the break, someone got a friend in Labrador City to drive to the spot IRL and take and upload a panoramic photo to fix it. neal.fun/internet-roa...
22.07.2025 23:08 — 👍 2369 🔁 295 💬 18 📌 14
ty for not losing yesterday
23.07.2025 14:36 — 👍 1 🔁 0 💬 0 📌 0
Had an idea to do this back when LLMs were taking off. I’m noticing a lot of people using personal management systems using AI to write content for them and I’m not a fan of that use because it goes against the point of my system, but this sounds different.
22.07.2025 21:17 — 👍 1 🔁 0 💬 1 📌 0
![Original map made by John Snow in 1854. Cholera cases are highlighted in black, showing the clusters of cholera cases (indicated by stacked rectangles) in the London epidemic of 1854. The map was created in order to better understand the pattern of cholera spread in the 1854 Broad Street cholera outbreak, which Snow would use as an example of how cholera spread via the fecal-oral route through water systems as opposed to the miasma theory of disease spread. The contaminated pump is located at the intersection of Broad Street and Cambridge Street (now Lexington Street), running into Little Windmill Street. The map marks an important part of the development of epidemiology as a field, and of disease mapping as a whole. [text from Wikipedia]](https://cdn.bsky.app/img/feed_thumbnail/plain/did:plc:nr7smu7dghnm4qfe2nmlwu5d/bafkreig33eu6p4m2o2t4j5745bucrofa75wpckxlt45rc2jgvb2v3hktjy@jpeg)
Original map made by John Snow in 1854. Cholera cases are highlighted in black, showing the clusters of cholera cases (indicated by stacked rectangles) in the London epidemic of 1854. The map was created in order to better understand the pattern of cholera spread in the 1854 Broad Street cholera outbreak, which Snow would use as an example of how cholera spread via the fecal-oral route through water systems as opposed to the miasma theory of disease spread. The contaminated pump is located at the intersection of Broad Street and Cambridge Street (now Lexington Street), running into Little Windmill Street. The map marks an important part of the development of epidemiology as a field, and of disease mapping as a whole. [text from Wikipedia]
John Snow's Cholera Map
21.07.2025 23:40 — 👍 13 🔁 1 💬 1 📌 0
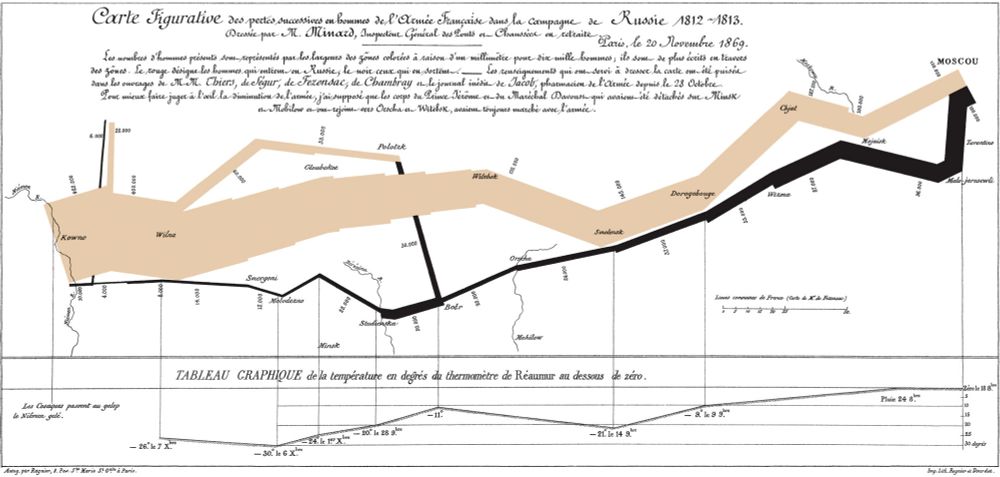
Charles Minard's 1869 chart showing the number of men in Napoleon’s 1812 Russian campaign army, their movements, as well as the temperature they encountered on the return path.
Charles Joseph Minard's map of Napoleon's Russian campaign
21.07.2025 23:39 — 👍 10 🔁 1 💬 2 📌 0

Warming stripes by Ed Hawkins
Source: https://en.wikipedia.org/wiki/Warming_stripes?wprov=sfti1#
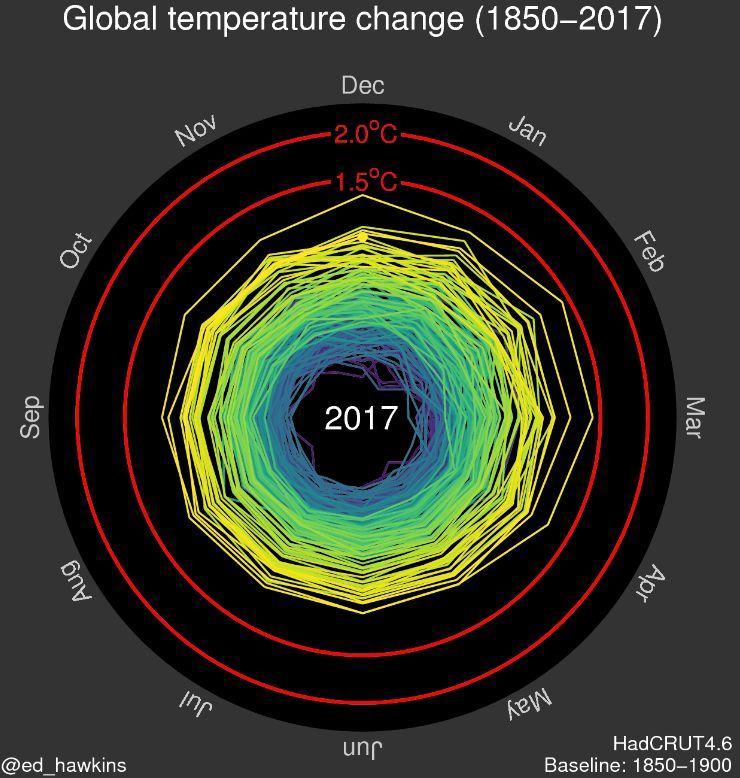
Climate spiral by Ed Hawkins
Source: https://en.wikipedia.org/wiki/Climate_spiral?wprov=sfti1#Critical_response
Hey #rstats, #pydata, #julialang & #dataviz folks! 😊
What are some iconic data visualizations, similar to @edhawkins.org‘s warming strips & climate spiral?
21.07.2025 23:21 — 👍 58 🔁 23 💬 15 📌 2

carlcolglazier.com/documents/cv.qmd at master · CarlColglazier/carlcolglazier.com
My personal home on the information superhighway. Built with Quarto. - CarlColglazier/carlcolglazier.com
I made the CV on my website using typst/quarto.
It reuses the same YAML markdown I used to build the "/research" page. :)
At some point, I will probably update it to do everything else in YAML too.
github.com/CarlColglazi...
21.07.2025 22:37 — 👍 7 🔁 1 💬 1 📌 0
The forbidden desire to add a pipe operator to Python
16.07.2025 17:22 — 👍 1 🔁 0 💬 0 📌 0
DevOps is pretty close to being that guy who likes to fiddle with arch as a career.
14.07.2025 23:36 — 👍 23 🔁 4 💬 4 📌 1
YouTube video by BigBenjiBlue
Smithers: What's wrong with this country?
Note: the screenshot shows fake data.
I have not, in fact, received 11 job offers.
14.07.2025 15:14 — 👍 2 🔁 0 💬 0 📌 0
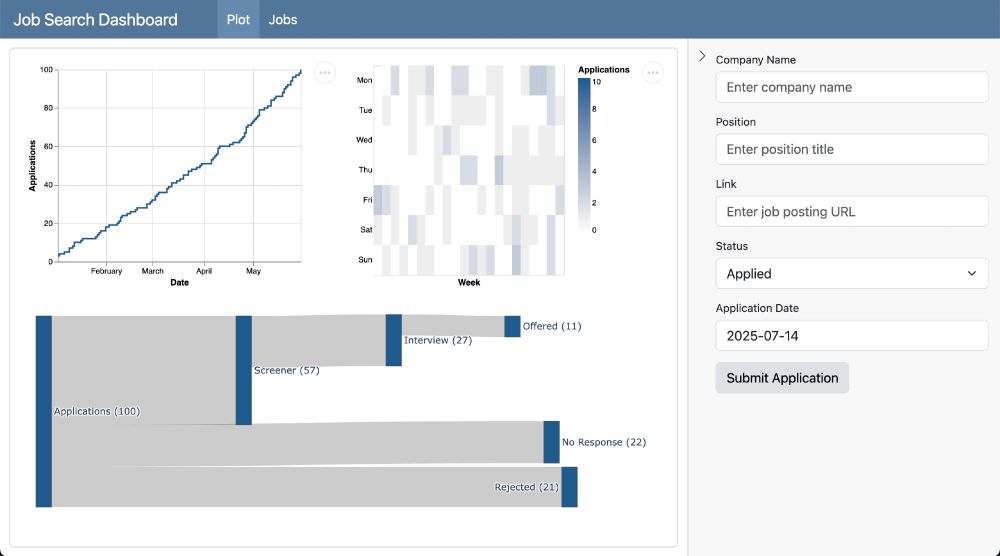
Dashboard titled “Job Search Dashboard” displays three charts on the left and an application form on the right.
Top-left chart: step line plot with Date (January–May) on the x-axis, Applications (0–100) on the y-axis, cumulative count reaching 100 by mid-May.
Top-center chart: heatmap with weekdays (Mon–Sun) on the y-axis, weekly intervals on the x-axis, color legend “Applications” ranging from 0 (white) to 10 (dark blue).
Bottom-left chart: Sankey diagram with a source node “Applications (100)” flowing to “Screener (57)”, “Interview (27)”, “Offered (11)”, “No Response (22)”, and “Rejected (21)”.
Right panel: text inputs for Company Name, Position, Link; a Status dropdown set to “Applied”; an Application Date field showing “2025-07-14”; and a “Submit Application” button.
Made a little dashboard in #Quarto and #Shiny to track my job application process.
github.com/CarlColglazi...
14.07.2025 15:13 — 👍 4 🔁 1 💬 1 📌 0

An empty city lot between two buildings

The grimy outline of a home can be seen on a large, windowless brick wall
The two-flat that stood here was demolished a few months ago (fire damage) but its ghostly outline remains on the apartment building next door. They likely shared a wall for a century.
13.07.2025 17:53 — 👍 24 🔁 3 💬 0 📌 0
Pick a DAW that speaks to you. They all can do pretty similar things, but have different workflows.
You may want certain tools or plugins to help.
Based on what I know about you, I think you might vibe with Logic Pro, but try a few trials out and see for yourself.
13.07.2025 17:49 — 👍 2 🔁 0 💬 0 📌 0
![A flier taped to a streetlight pole that reads:
“I also have access to a printer,
And I say
Upzoning is cool and good and it is my friend
Let ‘em build some housing! What're you worried about, people with jobs and homes using the Red Line?
Atraid of density? then why did you move to the big city my good friend [emoji making a ‘this guy’s nuts!’ gesture]
‘But I wanna drive my car!’
The bus is better because you can read a book on the bus
Dear ‘Save Edgewater’: If I ever see you again claming that increasing supply increases prices I will spank your bottom and enroll you in an econ class at Loyola
Say YES to proposed Upzoning in Edgewater
Email: Leni@the48thward.org Call: (773) 784-5277](https://cdn.bsky.app/img/feed_thumbnail/plain/did:plc:7txt37jgs7stbnaqdfpfavf3/bafkreiezdkvktjscf3qg4q5dylaficp762suvldaswmtmrhlt2xy7catmu@jpeg)
A flier taped to a streetlight pole that reads:
“I also have access to a printer,
And I say
Upzoning is cool and good and it is my friend
Let ‘em build some housing! What're you worried about, people with jobs and homes using the Red Line?
Atraid of density? then why did you move to the big city my good friend [emoji making a ‘this guy’s nuts!’ gesture]
‘But I wanna drive my car!’
The bus is better because you can read a book on the bus
Dear ‘Save Edgewater’: If I ever see you again claming that increasing supply increases prices I will spank your bottom and enroll you in an econ class at Loyola
Say YES to proposed Upzoning in Edgewater
Email: Leni@the48thward.org Call: (773) 784-5277
God bless whoever put up this pro-upzoning poster in Edgewater, please put up more
11.07.2025 22:32 — 👍 1396 🔁 334 💬 16 📌 35
The collaborative data canvas
Your friendly neighborhood library to help you build web components!
https://lit.dev
A next-generation code editor that enables high-performance collaboration with AI and your team.
zed.dev
Sequences and consequences.
Credit Pic : Cellular landscape cross-section through a eukaryotic cell, by Evan Ingersoll
Philippians 1:6
Data Challenge Coordinator at SMT
Founder of Indiana Fever Analytics
International Multisport Events Sicko
DuckDB is an analytical in-process SQL database management system. "DuckDB" and the DuckDB logo are registered trademarks of the DuckDB Foundation.
https://emilhvitfeldt.com/
making modeling easier in #rstats with tidymodels at @posit.co
writing about feature engineering (https://feaz-book.com/) and Slidecrafting. He/Him
Official account of the Chicago Transit Authority.
Delivering quality, affordable transit services that link people, jobs and communities.
For customer support head to transitchicago.com/contact
Data Scientist - PhD in computational neuroscience - he/him - #rstats / #python
danielroelfs.com
hire me as a data scientist! PhD in Stats, recently ex Cisco. clustering, classification, #rstats. Personal: Eastern Orthodox, chess, Esperanto, battling cosmic evil. he/his, #BLM email: gzt at uchicago dot edu
Monitoring Air Quality Index (AQI) pollutants (PM 2.5, PM10, NO₂, SO₂ O₃, CO) measured in The Loop, Chicago. Managed by @nikhunder.com
An open-source reactive Python notebook: reproducible, git-friendly, execute as scripts, share as apps!
GitHub: https://github.com/marimo-team/marimo
Discord: https://marimo.io/discord?ref=bsky
Computational Social Science & Social Computing Researcher | Assistant Prof @illinoisCDS @UofIllinois | Prev @MSFTResearch | Alum @ICatGT @GeorgiaTech @IITKgp
CS Prof @ University of Illinois
24 | He/Him | Love computers, math, cooking, lifting, planes, and trains. | 日本語OK
The best goddamn dancer at the American Ballet Academy
I have the highest ratio of bot-to-real-people followers on bsky. Skeeting into the void.
🚲🏙🌈🍹
Queer punk economist. PhD graduate from Paris school of economics. working on families in poverty, early childhood and labour policies in France. #Rstats
https://arthurheim.github.io/Home/
I also shitpost a lot (usually in French)
Dad. Technical Author, Data Engineer.
Data practitioner (20y) • Writing at ssp.sh since 2015.
Focused on the craft of data engineering & storytelling.
📚 vault.ssp.sh • 📖 dedp.online
❯ #dataengineering, #opensource, #writing, #obsidian, #neovim