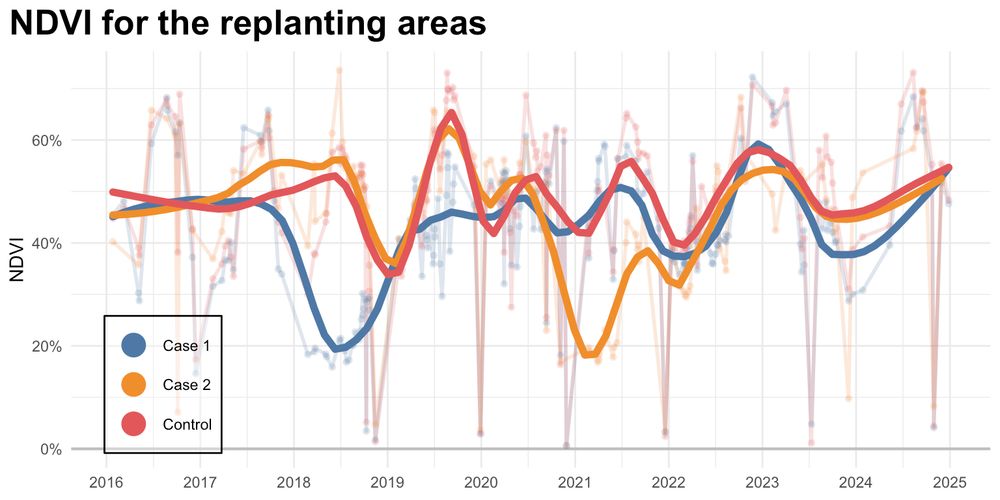
Plot showing a time series for 3 datapoints, two cases (where vineyard replanting happened at different timepoints in 2018 and 2021) and a control plot
Using publicly accessible data from the EU's Copernicus satellite project I did some (very) simple analysis on vineyard health over the course of a few years and showed how one might use it to measure recovery after a plot is razed due to illness or other planned or unplanned damage to the plants 🌱
13.05.2025 17:22 — 👍 0 🔁 0 💬 0 📌 0
Daniel Roelfs
Remote sensing of vineyard health
✨New blog post✨
Remote sensing of vineyard health 🍇
I felt inspired by a data visualization exhibition I visited a while ago and decided to try my hand at remote sensing and analyzed some satellite images in Python.
danielroelfs.com/posts/remote...
13.05.2025 17:22 — 👍 0 🔁 0 💬 1 📌 0
What’s New in R: April 28, 2025
Explore the latest in R, including a new package for U.S. elevation data, updates in R 4.5.0 like the use() function, and a guide to creating FT data viz.
This week on What's New in R:
✅ A new R package by Joey Marshall for accessing elevation data
✅ Overview of what’s new in R 4.5, compiled by Russ Hyde of Jumping Rivers
✅ A guide to replicating Financial Times-style data visualizations, by Daniel Roelfs
Read the issue: buff.ly/Y4HwU4g
#rstats
28.04.2025 15:02 — 👍 4 🔁 2 💬 0 📌 0
Daniel Roelfs
Learning data viz from the best: the Financial Times
I admire John Burn-Murdoch's ability to create really effective data visualizations. So much that I took the liberty of breaking down one of his recent figures that made the rounds and see if I could recreate it in R using only ggplot. Here's the breakdown:
danielroelfs.com/blog/financi...
16.04.2025 19:57 — 👍 9 🔁 2 💬 0 📌 1
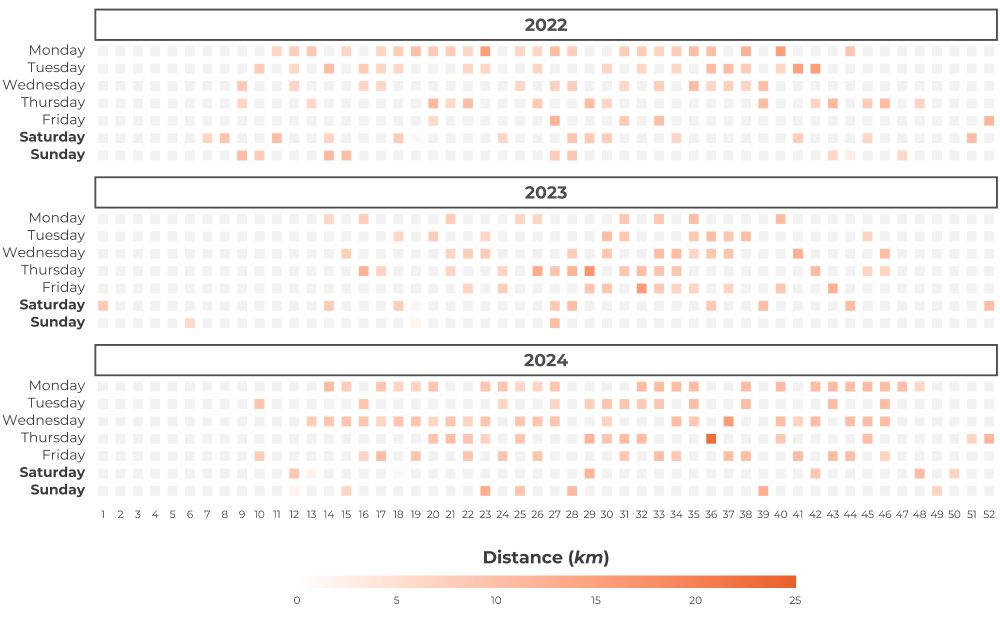
Type of GitHub tile plot using Strava running data where each tile represents the kilometers run during the day. Sparse data with some data visualisation issues around the beginning and end of the year due to overlapping week numbers and because not all years start on Monday
It also let's us create some new nerdy plots like a GitHub tile plot, but for runs across the year:
30.12.2024 21:40 — 👍 1 🔁 0 💬 0 📌 0
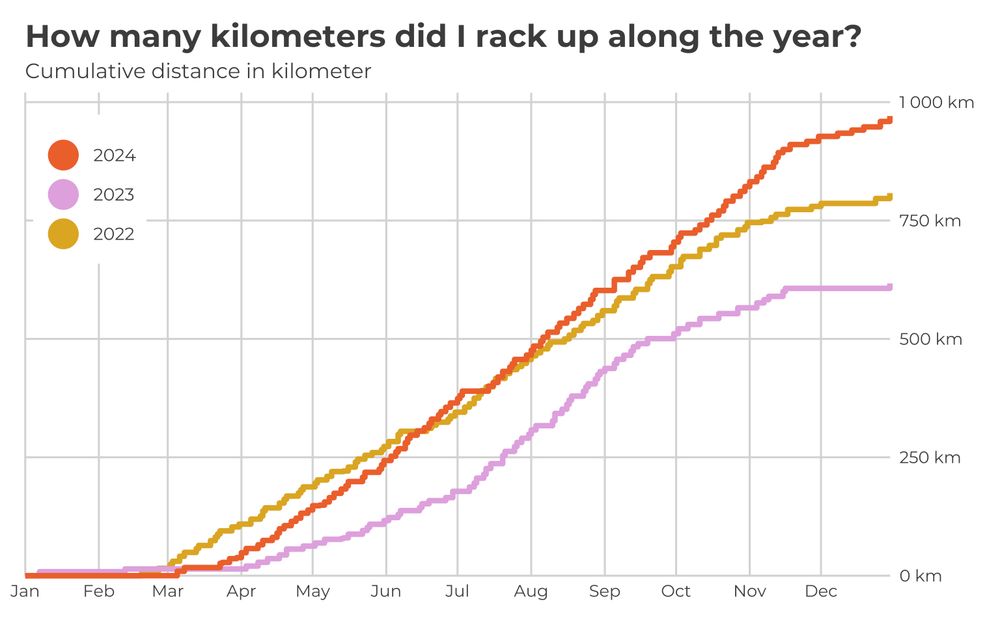
Cumulative plot showing the cumulative kilometers ran during the 2022 (in yellow), 2023 (in pink), and 2024 (in 2024)
This let's you (re)create some analysis that is only available for subscription users and create plots that aren't available in Strava at all
30.12.2024 21:40 — 👍 0 🔁 0 💬 1 📌 0
Daniel Roelfs
Strava Data Analysis using Python and R
Anyone that uses Strava has access to a large, self-generated (!), dataset 🧡. And at the end of the year it's quite fun to try to parse something interesting and relevant from that dataset: danielroelfs.com/blog/strava-...
30.12.2024 21:40 — 👍 0 🔁 0 💬 1 📌 0
GitHub - MichelNivard/awesome-complex-trait-genetics: A list of awesome tools for complex trait genetics.
A list of awesome tools for complex trait genetics. - MichelNivard/awesome-complex-trait-genetics
🚨 This will become a curated list of awesome tools for complex trait genetics, **add yours**! it may become a review in which case those who contribute are invited as co-authors.
28.11.2024 09:21 — 👍 73 🔁 40 💬 7 📌 4
The slide decks were optimised for the screen in the auditorium (which was 1920x1200) so the slides are best viewed on a screen of that size, or perhaps on another 16x10 screen.
24.11.2024 14:02 — 👍 1 🔁 0 💬 0 📌 0
PhD Defense
Slides for the trial lecture and disputation are available here: slides.danielroelfs.app/2024-11-19-p... Perhaps some of my illustrations in either slide deck are useful for others in the imaging-genetics or psychiatric genetics field! 😊
24.11.2024 13:42 — 👍 1 🔁 1 💬 1 📌 0
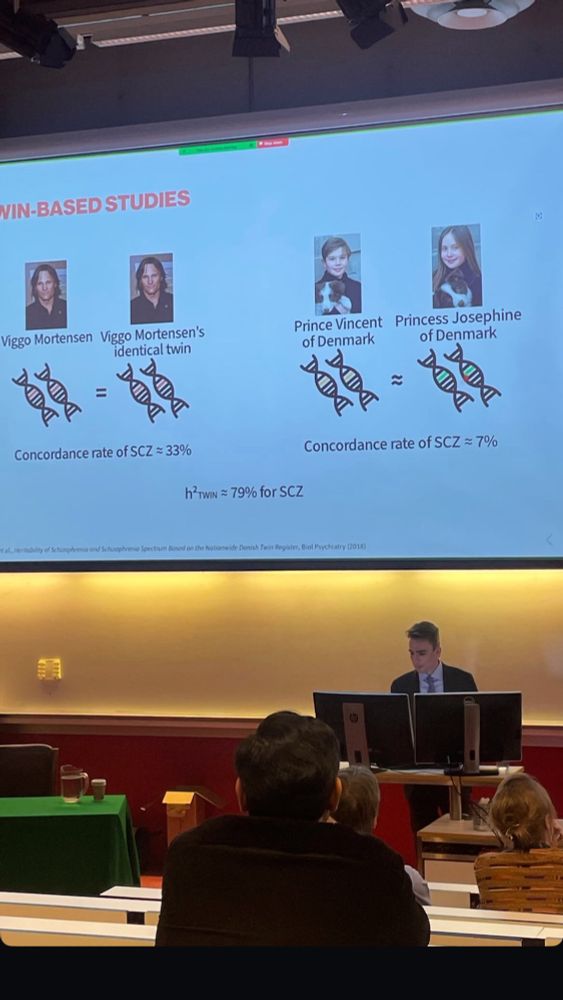
Photo of myself presenting at the trial lecture with a slide on twin-based studies in the background
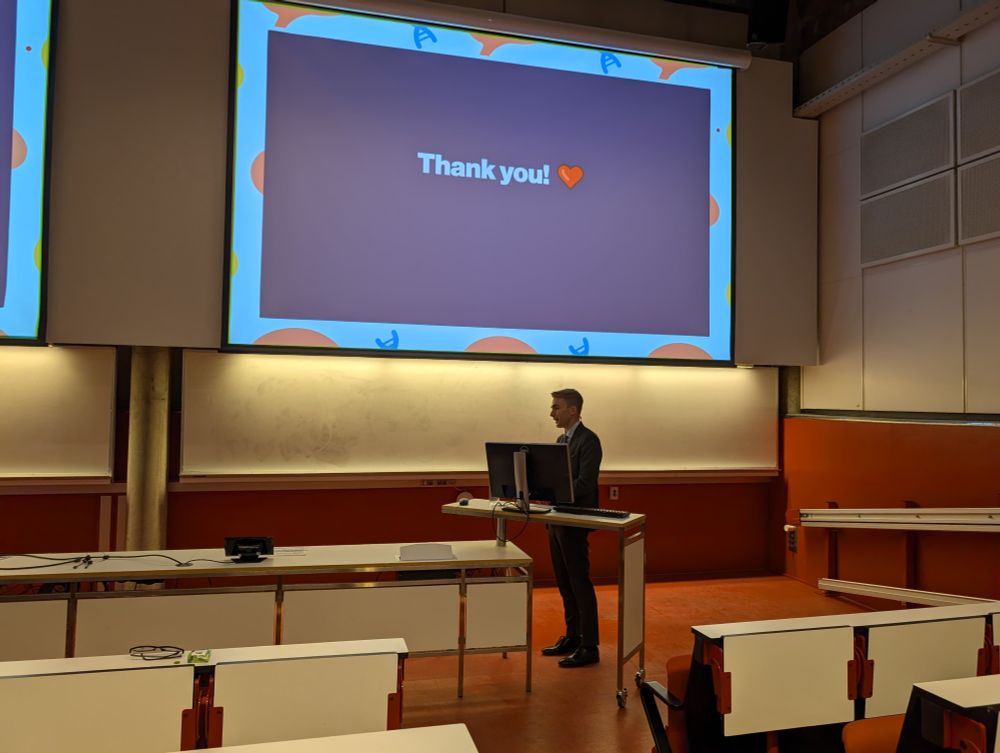
Photo of myself during the disputation with a "thank you" slide in the background
Last Tuesday I defended my PhD in computational neuroscience and psychiatric genetics 🥳
PhD theses are rarely read outside of the supervisors and committee, so I tried to write it in an accessible way and published a digital version here: thesis.danielroelfs.app
- Daniel Roelfs, PhD
24.11.2024 13:42 — 👍 9 🔁 2 💬 1 📌 0
Mendelian randomization users, what should I call a polygenic score created for and used with MR?
I find PGS/PGI confusing to newcomers as not all ways of creating a PGS will do.
Would it be clearer to call this score an allelic score instead? Or something else?
22.07.2024 14:19 — 👍 0 🔁 2 💬 1 📌 0
RELX Group Lobbying Profile
RELX Group spent $3,180,000 lobbying in 2023. See the details.
Elsevier's parent company RELX has spent about as much money lobbying US politicians in 2023 as large financial companies like JPMorgan Chase and massive car companies like Ford www.opensecrets.org/federal-lobb...
09.05.2024 10:54 — 👍 0 🔁 0 💬 0 📌 0
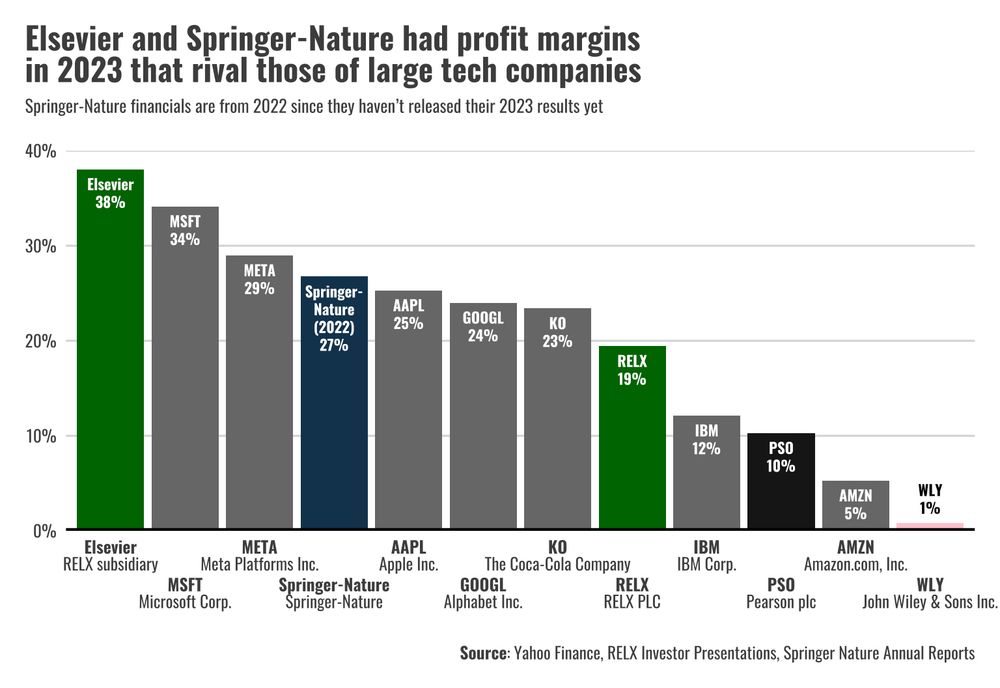
Barplot showing the profit margins for a number of scientific publishers and other companies for comparison
Scientific publishing (Elsevier and Springer-Nature specifically) has higher profit margins than some of the biggest tech companies such as Apple and Google (up to 38% 🤯) . These margins have been stable for years
09.05.2024 10:50 — 👍 0 🔁 0 💬 1 📌 0
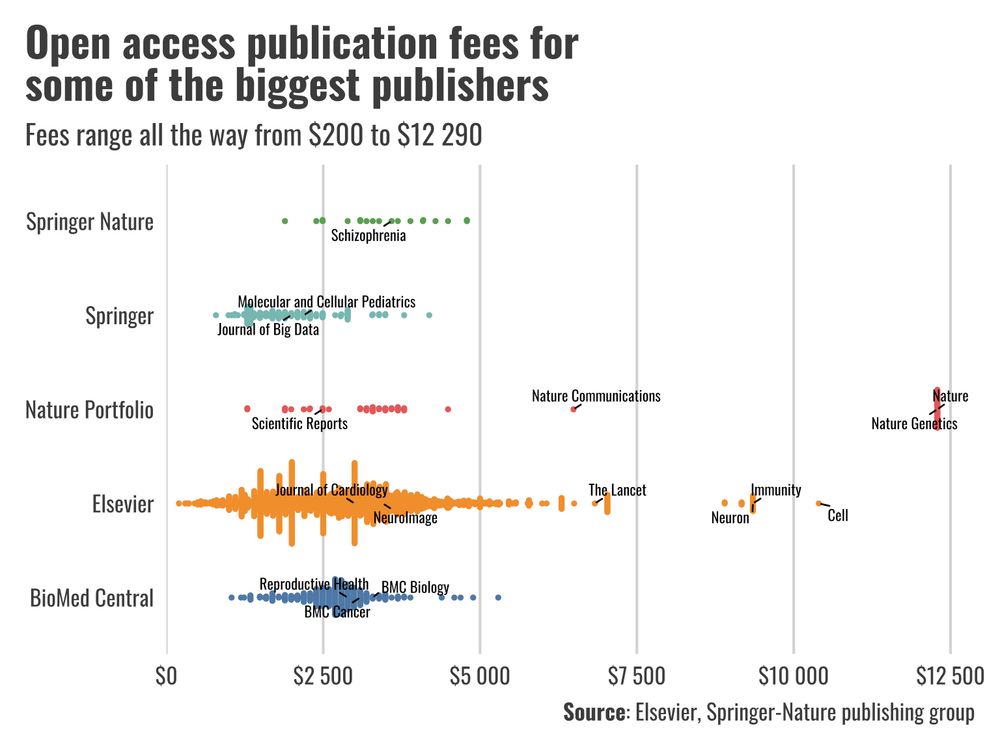
Open access fees for some of the biggest journals have exceeded $11.000 (120.000 NOK) PER ARTICLE.
09.05.2024 10:47 — 👍 0 🔁 0 💬 1 📌 0
Daniel Roelfs
Daniel Roelfs' personal website
It's hard to explain why scientific publishers like Elsevier and Springer-Nature make the kind of money they do.
So hard that I did the data analysis and wrote it down so I could easily share it and perhaps help others understand how broken the system is:
danielroelfs.com/blog/the-mon...
09.05.2024 10:46 — 👍 0 🔁 0 💬 1 📌 0
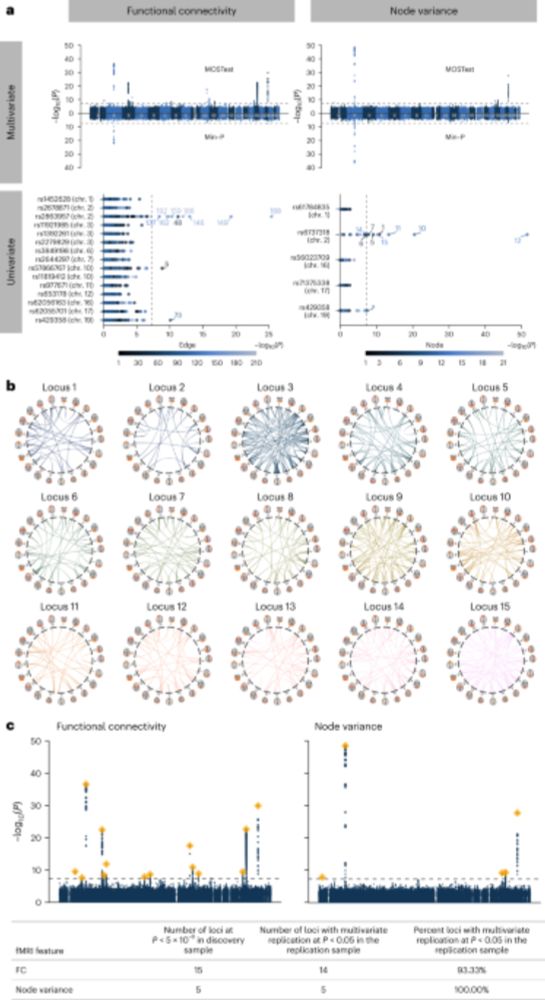
Preprint available here: www.medrxiv.org/content/10.1...
Data and code available here: github.com/norment/open...
08.01.2024 19:21 — 👍 0 🔁 0 💬 0 📌 0
The findings in this paper provide some additional genetic support for the dysconnectivity hypothesis in a number of psychiatric disorders as well as identifying potential targets for future etiological studies
08.01.2024 19:06 — 👍 0 🔁 0 💬 1 📌 0
This allowed us to find biologically relevant loci (involved in synaptic development and functioning) and discover shared genetic architecture with a number of psychiatric disorders. These overlapping loci are in turn also associated with a number of biologically relevant biological processes
08.01.2024 19:04 — 👍 0 🔁 0 💬 1 📌 0
fMRI has quite a lot of noise to say it kindly, so deploying a multivariate approach to look at global resting state functioning instead of individual networks really helped to capture relevant genetic variance.
08.01.2024 19:00 — 👍 0 🔁 0 💬 1 📌 0
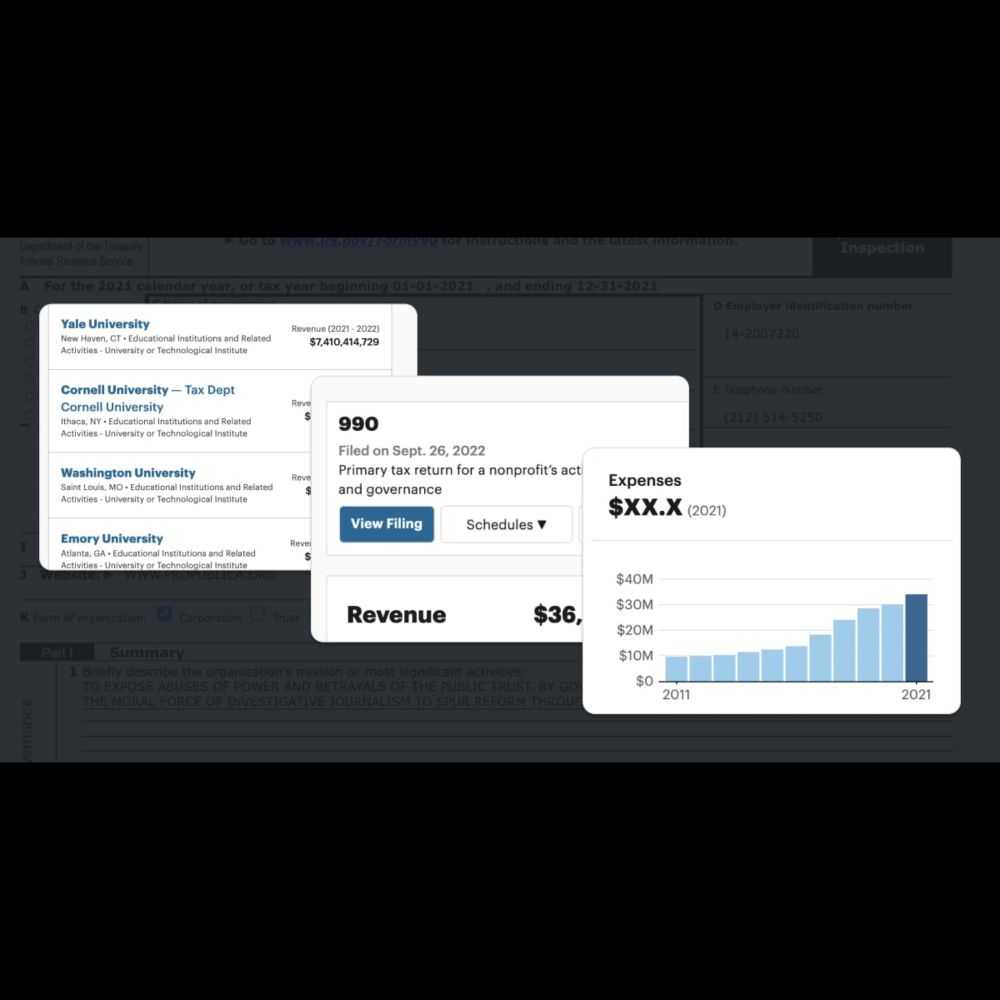
Society For Neuroscience - Nonprofit Explorer - ProPublica
Since 2013, the IRS has released data culled from over 1.8 million nonprofit tax filings. Use this database to find organizations and see details like their executive compensation, revenue and expense...
Are people (and neuroscientists in particular) aware that that the SfN chair has a total compensation of about $960.000? That's about 4% of total revenue. I've left academia a while ago and Twitter is terrible since the takeover so maybe I missed some discourse, but it feels that's a lot? Source:
14.12.2023 19:01 — 👍 4 🔁 0 💬 0 📌 0
Scientist/Author/Speaker; Presidential Distinguished Prof/Director Center for Science, Sustainability & the Media/Vice Provost for Climate, U. Penn; National Academy of Sciences; Royal Society; Tyler Prize
The original and only WomensArt....
Real art...real artists
Images © to respective owners
PhD research fellow in neuroscience, neuroendocrinology and psychiatric genetics 🧠🧬 @uio.no 🇧🇻
... also into triathlon 🏊♀️🚴♀️🏃♀️, baking 🎂 and music 🎶
(she/her)
Assyriologist at Wolfson College (Oxford), writer plagued by self-doubt, lover of dead languages. I think we should all be doing what we can to save the planet.
My book is now out! 😎 https://lnk.to/BetweenTwoRivers
We teach all the essential tools which are usually skipped in academic education so everyone can make full use of software, computing, and data with focus on reusability, reproducibility, and openness.
Waitress turned Congresswoman for the Bronx and Queens. Grassroots elected, small-dollar supported. A better world is possible.
ocasiocortez.com
UKCOTS is for everyone with an interest in the teaching of statistics in higher education in whatever department or discipline. https://www.ukcots.org/
Senter for digitalt liv Norge, DLN – et nasjonalt senter for bioteknologisk forskning og innovasjon – Centre for Digital Life Norway
Biologist/Neuroscientist/Prof at Charité Berlin and at Diakonhjemmet Hospital Oslo| interested in sex hormones and the brain | PI FemHealth Project & ERC StG MappingPerimenopause | she/her | FirstGen
Researcher at University of Oslo
Likes to be where population neuroimaging and psychiatric genetics meet
Maps, charts, illustrations, animations, 3d models, data analysis and fun little easter eggs from your favorite graphics team. https://www.reuters.com/graphics/
Neuroimaging researcher | Data scientist | Knowledge seeker | Nature lover | Wanderlust | Living in Oslo 🇳🇴 | 🧖♀️🧘♀️🌊🏝️
Professor of psychology, University of Oslo. Associate Editor for JCPP Advances. PI GeoGen research group, PROMENTA research center. ERC CoG project GeoGen. Parter in ESSGN.
English/Irish/EU in Spain. PhD in psychology & self-appointed data police cadet. Interested in the lower tail of many distributions. Not yet disabled.
ID confirmation: https://x.com/sTeamTraen/status/1858181372126408774
Open-source scientific and technical publishing system brought to you by posit.co.
github.com/quarto-dev/quarto-cli
R, data, 🐕, 🍸, 🌈. He/him.
PhD fellow @UniOslo | 🧠 studying emotion circuits in the brain, child & parent mental health | symptom-brain-networks | former CANDLab visiting grad student @Yale
Graphics, visualizations, maps and more from The Washington Post.
🇳🇴🇵🇰commentator/journalist @VG.no, Author, #Cat mom, Fellow, Oxford University, Award-winning Non-fiction #Utavskyggene
👦🏽👦🏽 Mom ✊🏽 Feminist. Oslo, Norway
https://www.instagram.com/shaziamajid9/profilecard/?igsh=MTdseWRpYnpkYmY1YQ==