Fitting a generalized mixed model with a gamma distribution log link and random slopes to reaction time data to arrive at precisely the same point estimate as the authors did by simply averaging and conducting a t-test:
28.05.2025 17:22 — 👍 294 🔁 34 💬 19 📌 6

A new use of the asterisk in the paper author list for credit assignment
18.05.2025 18:23 — 👍 418 🔁 67 💬 8 📌 4
Psych-DS
A specification for psychological datasets. JSON metadata, predictable directory structure, and machine-readable specifications for tabular datasets.
Psych-DS is (1) spellcheck for your datasets and (2) a pathway to standardizing data in our academic fields that *everyone* can learn.
And it's live RIGHT NOW!
psych-ds.github.io
(This is the announcement post I've been leading up to)
09.04.2025 19:37 — 👍 132 🔁 58 💬 9 📌 12
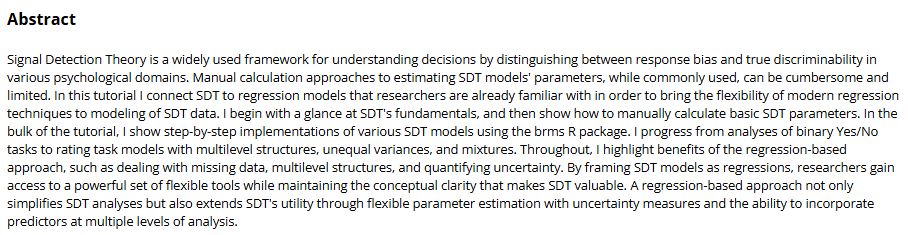
Nice tutorial on how to do signal detection analyses in R with the brms package
@matti.vuorre.com
osf.io/preprints/ps...
09.04.2025 14:01 — 👍 38 🔁 9 💬 2 📌 1
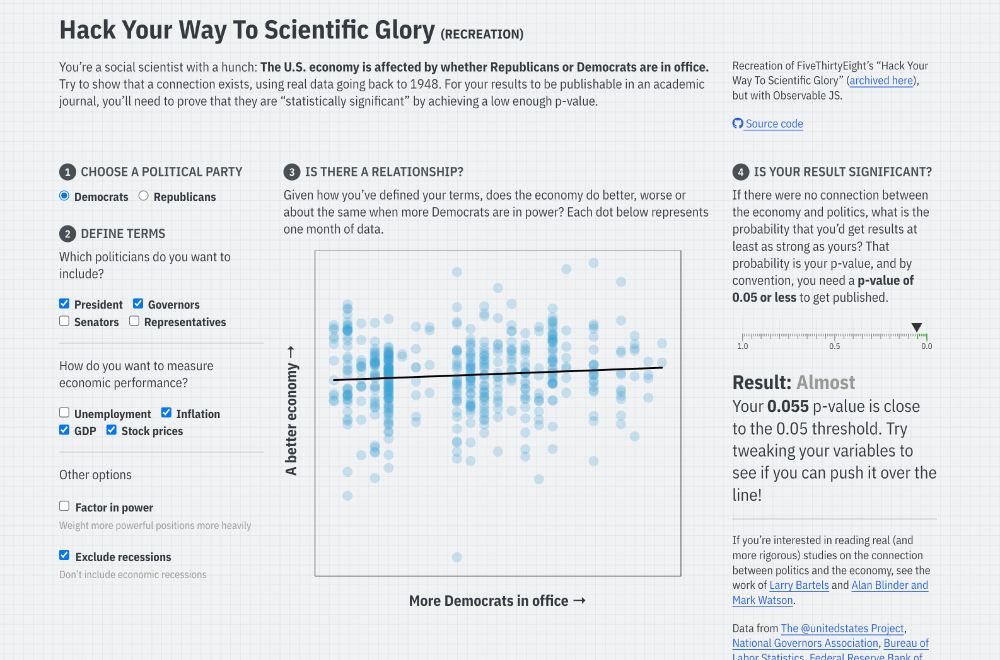
Screenshot of the linked Quarto website, with input checkboxes to change different conditions for a regression model that predicts economic performance based on US political party, with a reported p-value
I’ve long used FiveThirtyEight’s interactive “Hack Your Way To Scientific Glory” to illustrate the idea of p-hacking when I teach statistics. But ABC/Disney killed the site earlier this month :(
So I made my own with #rstats and Observable and #QuartoPub ! stats.andrewheiss.com/hack-your-way/
20.03.2025 18:30 — 👍 1472 🔁 442 💬 58 📌 29
With a heavy heart, I've decided to suspend all academic travel to the USA for me and my lab. Given the escalation of tensions and uncertainties, it seems to be the wisest move. To our US colleagues, please be certain that we will continue to do what we can to support you. Science is global.
16.03.2025 23:07 — 👍 1313 🔁 169 💬 28 📌 16
I really liked this idea of using a histogram as a legend in a choropleth map (since land isn't unemployed; people are), so I made a little guide to doing it with #rstats, {ggplot2}, and {patchwork}
www.andrewheiss.com/blog/2025/02...
19.02.2025 17:58 — 👍 870 🔁 193 💬 28 📌 23
This is idian: – {{< iconify fa6-brands r-project >}}idian
🚨 I am soft Launching a full stable version of Ridian, which brings R to Obsidian, check out the website, and download the plugin from the Obsidian app or plugin website. #rstats #quartopub #obsidian
24.11.2024 13:59 — 👍 63 🔁 16 💬 6 📌 0
Causal methods peeps. Can you point me to a good intro reading on DAGs? Something more easily digestible than Pearl's primary papers but more technical than the kinds of 30,000-ft summaries you get from a Google search.
24.11.2024 19:42 — 👍 59 🔁 9 💬 20 📌 3
Great, this will be my first time to escop as well
22.11.2024 12:00 — 👍 2 🔁 0 💬 0 📌 0
Folks who use #rstats with github, how am I supposed to be managing the data for my project with 100mb file size limit? Am I going about this all wrong?
19.09.2024 18:17 — 👍 4 🔁 4 💬 8 📌 1
It was really great talk!
25.08.2024 19:05 — 👍 3 🔁 0 💬 0 📌 0

Fun with Positron | Andrew Heiss
Combine the best of RStudio and Visual Studio Code in Posit’s new Positron IDE
New blog post! Read about Posit's new Positron editor, see some of the neat new features it has, and check out the settings and extensions I use. It includes a bonus workaround for connecting to a remote server with SSH! #rstats
08.07.2024 13:51 — 👍 42 🔁 16 💬 1 📌 1
Our new paper - ChatGPT improves creativity, boosts self-efficacy, and makes problem-solving tasks easier and requiring less mental effort.
Magic link to pass through authors.elsevier.com/a/1iqFi1Hucd...
27.03.2024 14:34 — 👍 2 🔁 0 💬 1 📌 0
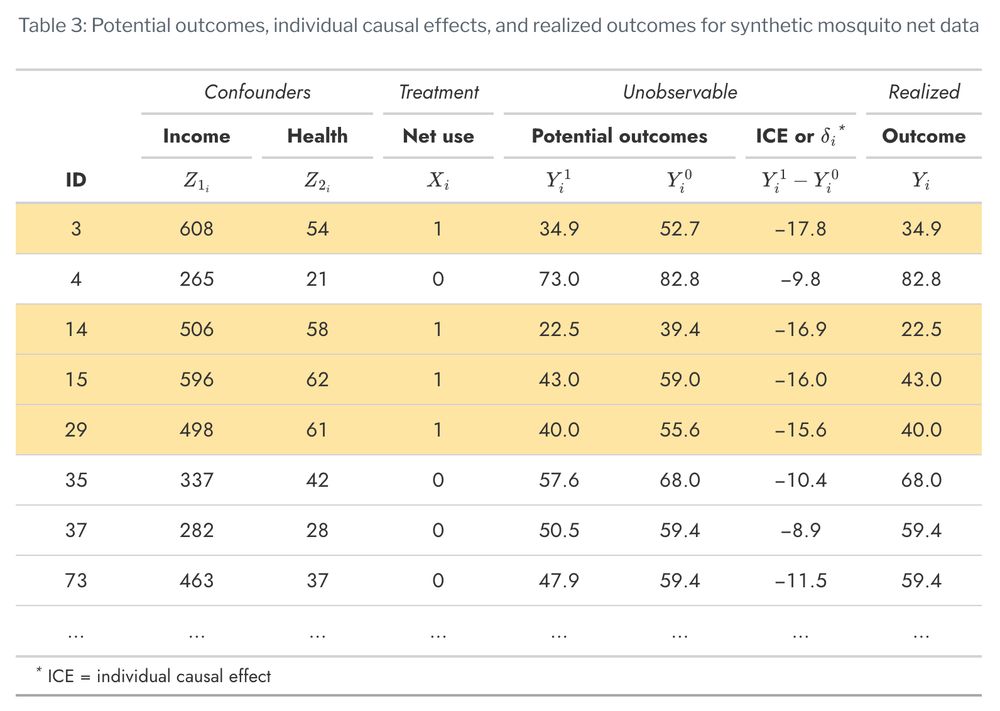
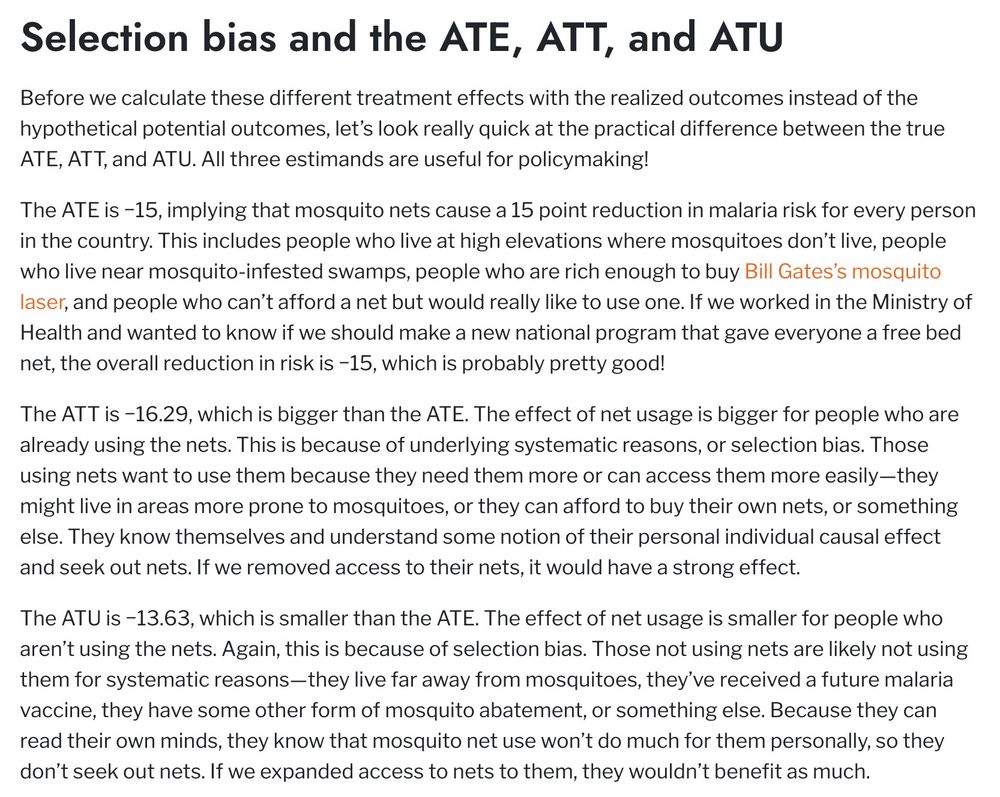
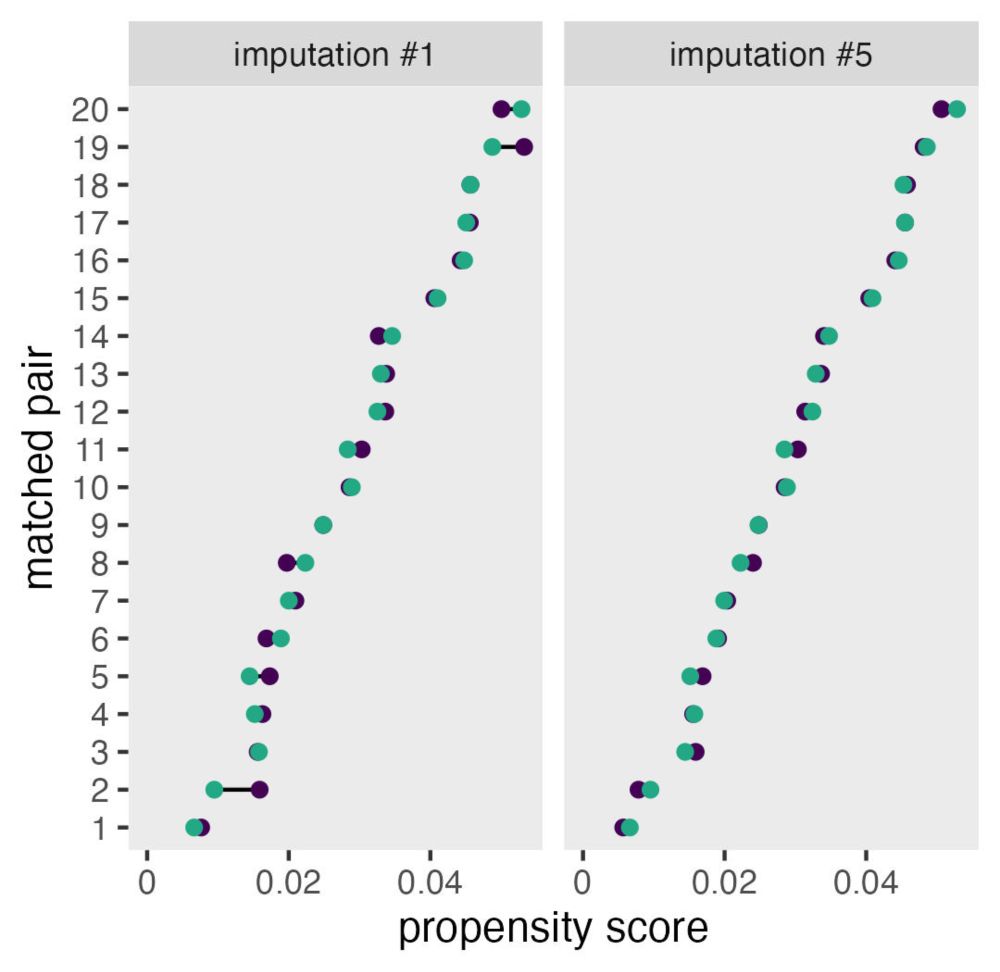
Before we calculate these different treatment effects with the realized outcomes instead of the hypothetical potential outcomes, let’s look really quick at the practical difference between the true ATE, ATT, and ATU. All three estimands are useful for policymaking!
The ATE is −15, implying that mosquito nets cause a 15 point reduction in malaria risk for every person in the country. This includes people who live at high elevations where mosquitoes don’t live, people who live near mosquito-infested swamps, people who are rich enough to buy Bill Gates’s mosquito laser, and people who can’t afford a net but would really like to use one. If we worked in the Ministry of Health and wanted to know if we should make a new national program that gave everyone a free bed net, the overall reduction in risk is −15, which is probably pretty good!
The ATT is −16.29, which is bigger than the ATE. The effect of net usage is bigger for people who are already using the nets. This is because of underlyi
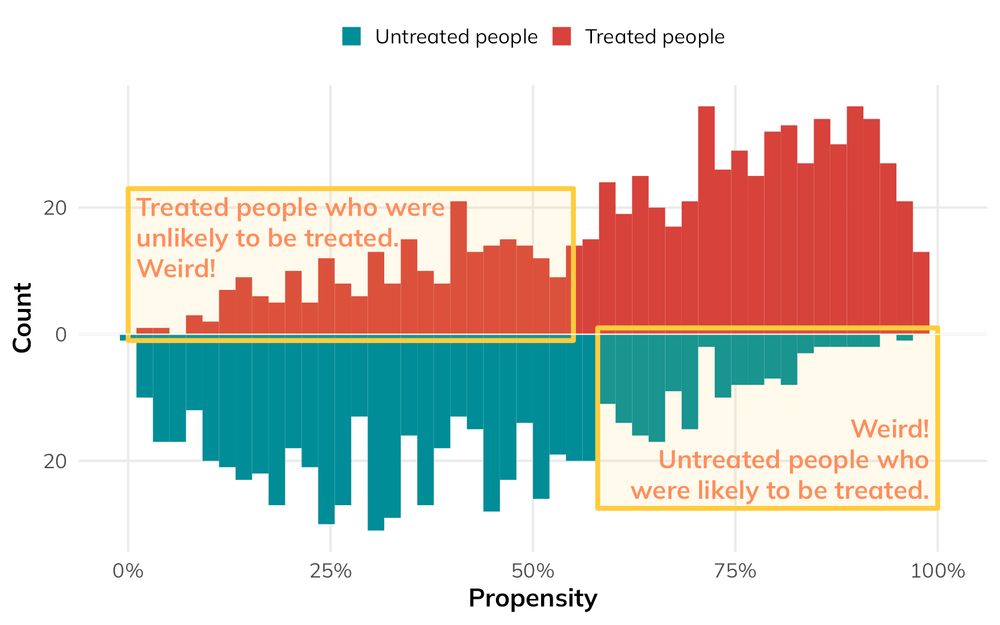
Mirrored histogram showing “weird” parts of the population: treated people who were unlikely to be treated, and untreated people who were likely to be treated
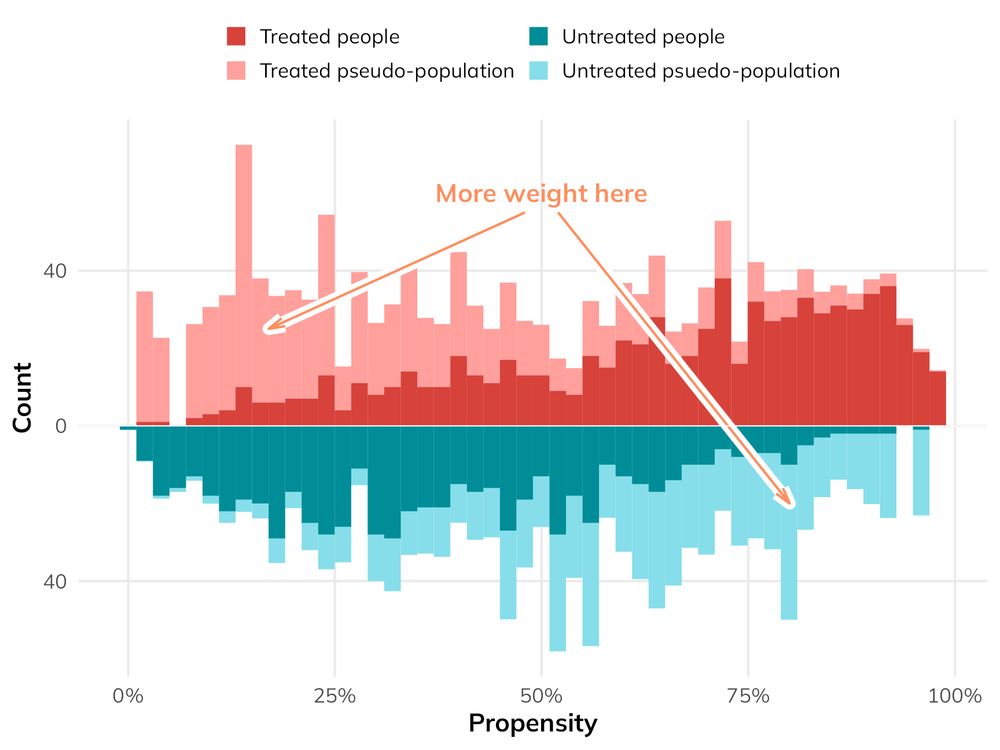
Mirrored histogram showing pseudo-populations of treated and untreated people that have been reweighted to be more comparable and unconfounded
New blog post! Have you (like me!) wondered what the ATT means and how it's different from average treatment effects? I use #rstats to explore why we care about the ATE, ATT, and ATU + how to calculate them with observational data! #polisky #episky #econsky www.andrewheiss.com/blog/2024/03...
21.03.2024 13:50 — 👍 115 🔁 41 💬 8 📌 7
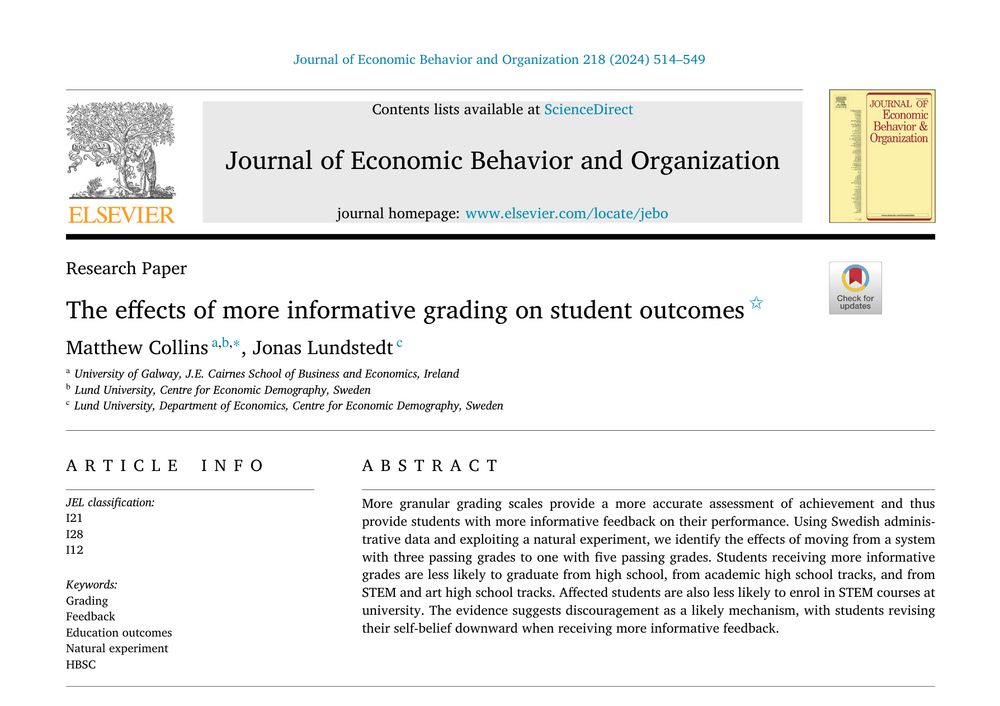
Title page for "The effects of more informative grading on student outcomes" in the Journal of Economic Behavior and Organization, with this abstract:
More granular grading scales provide a more accurate assessment of achievement and thus provide students with more informative feedback on their performance. Using Swedish administrative data and exploiting a natural experiment, we identify the effects of moving from a system with three passing grades to one with five passing grades. Students receiving more informative grades are less likely to graduate from high school, from academic high school tracks, and from STEM and art high school tracks. Affected students are also less likely to enrol in STEM courses at university. The evidence suggests discouragement as a likely mechanism, with students revising their self-belief downward when receiving more informative feedback.
My own grading system details:
Problem sets
To practice writing R code, running inferential models, and thinking about causation, you will complete a series of problem sets.
You need to show that you made a good faith effort to work each question. I will not grade these in detail. The problem sets will be graded using a check system:
✔+: (33 points (110%) in gradebook) Assignment is 100% completed. Every question was attempted and answered, and most answers are correct. Document is clean and easy to follow. Work is exceptional. I will not assign these often.
✔: (30 points (100%) in gradebook) Assignment is 70–99% complete and most answers are correct. This is the expected level of performance.
✔−: (15 points (50%) in gradebook) Assignment is less than 70% complete and/or most answers are incorrect. This indicates that you need to improve next time. I will hopefully not asisgn these often.
This is a really neat paper that argues that more detailed grading systems (e.g, A–F) are *worse* for student motivations and outcomes than more simpler ones doi.org/10.1016/j.je...
It tracks with my own check-based grading system (✓, ✓+, and ✓−), and now I have more evidence backing that up :)
26.02.2024 15:45 — 👍 26 🔁 10 💬 4 📌 1
Rel = 1 - (SEE^2)/V_T
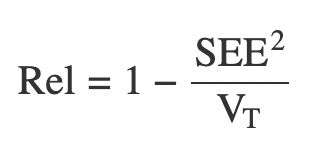
New post on estimating the reliability of parameters in multilevel models. There's an easy solution using the standard errors of your shrunk parameters. It feels kind of obvious, but maybe it isn't sufficiently obvious yet.
rubenarslan.github.io/posts/2024-0...
26.02.2024 16:03 — 👍 17 🔁 10 💬 2 📌 0
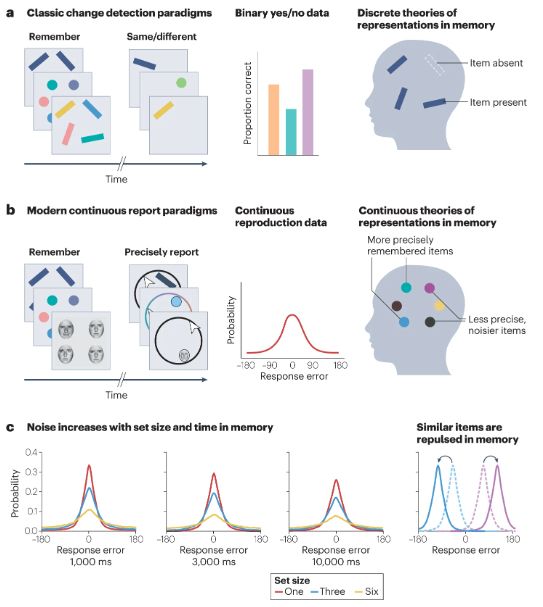
Categorical and continuous reproductions in memory
'Noisy and hierarchical visual memory across timescales', a new Review by Timothy F. Brady (@timbrady.bsky.social), Maria M. Robinson & Jamal R. Williams (@jamalamal.bsky.social)
Web: go.nature.com/42Bhac0
PDF: rdcu.be/dyb6G
#psychology #psychscisky #cogpsyc
08.02.2024 20:43 — 👍 39 🔁 26 💬 1 📌 2
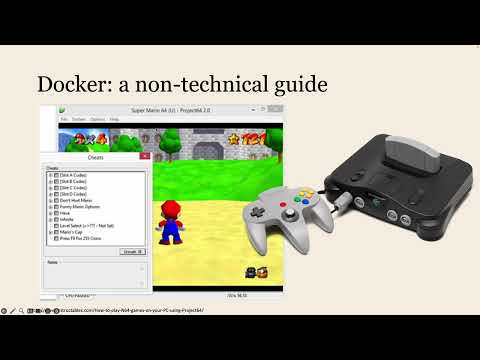
https://www.youtube.com/watch?v=uvbbrefeW4I
Want to learn how to use docker for reproducible data science with R / RStudio, but not sure where to start? I just re-recorded a recent workshop talk www.youtube.com/watch?v=uvbb... #rstats #statistics #psychology #docker
07.02.2024 18:45 — 👍 9 🔁 3 💬 0 📌 0
Spatial representations of natural scene images generalize across individuals, tasks, and viewing time: http://osf.io/243xw/
03.02.2024 17:32 — 👍 0 🔁 1 💬 0 📌 0
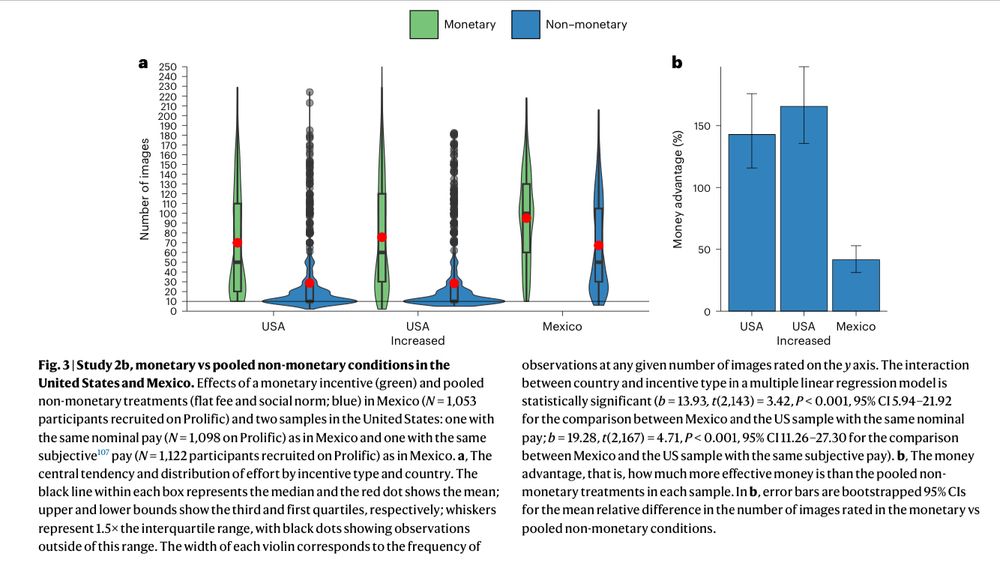
Counterintuitively, psychological motivators (eg competition or helping others) are more effective in poorer, non-WEIRD, countries than material incentives, research
suggests: buff.ly/3Sbvtk9
28.01.2024 08:20 — 👍 2 🔁 2 💬 0 📌 0
Stat’s What It’s All About - Centering in Moderation Analysis: A Guide
⚠️⚠️New Blog Post!⚠️⚠️
Centering in Moderation Analysis: A Guide
I talk about: how to center variables (including categorical variables!), when you need to use it (moderation analysis, ANOVA) and how to do it (with easystats's {datawizard})!
#rstats
21.01.2024 12:55 — 👍 21 🔁 15 💬 2 📌 1
"There is a catastrophic error in the logic of the standard statistical methods in almost all the sciences."
The eugenics part is imo a bit lengthy but otherwise really neat book. I've always been Jaynes-curious but not galaxy-brained enough for the primary source--so far this book has delivered.
17.01.2024 10:21 — 👍 8 🔁 2 💬 2 📌 0
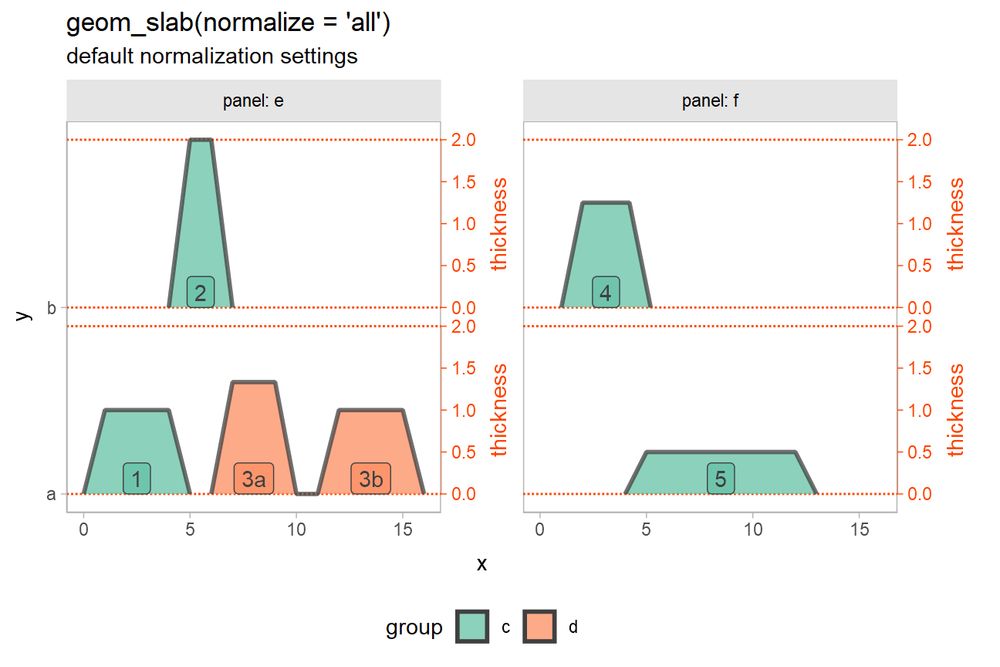
A plot of geom_slab(normalize = "all") with two rows in two panels: all slabs are normalized on the same scale according to the thickness of the tallest slab.
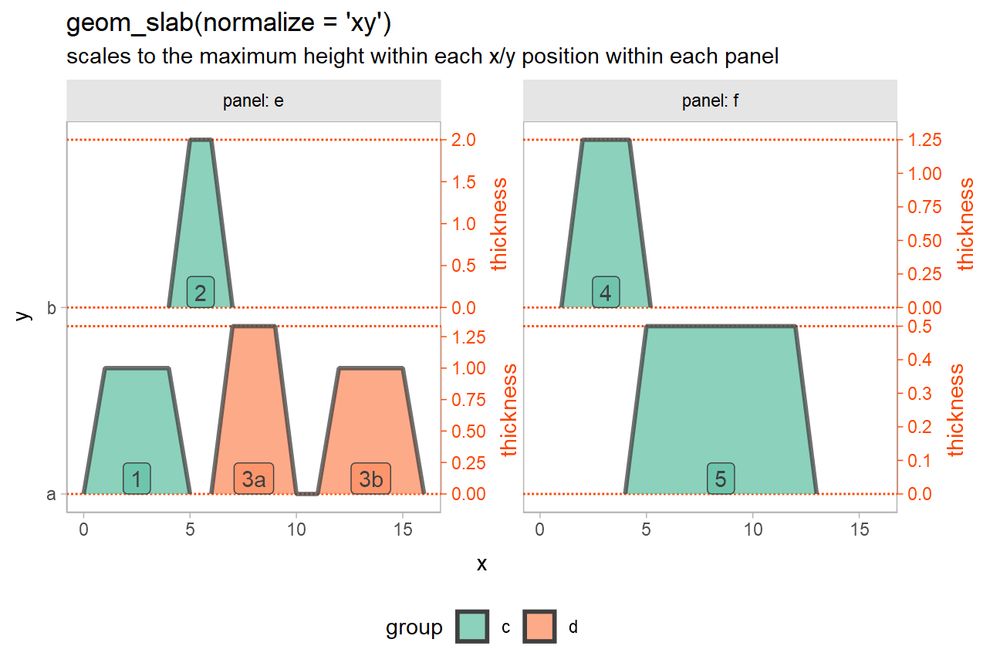
A plot of geom_slab(normalize = "xy") with two rows in two panels: all slabs are normalized according to the thickness of the tallest slab at the same y position within the same panel.
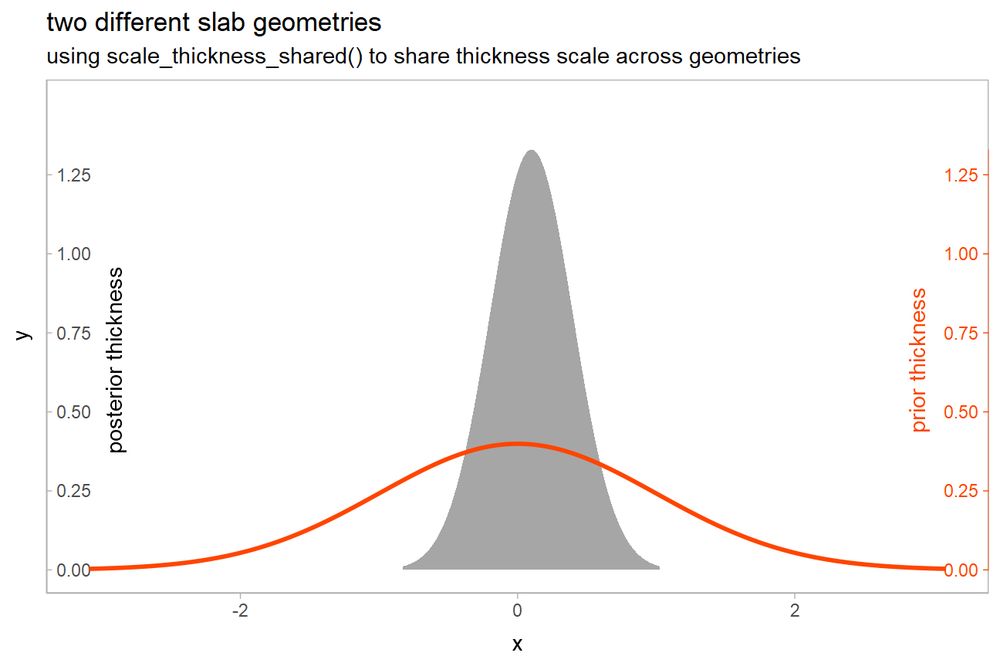
A plot constructed of two different densities made using different geom_slab() layers. The heights of the densities are scaled together so that both have the same area.
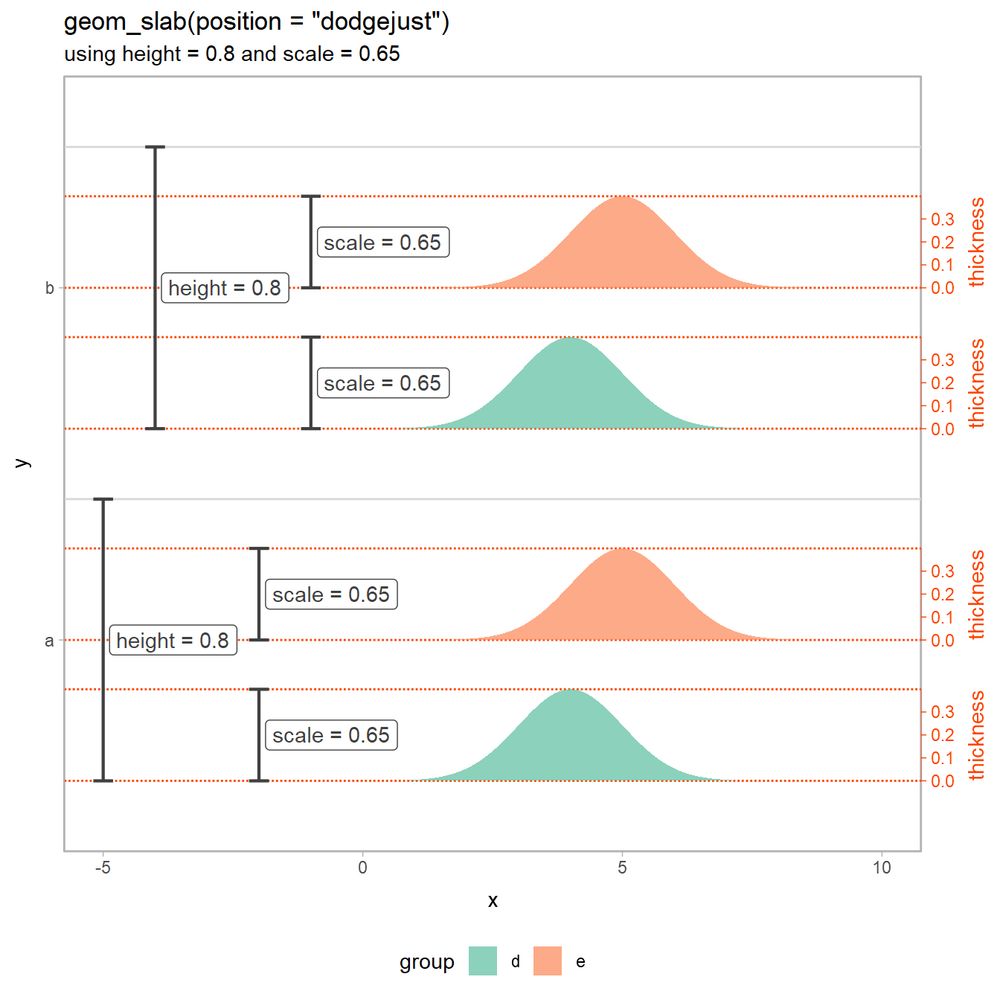
A plot created using geom_slab(position = "dodgejust", height = 0.8, scale = 0.65). Slabs with the same y value are dodged vertically within a shared space of height 0.8. Then, that region is equally divided into
subregions for each slab, and each slab is drawn within 0.65 * the height of its subregion.
For any ggdist #rstats users, I finally wrote down all the crap about how scaling of slabs / thickness works in case it's ever befuddled you mjskay.github.io/ggdist/artic...
15.01.2024 03:12 — 👍 37 🔁 16 💬 3 📌 0
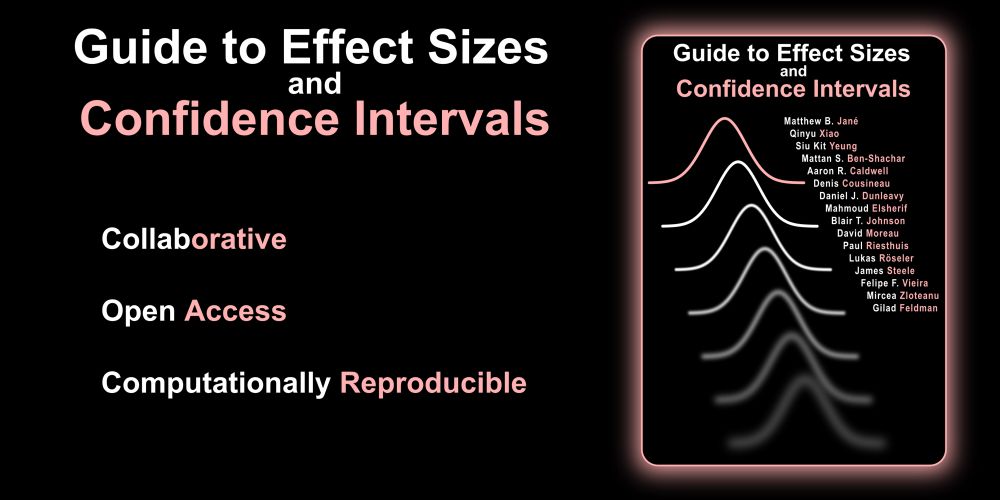
Guide to Effect Sizes and Confidence Intervals
Big 2024 announcement! The “Guide to Effect Sizes and Confidence Intervals” had a pretty substantial update and is slowly becoming the most comprehensive resource on effect sizes and confidence intervals. Here is a thread of some of the new additions 1/5 t.co/ByeSMQNJdp
02.01.2024 03:09 — 👍 123 🔁 71 💬 1 📌 6
PCI Registered Reports
Peer Community in Registered Reports
Perception/i-Perception are now officially PCI-Interested journals!
As I am both the RR-editor at these journals & a recommender at PCI:RR, we expect this to be a streamlined process. Contact me for more info. #visionscience #psychscisky #neuroskyence
rr.peercommunityin.org/about/pci_rr...
18.12.2023 22:42 — 👍 14 🔁 7 💬 1 📌 0
That is great idea!
05.11.2023 19:27 — 👍 1 🔁 0 💬 1 📌 0
PhD student in the Object Vision Group at CIMeC, University of Trento. Interested in neuroimaging and object perception. He/him 🏳️🌈
https://davidecortinovis-droid.github.io/
Professor of Psychology, University of Minnesota. Sporadically writing stuff at http://getsyeducated.substack.com
psycholinguist, based in Prague, head of the ERCEL Lab (https://ercel.ff.cuni.cz/)
Cognitive Neuroscientist @ University of Granada
https://ugr.es/~cgonzalez/
Ramón y Cajal researcher at the CIMCYC (Universidad de Granada, Spain).
Currently migrating personal site to: https://ortiztudela.github.io/ortiztudela/
she/her
Cognitive Neuroscience PhD candidate 🧠
Univ of Granada/CIMCYC https://cimcyc.ugr.es/en
Statistics lecturer | Freelance statistical consultant & research analyst | #rstats dev @easystats.github.io
home.msbstats.info
(He/Him)
Clinical Psychologist. Professor of Psychology. Editor of Advances in Methods and Practices in Psychological Science. All views are personal, expressed as a private citizen.
Very short science fiction/fantasy stories by O. Westin.
Please repost any you like.
Patreon: https://patreon.com/microsff
Ko-Fi: https://ko-fi.com/microsff
Books: https://microsff.com/books
Ekonom mezi právníky na Univerzitě Karlově. Člen NERVu. Iracionálně zapálen pro myšlenku, že veřejné politiky mají být racionální.
America’s first research university. Leading discovery and sharing knowledge to better the world since 1876. With campuses & centers in Baltimore & around the world.
Poll aggregation and election analysis in Europe.
Partner of Africa, America, Asia, and Oceania Elects.
He/him. Professor of Psychology at GMU. I study social perception and cognition. Carlton supporter.
Cognitive neuroscientist at U of Delaware
Max Planck group leader at ESI Frankfurt | human cognition, fMRI, MEG, computation | gets to do science with the coolest (phd) students et al. | she/her | never an AI
Vision Scientist at the University of Rochester
Join us for #VSS2025, May 16-20, 2025 in St. Pete Beach, Florida.
second-year phd student at jhu psych | perception + cognition
https://talboger.github.io/
Open Science, Repetitive Research, Research on research; likes repetition, likes repetition
https://replicationresearch.org/