Call for Papers: Big Data before Data Science
📢 Call for Papers
The Journal of the Royal Statistical Society, Series A (@jrssa.bsky.social) invites submissions for a special issue exploring historical data practices and their impact on modern data science. @royalstatsoc.bsky.social
🔍 Explore the full call: oxford.ly/4rgfcdl
20.11.2025 18:00 — 👍 2 🔁 1 💬 0 📌 0

Bayesian evidence synthesis for modelling SARS-CoV-2 transmission
Abstract. The acute phase of the COVID-19 pandemic has made apparent the need for decision support based upon accurate epidemic modelling. This process is
🆕Bayesian evidence synthesis for modelling SARS-CoV-2 transmission
🧪Apsemidis and Demiris adopt the Bayesian paradigm and synthesize publicly available data via a discrete-time stochastic epidemic modelling framework doi.org/10.1093/jrss...
21.11.2025 14:18 — 👍 2 🔁 1 💬 0 📌 0

We demonstrate that higher variability in snap timing is beneficial for the passing game, as it relates to facing less havoc created by the opposing defence. We also obtain a quarterback leaderboard based on our snap timing variability measure, and Patrick Mahomes stands out 🐐
21.11.2025 14:17 — 👍 3 🔁 2 💬 0 📌 0
Using a Bayesian multilevel model with heterogeneous variances, we provide an assessment of National Football League (NFL) quarterbacks and their ability to synchronize the timing of the ball snap with pre-snap movement from their teammates.
21.11.2025 14:17 — 👍 2 🔁 1 💬 1 📌 0
Validate User
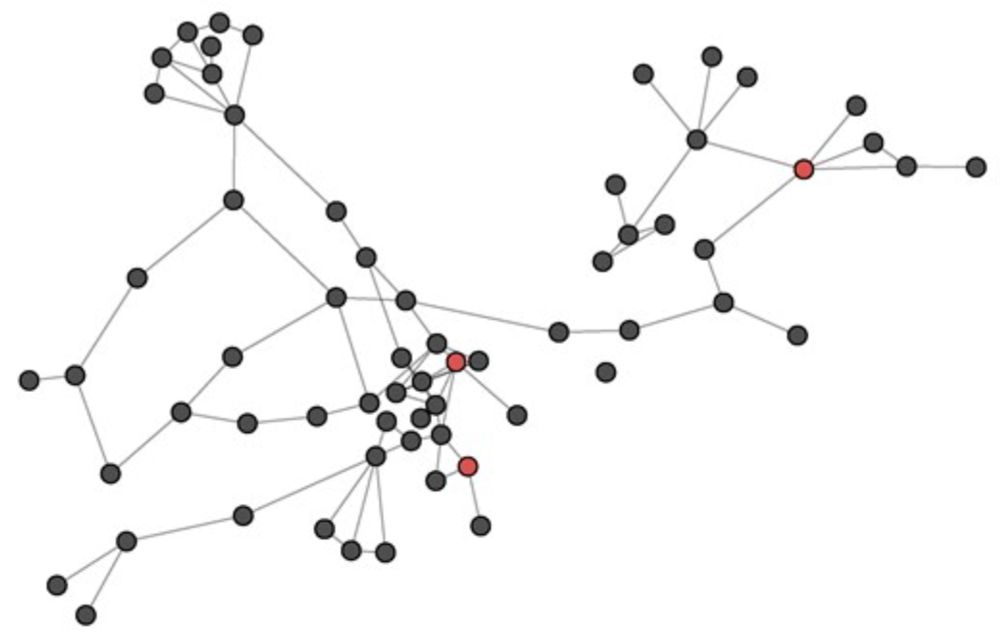
🤔New tools for network time series with an application to COVID-19 hospitalisations
Nason,Salnikov & Cortina-Borja present the following discussion paper (and you can find contributions to the discussion from other authors in the journal!) doi.org/10.1093/jrss...
14.11.2025 13:14 — 👍 0 🔁 0 💬 0 📌 0
Invited topic sessions
Planning is underway for the 2026 International Conference which will take place in Bournemouth from 7-10 September.
Submissions are now welcomed for invited topic sessions and workshops with a deadline of 21 November. Full details: rss.org.uk/training-eve...
14.11.2025 13:13 — 👍 1 🔁 0 💬 0 📌 0
Join Series A tomorrow for what promises to be a lively discussion meeting on Carl Morris' Finite Selection Model and its applications throughout experimental design
21.10.2025 09:52 — 👍 2 🔁 2 💬 0 📌 0
Associate editors are appointed for 4-year periods and usually have a workload of no more than 10-12 new papers per year.
If you would like to nominate yourself, please send a short note to Mike Elliott (again, details at the link) with a CV by 31st October 2025.
22.10.2025 09:26 — 👍 0 🔁 0 💬 0 📌 0
We are looking to cover these areas:
Latent variables
Multivariate modes
Machine learning
Network analysis
Causal inference
Missing data
Confidentiality
Spatial statistics
Categorical data analysis
Infectious disease
Genomics
Econometrics
Sports statistics
Business management
22.10.2025 09:26 — 👍 0 🔁 0 💬 1 📌 0
Associate editors sought for Series A
rss.org.uk/news-publication/news-publications/2025/member-callouts/associate-editors-sought-for-series-a/
We are looking for new editors for JRSSA! (details at the link)
We are seeking associate editors for a four-year term starting in January 2026.
22.10.2025 09:26 — 👍 0 🔁 0 💬 1 📌 0
At Hallam Conference Centre and online, more details on the link. *free and open to everyone*, and people can just listen to the authors and invited discussants, there's no need to make a comment.
20.10.2025 19:44 — 👍 0 🔁 0 💬 0 📌 0
Discussion paper meetings
We wanted to invite you to the next discussion paper meeting ‘Balanced and Robust Randomized Treatment Assignments: The Finite Selection Model for the Health Insurance Experiment and Beyond’ on October 22nd at 3 pm (UK time) (more details on link!)
rss.org.uk/training-eve...
20.10.2025 19:44 — 👍 0 🔁 0 💬 1 📌 1
Most recidivism studies focus on prisons and occurrence in a discrete framework. Little is known about jail recurrence & time-to-recidivism. Barone and Farcomeni use novel latent class multi-state quantile regression with cure fraction methods on >550,000 US (2020–2023) jail records
03.10.2025 13:00 — 👍 1 🔁 0 💬 1 📌 0

They also illustrate the application of the proposed tree-based MI method using data from a cellphone survey on COVID-19 vaccination in Uganda, which represents a subcohort sample drawn from the 2020 Uganda Population-based HIV Impact Assessment Survey.
03.10.2025 12:50 — 👍 0 🔁 0 💬 0 📌 0
In this paper, authors propose a Bayesian tree-based multiple imputation (MI) approach for estimating population means using the Phase II sample, where the parent survey was conducted using a complex survey design, and with simulations they test the advantages of the approach
03.10.2025 12:50 — 👍 0 🔁 0 💬 1 📌 0
Validate User
🆕Improving survey inference in two-phase designs using Bayesian machine learning
🪶Wang, Chen, et al with a very clear purpose in the title of their paper
doi.org/10.1093/jrss...
03.10.2025 12:50 — 👍 1 🔁 0 💬 1 📌 0

GitHub - yuzhouguangc/MTGCL
Contribute to yuzhouguangc/MTGCL development by creating an account on GitHub.
Empirical evaluations demonstrate that MTGCL outperforms existing graph contrastive learning models in classification accuracy across multiple time periods while maintaining competitive computational efficiency.
Data and Code are here : github.com/yuzhouguangc...
01.10.2025 14:53 — 👍 0 🔁 0 💬 0 📌 0

Fraud detection in blockchain networks presents unique challenges due to decentralized and pseudonymous nature of transactions. This study introduces a novel Multilayer Topology-Aware Graph Contrastive Learning (MTGCL) framework to detect fraudulent activity within the Ethereum transaction network
01.10.2025 14:53 — 👍 0 🔁 0 💬 1 📌 0


Their results suggest that overlooking latent homophily can lead to either underestimation or overestimation of causal peer influence, accompanied by considerable estimation uncertainty.
23.09.2025 09:02 — 👍 0 🔁 0 💬 0 📌 0
In this paper, authors address this challenge by leveraging latent locations inferred from the network to disentangle homophily from causal peer influence, and extend this approach to multiple networks by adopting a Bayesian hierarchical modelling framework
23.09.2025 09:02 — 👍 0 🔁 0 💬 1 📌 0
Researchers have focused on understanding how an individual’s behaviour is influenced by their peers behaviours. Identifying causal peer influence, is challenging due to confounding by homophily (people tend to connect with those who share similar characteristics)
23.09.2025 09:02 — 👍 0 🔁 0 💬 1 📌 0
Validate User
🆕A Bayesian approach to estimate causal peer influence accounting for latent network homophily
💡Um , Sweet and Adhikari show a framework to disentangle homophily from causal peer influence
doi.org/10.1093/jrss...
23.09.2025 09:02 — 👍 0 🔁 0 💬 1 📌 0


The temporal evolution of transmission rates in populations containing multiple types of individual is reconstructed via an appropriate dimension-reduction formulation driven by independent diffusion processes.
19.09.2025 08:12 — 👍 0 🔁 0 💬 1 📌 0
🆕Bayesian analysis of diffusion-driven multi-type epidemic models with application to COVID-19
💡Bouranis et al. develop a flexible Bayesian evidence synthesis approach to model age-specific transmission dynamics of COVID-19 based on daily death counts
19.09.2025 08:12 — 👍 1 🔁 0 💬 1 📌 0

Authors propose practical guidelines, and present the performance of the proposed estimators in numerical studies in two sets of real data: exit polls from the 19th South Korean election and public data collected from the Korean Survey of Household Finances and Living Conditions
19.09.2025 08:09 — 👍 1 🔁 0 💬 0 📌 0
The annual international conference of the Royal Statistical Society takes place each September for everyone interested in statistics and data science
The official account for Oxford Academic, featuring Oxford University Press's academic news and insights.
Professor of Statistics at Ca' Foscari University (Venice). Jazz Lover.
We're a membership body for statisticians and data professionals, promoting a world with data at the heart of understanding and decision-making.
Head of Data Science for Conflict Research CCEW @CISS
PhD in Statistics from LMU
Epi, stats, R, Linux & FOSS enthusiast. Trying to get into photography, so expect various badly taken photos of birds and landscapes.
Professor of Medical Statistics, University of Bristol, UK: meta-analysis methods, diagnostic test accuracy, screening evaluation, Bayesian modelling. Any views my own or my cats’.
Data Science, Statistics, Optimisation. Interest in Data-Driven Decision-making and Data Literacy. OU graduate. Data Governance/Data Protection Officer.
Executive Publisher at T&F. Publish journals. Walk dogs. ❤️ doughnuts & ice cream. #scicomm #physicalsciences #mathematics #statistics #datascience #history #science #STS
Statistician at University of Bristol | Bayesian, meta-analysis and evidence synthesis, #rstats
Analyst, Scientist, Misinformation Fighter, Debate Winner, Author
📖 Book: *The Polls Weren't Wrong* out now 👉 https://www.routledge.com/The-Polls-Werent-Wrong/Allen/p/book/9781032483023
Tech Librarian @ Downs-Jones Library
Member @ACM.org | @Howard.edu Data Science '25 Scholar 📈 | @Stanford.edu CIP '25 Alum 🌐 | ex-Smithsonian ☀️ | Texas Ex '24 🤘🏾
Interests: #AIBias #AncientBlackness #BlackDH
Website 🔗 : https://linktr.ee/marstay
📍ATX
Associate Professor, Mathematical Sciences, Bentley University, Massachusetts
https://faculty.bentley.edu/profile/mbhaduri
https://scholar.google.com/citations?user=gEYg0U4AAAAJ&hl=en
Associate Professor of Statistics at Università Cattolica del Sacro Cuore @unicatt.bsky.social. Doctor Europaeus 🇪🇺.
Mixture Models | Model-based clustering and classification | Health Analytics | Rstats
Website: http://andreacappozzo.rbind.io/
Statistician, an R enthusiast, official #statistics, non-probability samples, #rstats,
Political scientist University of South Carolina. Interests: business politics/corruption, Middle East, measurement, Bayesian statistics
The Bayesian Hitman: https://a.co/d/e4QmtKo
Website: www.robertkubinec.com
Global statistics and trends on diverse topics, from economy 📈 to environment 🌿, health 🏥 to technology 📱
Director of the Centre for Culture and Evolution, Brunel University London @brunelcce.bsky.social. President of the European Human Behaviour and Evolution Association @ehbea.bsky.social
https://www.rebeccasear.org/