A U.S. map titled “Winter Warming Since 1970 (°F)” shows nearly all regions shaded in red, representing rising winter temperatures. The Upper Midwest and Northeast stand out as the fastest-warming areas, with average winter increases between +4°F and +6°F. Source: NOAA/NCEI Climate at a Glance.
Winter isn't what it used to be.
It's actually the fastest-warming season for much of the U.S.
Since just 1970, winters (December - February) have warmed in 98% of 244 U.S. cities analyzed by 3.9°F on average.
Do you wanna build a snowman with few of the details? 🧵
12.11.2025 22:41 — 👍 17 🔁 17 💬 1 📌 2

Demain jeudi, le seuil de chaleur (25°C) pourrait gagner jusqu'à la région Centre alors que l'effet de foehn devrait se maintenir près des Pyrénées où les 30°C pourraient à nouveau être approchés.
12.11.2025 20:43 — 👍 28 🔁 18 💬 2 📌 7

🌡️ L'avez-vous senti ? Une douceur remarquable touche le pays ce mercredi, avec des températures 5 à 8 °C au-dessus des normales.
📈 Attention, le vent de Sud se renforce : on attend 120 à 130 km/h, localement plus, dans la nuit de jeudi à vendredi.
Le point complet 👉 meteofrance.com/actualites-e...
12.11.2025 16:18 — 👍 17 🔁 3 💬 0 📌 0

Les températures observées cette après-midi sont tout simplement délirantes : les 30°C ont été approchés mi-novembre. Je répète au cas où : mi-novembre.
Boosté par un vent de foehn dans un air surchauffé par le changement climatique, on a atteint 29.8°C à Trois-Villes et 29,5°C à Aicirits
1/2
12.11.2025 19:13 — 👍 407 🔁 258 💬 19 📌 16

Breaking News!
It appears that the UN is now using the method Richard Betts proposed and I use to compute the "long-term" global temperature with respect to the Paris Agreement. Which means the planet will be breaking 1.5C in 2026 or 2027 at the latest.
www.theguardian.com/environment/...
12.11.2025 14:29 — 👍 137 🔁 44 💬 9 📌 2

🥶 Météo France : descente d'#air #polaire imminente ? Découvrez à partir de quelle date !
Marc Hay ⤵️
https://www.tameteo.com/actualites/previsions/meteo-france-premiere-offensive-de-l-hiver-decouvrez-a-partir-de-quelle-date-le-temps-pourrait-totalement-changer-froid-air-polaire.html
12.11.2025 15:05 — 👍 0 🔁 1 💬 0 📌 0

‼️EXTRAORDINARY DAY: 30 DEGREES IN FRANCE
One of the most insane events Europe has ever lived
29.8 Trois Villes HOTTEST NOVEMBER DAY IN FRENCH HISTORY
29.3 Oloron
29.2 Lanne en Baretous
20 stations >27C !
SPAIN 29.4 Granada
Next days
THOUSANDS OF RECORDS allover Europe except Central Mediterranean
12.11.2025 15:19 — 👍 36 🔁 32 💬 1 📌 7
"planetary destruction" ? on en est encore là ? mais la planète va très bien et continuera à aller très bien.ce sont les espèces vivantes qui sont en danger et en ce qui nous concerne,nos sociétés et notre civilisation. au bout de 30 cop on en est encore à vouloir sauver la planète.on a rien compris
12.11.2025 00:10 — 👍 0 🔁 0 💬 0 📌 0

Line graph time series of monthly mean surface temperature anomalies for the Antarctic region only. Every month is shown from 1940 to 2025. There is a long-term warming trend in all months of the year, but less obvious than the other regions.
Average temperature departures by month in the #Antarctic since the year 1940.
Data from @copernicusecmwf.bsky.social ERA5 reanalysis.
11.11.2025 23:57 — 👍 95 🔁 41 💬 7 📌 6
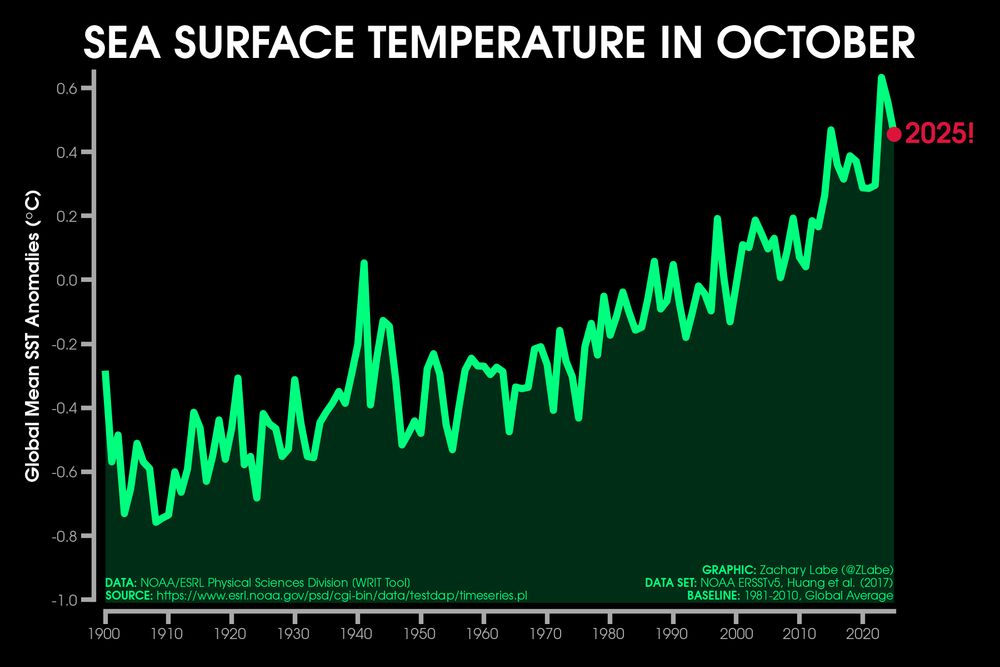
Green line graph time series of average sea surface temperature anomalies for each October from 1900 through 2025. There is large interannual variability, but an overall long-term increasing trend. Anomalies are computed relative to a 1981-2010 baseline.
Last month was the 4th warmest October on record for the average global sea surface temperature... 🌊
Graphic using NOAA ERSSTv5 data. Methods described in doi.org/10.1175/JCLI....
11.11.2025 14:31 — 👍 75 🔁 21 💬 0 📌 1

Breaking News!
Code UFB!!!
The three-year running mean for the global surface temperature anomaly now exceeds 1.50°C over the pre-industrial baseline, as of November 8, 2025.
Are you there, COP 30? It's me, the Paris Agreement.
10.11.2025 17:02 — 👍 304 🔁 149 💬 21 📌 17
The past 3-years were on average +1.5°C, while the Relative Oceanic Niño Index was on average -0.19.
The Paris agreement is dead and buried.
What impact will this have on the negotiations in Belém at COP30?
11.11.2025 00:08 — 👍 42 🔁 14 💬 2 📌 4

Four polar stereographic maps showing Arctic near-surface air temperature anomalies for the month of November in 1985-1994, 1995-2004, 2005-2014, and 2015-2024. Most all areas are observing long-term warming, which is largest along the Eurasian coast.
Impossible to ignore what’s happening to #Arctic temperatures in the month of November...
Data from @copernicusecmwf.bsky.social ERA5 reanalysis.
11.11.2025 00:10 — 👍 187 🔁 98 💬 4 📌 4
In the most predictable development ever, Mike Johnson is not committing to hold a House vote on ACA subsidies
10.11.2025 22:19 — 👍 24457 🔁 7821 💬 2408 📌 1469

Remarkable.
Decades long records falling tonight.
Tampa's is 133 years old. Lakeland could beat their daily record by 10 degrees!! and have their earliest coldest day on record!
Sub-freezing Nature Coast with freeze expected!
10.11.2025 20:54 — 👍 53 🔁 15 💬 3 📌 1

Polar stereographic map of 2-m air temperature anomalies in the Antarctic for October 2025. Red shading is shown for warmer anomalies, and blue shading is shown for colder anomalies. There is a sharp gradient in temperature anomalies across the continent. Anomalies are calculated relative to a 1981-2010 baseline.
Here is a map view of the record high temperatures in October 2025 across the #Antarctic. Compare this blob of anomalies greater than 5°C with the Arctic from my earlier post. Yikes!
Data from doi.org/10.24381/cds... using a 1981-2010 reference period.
10.11.2025 17:56 — 👍 93 🔁 49 💬 5 📌 3
U.S. airlines' daily cancellations top 2,000 for first time since shutdown cuts began, also more than 7,000 delays Sunday. - AP
09.11.2025 21:08 — 👍 15 🔁 8 💬 0 📌 0

Green line graph time series of average sea surface temperature anomalies for each October from 1850 through 2025 for only the midlatitude region of the North Pacific Ocean. There is large interannual variability, but an overall long-term increasing trend. Anomalies are computed relative to a 1981-2010 baseline. 2025 is a record high.
Record high ocean temperatures continued across the North Pacific in October 2025, with recent warming really amplifying since the early 2000s.
This graph shows the average for a band across the midlatitudes for every October from 1854-2025 using
NOAA ERSSTv5 data (psl.noaa.gov/data/gridded...).
09.11.2025 17:43 — 👍 160 🔁 84 💬 4 📌 6
Emerging: Video shows massive fire at building in Utah County, Utah.
09.11.2025 17:57 — 👍 17 🔁 4 💬 0 📌 0

Polar stereographic map showing 2-m air temperature anomalies in October 2025 for the Arctic Circle with red shading for warmer anomalies and blue shading for colder anomalies. Most areas are warmer than average. The baseline is a 1981-2010 reference period using ERA5 data.
Here's a look at the extent of the "warmth" across the #Arctic in October. This map uses my normal anomaly scaling for each month, but it clearly doesn't work for something this extreme.
Data from doi.org/10.24381/cds...
09.11.2025 14:03 — 👍 210 🔁 116 💬 8 📌 9

For those enjoying the race to the bottom, Arctic sea-ice extent is second lowest on record for the date, as of Nov. 8, 2025, just over 100k square kilometers above the record low, set in 2016.
<personal pronoun> <verb> f&%king <past participle>.
09.11.2025 14:53 — 👍 103 🔁 29 💬 4 📌 1

If our years ran from November to October, 2025 would be the second warmest year on record.
Probably in >100,000 years and potentially much longer.
Sea Surface Temperatures are now likely already higher than during the Eemian warm period, when global sea levels were ~7.5m higher!
08.11.2025 15:34 — 👍 54 🔁 22 💬 1 📌 1

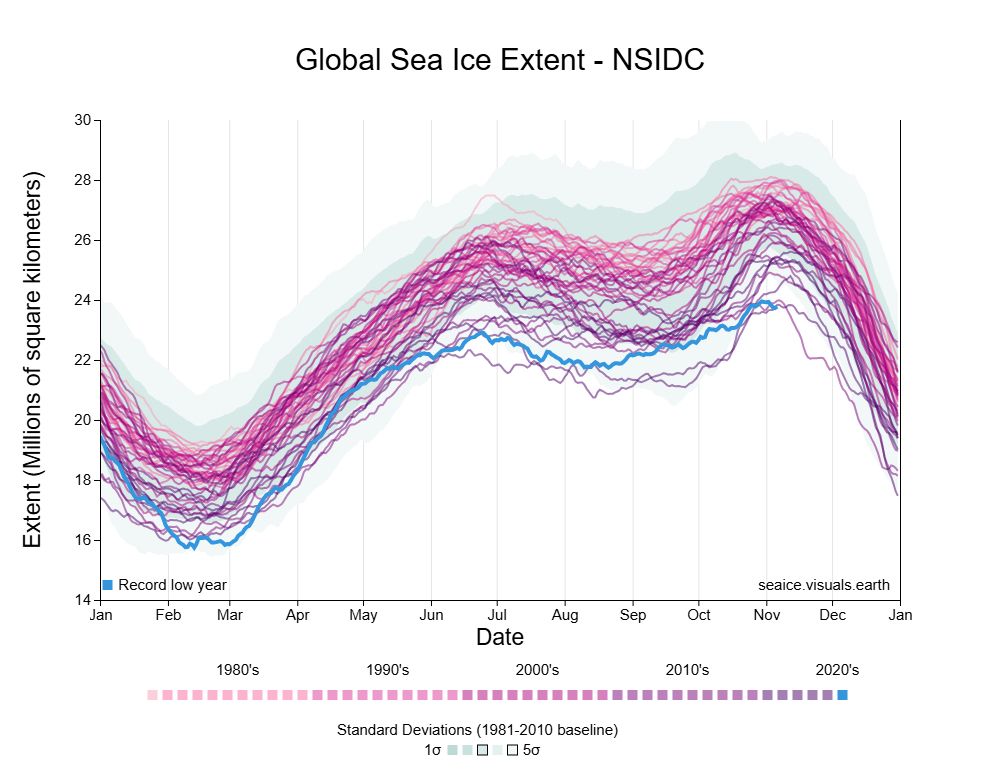
Lowest global sea ice extent for November 6 on record.
08.11.2025 03:28 — 👍 35 🔁 24 💬 1 📌 2


Ignoring the tropics because of El Niño/La Niña, the past 12 months show record Sea Surface Temperatures for both hemispheres.
And the acceleration of warming over the Northern Hemisphere is painfully obvious:
08.11.2025 23:04 — 👍 54 🔁 21 💬 1 📌 0

Line graph time series of 2-m air temperature anomalies for the Arctic in every October from 1979 to 2025. There is a long-term warming trend, and 2025 is the warmest on record in this time series. Data is from ERA5 with a 1981-2010 climate baseline used for calculating the anomalies.
It's not every day that both poles set new monthly temperature records (see my earlier post). Last month also observed the warmest October on record for the #Arctic Circle. Not great!!
Data provided by doi.org/10.24381/cds....
08.11.2025 14:07 — 👍 144 🔁 79 💬 3 📌 1

As we alarmingly wrote "We are hurtling toward climate chaos" in our new State of the Climate Report which just came out. We may be on the path of a hothouse Earth trajectory as shown in this figure. Read the full report: doi.org/10.1093/bios...
08.11.2025 00:44 — 👍 35 🔁 19 💬 4 📌 1
Ken White, criminal defense attorney and First Amendment litigator. Co-host of Serious Trouble podcast and writer at The Popehat Report. Opinions here are my own.
Signal: KenWhite.1969
Journalists (Ed Krassenstein & Brian Krassenstein) - Fighting hate, lies and tackling conspiracy theories.
IMPORTANT Substack Updates: http://krassencast.com
Compte officiel de @meteofrance.com pour la Corse, Provence-Alpes-Côte-d'Azur et Languedoc-Roussillon.
Restez informés, suivez la vigilance sur vigilance.meteofrance.fr
Reliable & fast news provider, collaborator of @bnonews.com.
Analyse l'atmosphère dans ses moindres détails
Décryptage Météo chaque lundi à 18h sur YouTube
Direct Météo chaque 1er jeudi du mois à 21h sur YouTube
Breaking news of climate change events from around the globe
👨🔬 Journaliste @leparisien.fr, chef de service adjoint et (toujours !) reporter sur les sujets santé/sciences et météo/climat.
📈 Je parle (toujours) de #Covid19, mais aussi (et surtout) de beaucoup d'autres choses.
Real time Updates, Forecasts, & Analysis across the world | Live Storm Coverages & Reports | DM us your photos & videos or for credit/removal
Chasseur d'orages. Vice-président et prévisionniste de l'Association Météo Centre - Val de Loire. Photographies. Infos météo, sciences, environnement, climat et astronomie.
19yrs 🎂 . Wx my ❤️⛈️. Redactor for MeteoContact. Dream of being scientist researcher. L1 at Sorbonne University🎓 . Climate Skeptics my ennemies. Born at 380.95ppm🌻
IG : mrpropagande
X : MrPropagande
Mastodon : mrpropagande
instagram.com/mrpropagande/
instagram.com/mrpropagande_backup/
x.com/MrPropagande
piaille.fr/@mrpropagande
Suivez la #météo en France, ici et sur http://tameteo.com. Les actualités et les prévisions par des experts.📲 APP "Météo 14 jours".
Passion pour la #météorologie.
Data journalist with CBC Calgary. Views my own and subject to change, especially in light of new evidence. 📧 robson.fletcher@cbc.ca
Salut mes p'tits Mastoufoux, Gros Lucky sur Mastodon. A suivre #climat #biodiversité #météo #ouragan #banquises #Newsclimat
né en 336ppm, ingé FPT, parle de […]
[bridged from https://piaille.fr/@LuckyetVous on the fediverse by https://fed.brid.gy/ ]
This is an automated bot which toots out new wildfires reported by WatchDuty (app.watchduty.org). Not run by WatchDuty. Created by @ai6yr
[bridged from https://m.ai6yr.org/@watchduty_bot on the fediverse by https://fed.brid.gy/ ]
Nos nouvelles et contenus les plus populaires pour ne rien manquer de l'actualité.
🔗 https://ici.radio-canada.ca/info
Ex ingénieur Météo France, développeur du site meteolab.fr. Modèles météo, radar, observations, climatologie, prévisions météo.
Association à but non lucratif, pour vous informer des conditions #météo dans les #pyrenees l’#andorra et le #sudouest 👉 synthèse quotidienne
Conception Bioclimatique & Climatologie Urbaine | Docteur en Urbanisme | Spécialiste #microclimat, #ilotdechaleur et #adaptation | clementgaillard.com