The minute I receive an invoice/bill I see that amount of money as no longer being mine so I both agree with and applaud your 8 minute average :)
01.08.2025 10:55 — 👍 0 🔁 0 💬 0 📌 0
Tomorrow I will post out my latest newsletter to subscribers. This will be a (belated) combined view of the 50 best things I encountered during May AND June, as I had to skip a month due to work and non-work stuff.
To subscribe or check out all previous issues visit visualisingdata.com/newsletter/
29.07.2025 08:18 — 👍 3 🔁 1 💬 0 📌 0
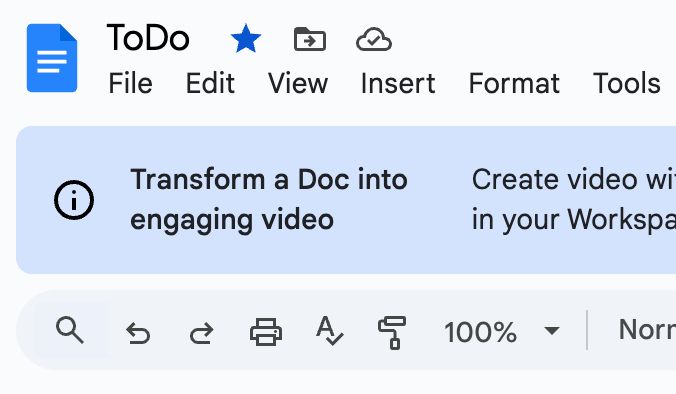
The alert says 'Transform a Doc into engaging video'. The doc in question is my ToDo list.
Going to cancel this morning's meetings to immerse myself in the engaging video I've being encouraged to create about my ToDo list.
(cc @chezvoila.com)
24.07.2025 07:58 — 👍 18 🔁 0 💬 2 📌 0
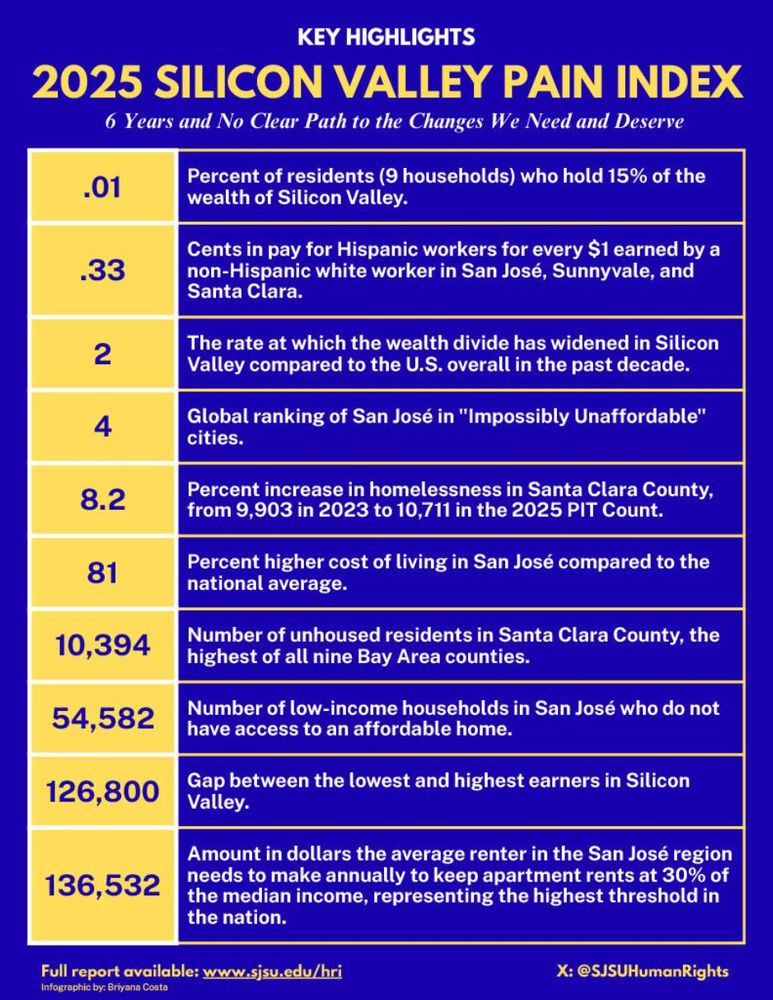
Lots of visual-treatment potential in this statistically packed report ‘Silicon Valley Pain Index’ www.sjsu.edu/hri/policy-p...
21.07.2025 21:54 — 👍 2 🔁 0 💬 0 📌 0
As expected, this was a delightful conversation with Anna!
The episode will be published at the start of September when the distractions of July/August pass.
21.07.2025 16:41 — 👍 0 🔁 1 💬 0 📌 0
🎙️ Really looking forward to this chat with Andy next week!
Stay tuned for insights and anecdotes about #dataviz & climate science 🌍📈
In the meantime go browse through all 5 past seasons of his podcast: a real treasure of content & inspirational conversations ➡️ visualisingdata.com/podcast/
17.07.2025 15:13 — 👍 7 🔁 3 💬 0 📌 0
A pleasure, and I'm so glad you like it! I have a couple more in stock here etsy.me/3UcIhXE
16.07.2025 12:09 — 👍 17 🔁 4 💬 1 📌 1
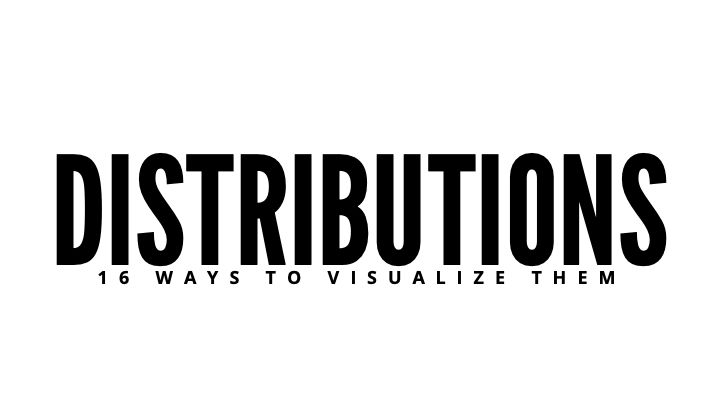
DISTRIBUTIONS: 16 ways to visualize them
Since you folks seem to like lengthy threads, let's look at visualizing distributions. I'll visualize one data set 16 ways and give some other examples of each chart type. #dataViz
16.07.2025 13:19 — 👍 68 🔁 17 💬 3 📌 4
100%. A charticulator extension to PowerBI and an embedded Lincoln within Illustrator would have both been immensely welcome
16.07.2025 17:27 — 👍 2 🔁 0 💬 0 📌 0
Congrats Chris that sounds a brilliant opportunity and nobody better to bring the stories to a wider audience within and outside academia in times like these. All the best
16.07.2025 17:25 — 👍 1 🔁 0 💬 1 📌 0
After a few month's gap to help my focus on the juggling act of keeping business ticking over during a move across the sea, next week I will be resuming 'Explore Explain' episode recordings. My next guest is the magnificent Anna Lombardi, and we'll be exploring this vast piece of visual excellence 👇
16.07.2025 14:18 — 👍 16 🔁 1 💬 1 📌 1
Too kind sir, I’m just thankful that these nice people are receptive to hear from me!
10.07.2025 18:49 — 👍 0 🔁 0 💬 0 📌 0

The Adelphi, HQ of The Economist
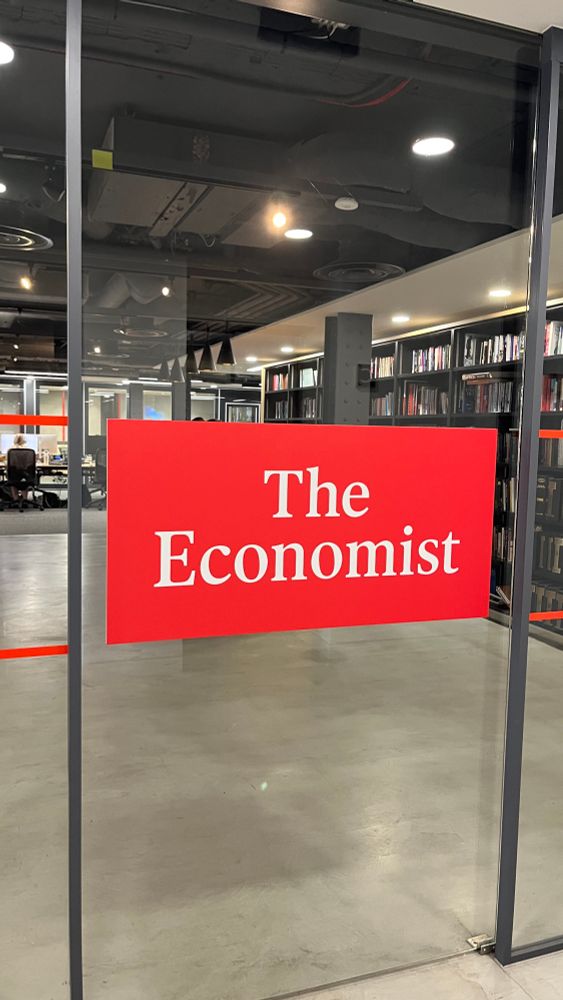
The Adelphi, HQ of The Economist
Followed by this afternoon’s
10.07.2025 18:08 — 👍 6 🔁 0 💬 1 📌 0
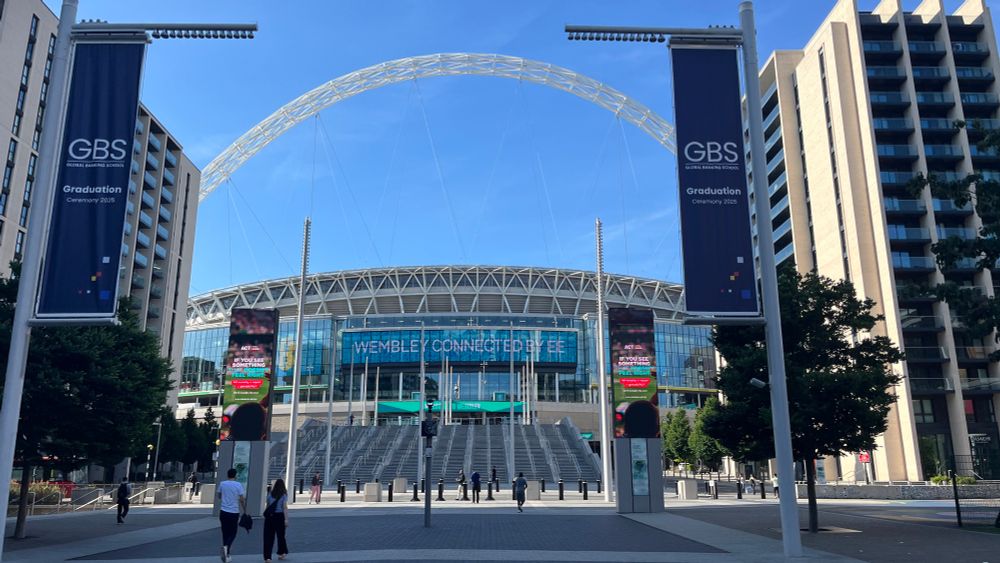
Wembley stadium from the outside
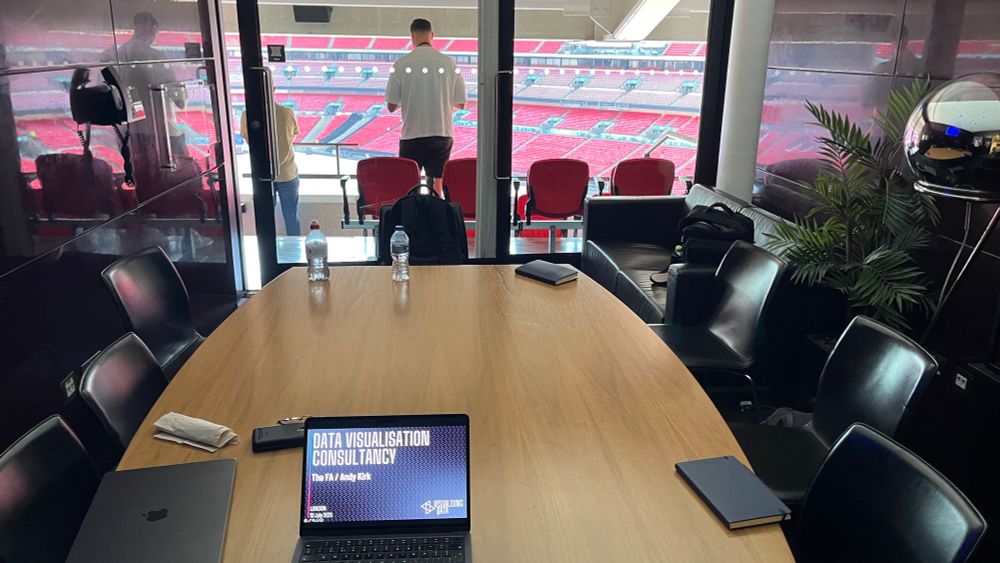
Exec box meeting space at Wembley
This morning’s workplace
10.07.2025 09:33 — 👍 23 🔁 0 💬 1 📌 0
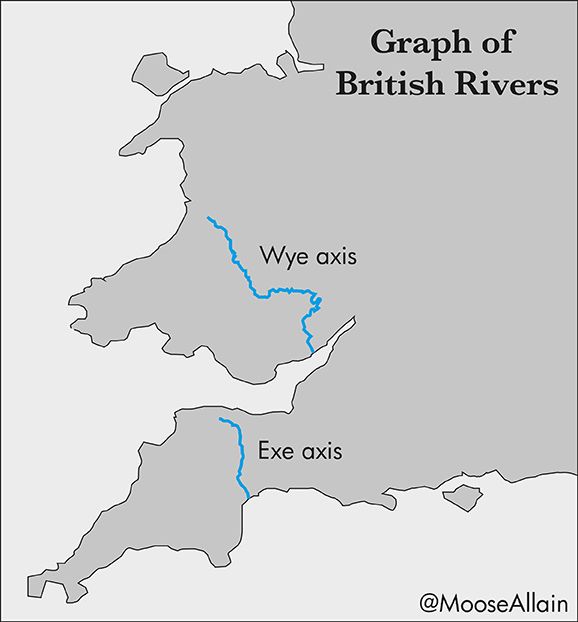
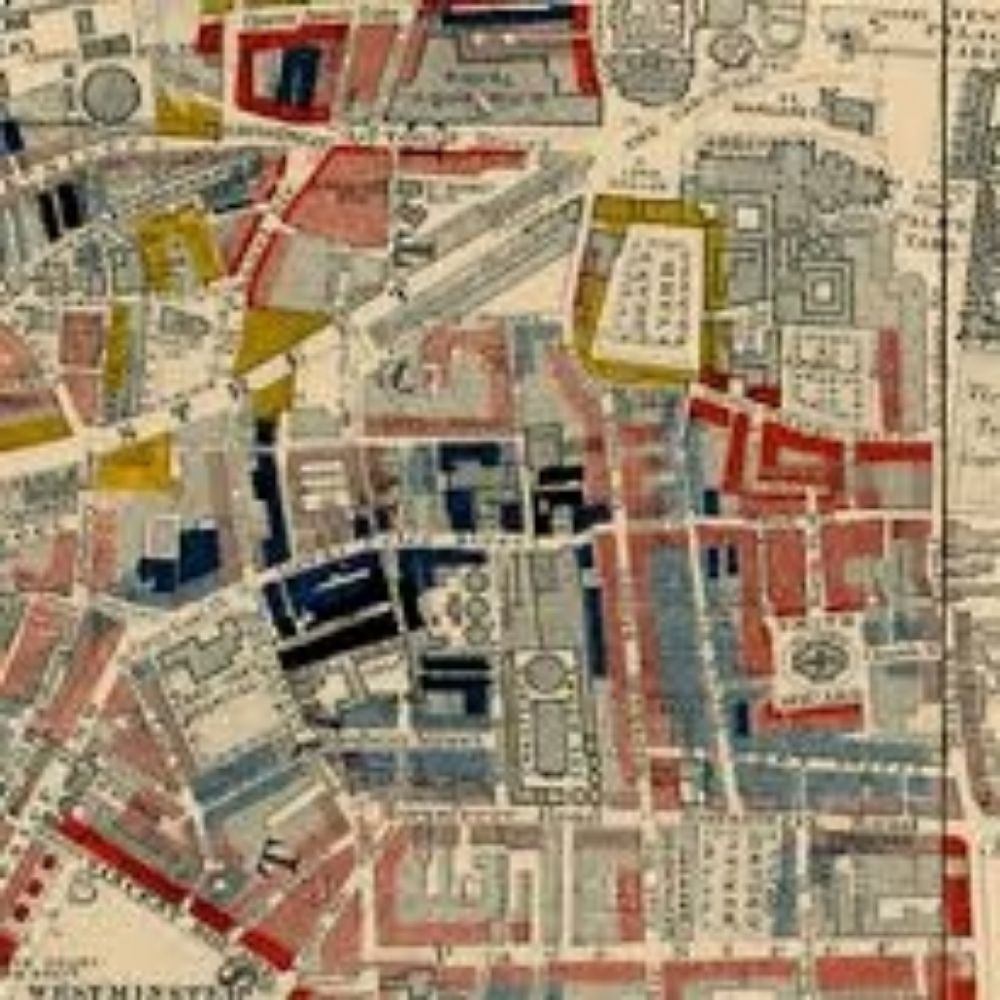
A map showing South West England and Wales, labelled "Graph of British Rivers". Two river courses are shown, labelled 'Wye axis' and 'Exe axis'.
Does anyone read these descriptions, or am I wasting my time?
Graph of British Rivers
05.07.2025 12:33 — 👍 2991 🔁 664 💬 87 📌 37
Now to immerse myself in reading some of the endless tributes and trying to process this awful loss of Diogo Jota who was an absolute belter of a player and who seemed a brilliant fella. So sad. And his brother too. His poor family, good grief.
03.07.2025 18:50 — 👍 6 🔁 0 💬 0 📌 0

Devastating news about Diogo Jota
03.07.2025 08:58 — 👍 7 🔁 3 💬 1 📌 0
If you're in London this Wednesday (2nd) and fancy a couple of drinks with me and some data viz training attendees we'll be in Strongroom Bar on Curtain Road (www.strongroombar.com) from 5:30 onwards.
30.06.2025 09:26 — 👍 4 🔁 2 💬 0 📌 0
That’s a pretty good basis
01.07.2025 16:10 — 👍 1 🔁 0 💬 0 📌 0
If you're in London this Wednesday (2nd) and fancy a couple of drinks with me and some data viz training attendees we'll be in Strongroom Bar on Curtain Road (www.strongroombar.com) from 5:30 onwards.
30.06.2025 09:26 — 👍 4 🔁 2 💬 0 📌 0
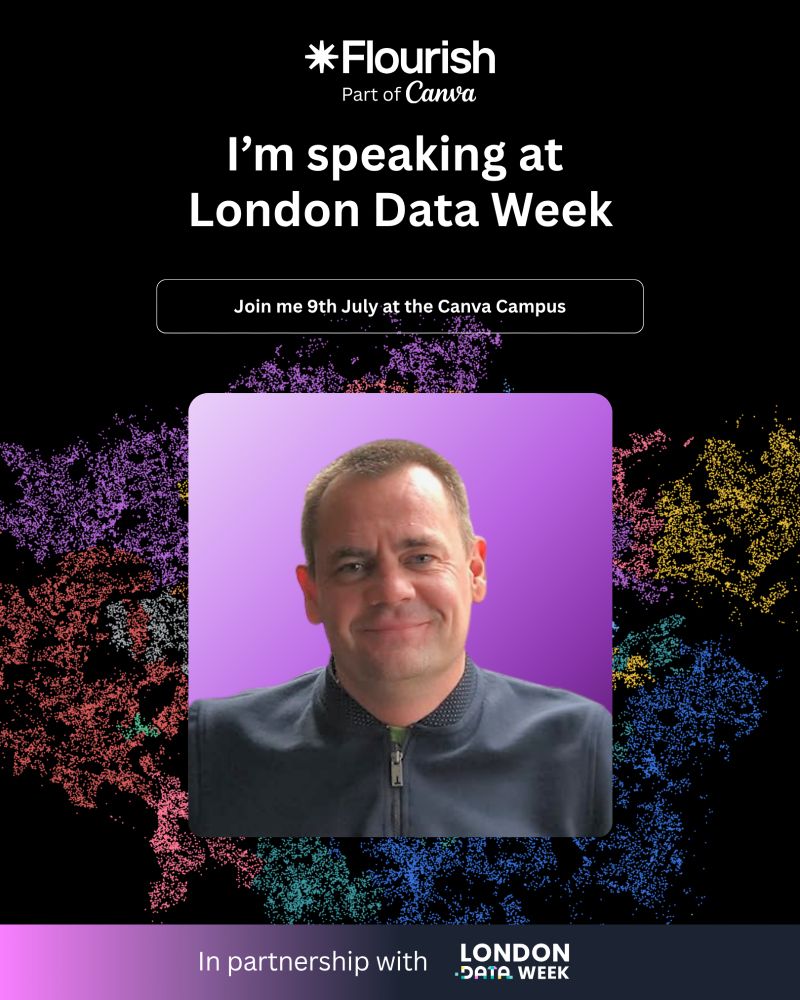
On July 9th I'll be at the 'London Data Week' event hosted by Flourish on a panel exploring 'The stories that break through the noise' - what, why, how, and when does data actually move us to feel something and to do something.
Hope to see some of you there!
www.eventbrite.co.uk/e/data-that-...
30.06.2025 08:45 — 👍 6 🔁 3 💬 0 📌 0
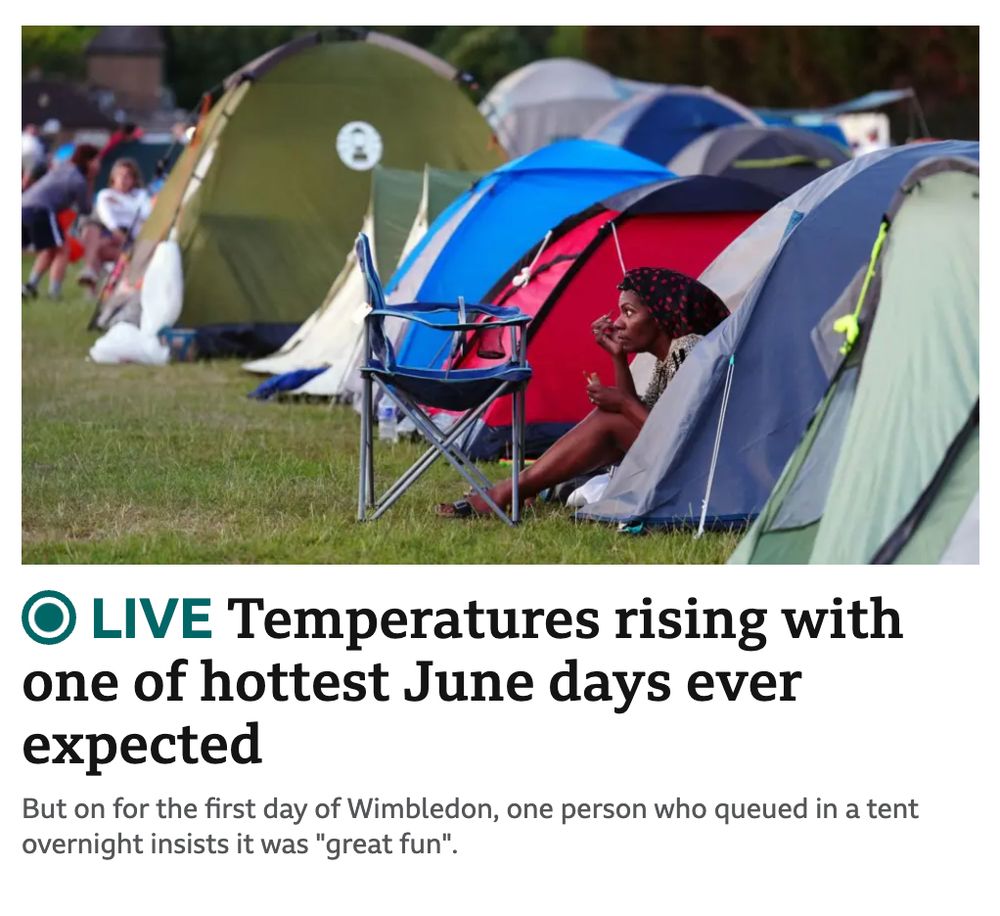
Caption reads: Temperatures rising with one of hottest June days ever expected... But on for the first day of Wimbledon, one person who queued in a tent overnight insists it was "great fun".
On one hand it is predicted today will be one of the hottest June days ever, but on the other hand one person who queued for Wimbledon in a tent overnight insists it was "great fun", so its important to keep a balance in the coverage...
30.06.2025 08:09 — 👍 7 🔁 0 💬 1 📌 0

VizChitra 2025: India's first community-driven Data Visualization conference
A space to connect and create with data
If I wasn’t extremely out-of-office this week I’d be tuning into @vizchitra.bsky.social ‘India's first community-driven Data Visualization conference’ via one of their generous virtual passes. For those of you in-office I’d strongly recommend taking a look hasgeek.com/VizChitra/20...
25.06.2025 17:03 — 👍 3 🔁 0 💬 0 📌 0
Data visualization design, Tokyo, Japan.
Tokyo Metropolitan University
lab.sugimototatsuo.com
Data visualisation at Ember
Data journalist at Axios, embroiderer at my couch
Data: erdavis.com
Embroidery: instagram.com/threadandfur
Journalist, New York Times Upshot
Bylines: nytimes.com/by/aatish-bhatia
Website: aatishb.com
Previously:
Freelance science writer
Associate director, Princeton
Physics Ph.D., Rutgers
Information designer @ Studio Interrobang #dataviz #charts #maps | Turning data into immersive experiences to spark conversations
Interactive visual journalist @ The Economist
Retired Prof Computer Science, Univ of Maryland, Working on HCI, Info Visualization, and Human-Centered AI
Graphics at @propublica.org. Formerly @washingtonpost.com and @miamiherald.com. The more you use it, the more it works.
Tips: chris.alcantara@propublica.org
Reporter @nytimes.com. I cover the ~internet~ and report on digital influence operations, AI, far-right politics and lots more
Design and Development Studio for Human Data Interaction.
Infographics, data journalism, GIS/cartography, teaching and cornball humor. NYCer in the PNW. www.geoffmcghee.com
datadesign experiments
| Montréal | Paris | Quimper
https://www.instagram.com/andrea__data/
We're on a mission to elevate how business communicates and understands data, tackling complex problems with innovative solutions. JasonForrestAgency.com
Doctor en ingeniería que escribe en El País. He publicado el libro «Piensa claro» 🧠 https://kiko.llaneras.es/piensa-claro
Data vis events in London bringing together journalists, designers, developers.
Sign up to our mailing list at subscribepage.io/OLX7qp
Information design technologist with deep expertise in data visualization.
https://www.wesleygrubbs.com
Maker of Inflatacart
https://apps.apple.com/us/app/inflatacart/id6740125695
Avid rock climber and alpinist. Always learning.
Science graphics at NY Times