How to halve the EU's fossil import reliance?
Electrification 🤝 homegrown clean power.
⚡🔒 New analysis out today: ember-energy.org/latest-insig...

@laorso.bsky.social
Data visualisation at Ember
How to halve the EU's fossil import reliance?
Electrification 🤝 homegrown clean power.
⚡🔒 New analysis out today: ember-energy.org/latest-insig...

🇪🇸 Spain has some of the lowest wholesale electricity prices in Europe.
Why? It's largely down to the country’s strong solar and wind growth! Wind and solar has reduced the influence of expensive coal and gas power on the electricity market.
ember-energy.org/latest-insig...
🎉 5️⃣ 🎂 Five years in, Ember’s vision of an electric future is becoming reality.
Born in 2020 to empower decisionmakers with open data, Ember has fast-tracked the transition 💡
Today, solar is surging, fossils are entering terminal decline and the electrotech revolution is here ⚡️☀️
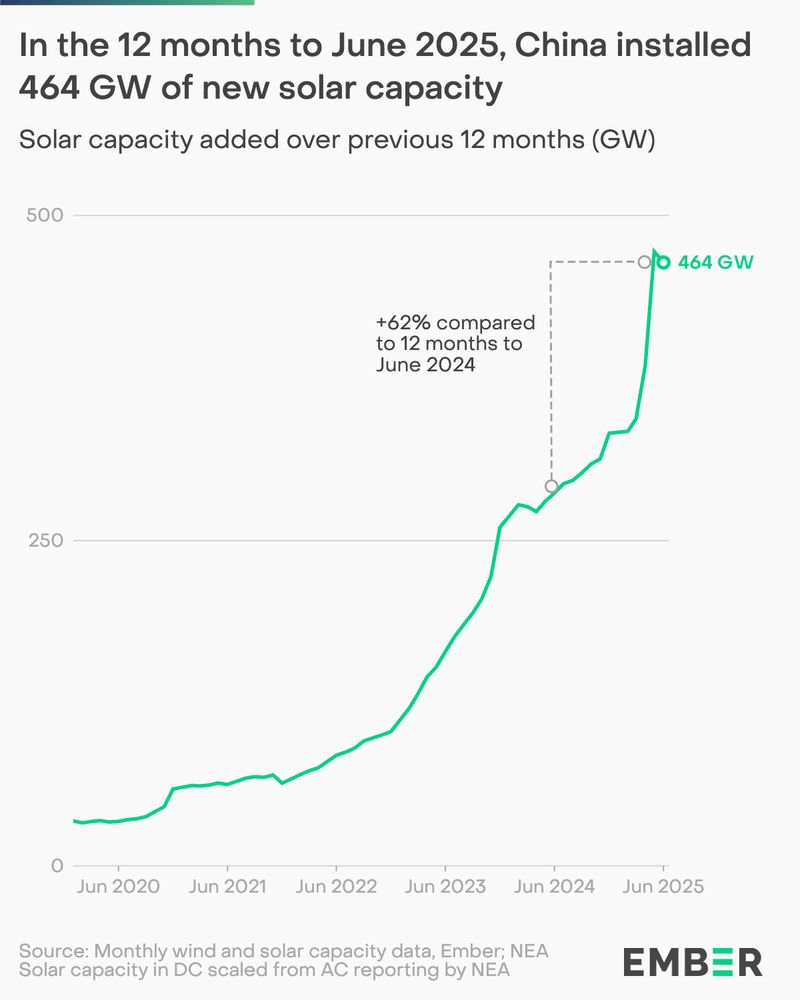
🇨🇳 China installed 464 GW of solar capacity in the 12 months to June☀️
That's more than the total EU solar capacity as of 2024 (338 GW) and DOUBLE the total US solar capacity (229 GW).
...in just 12 months
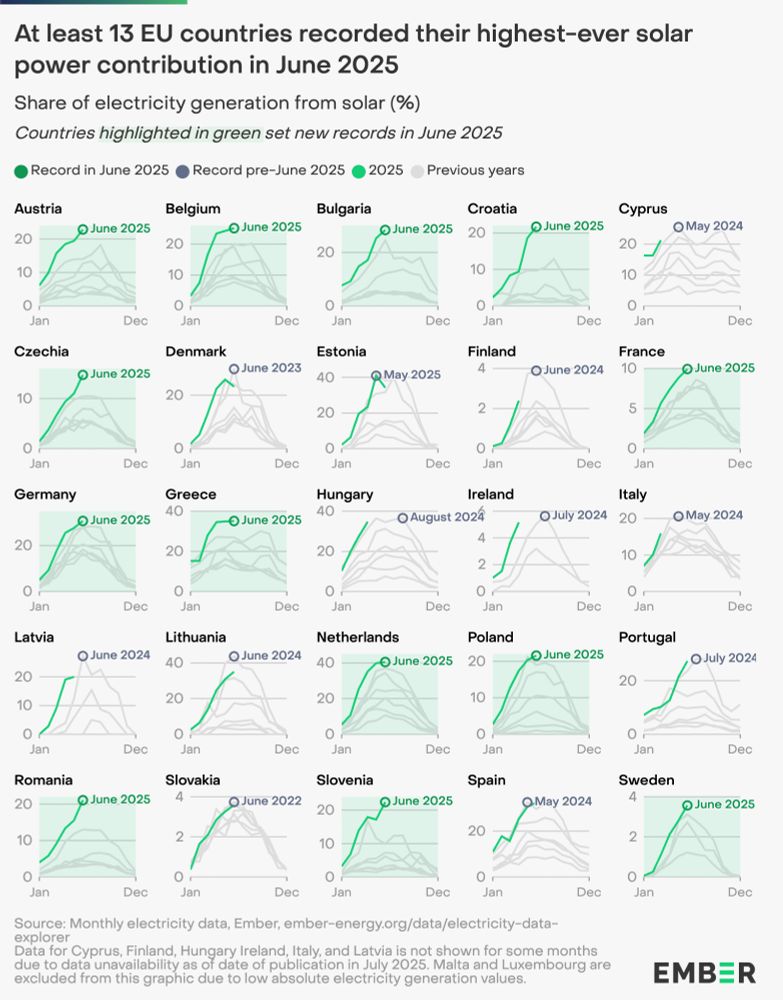
Solar became the top power source in the EU for the first time ever in June 2025 ☀️
At least 13 EU countries beat their previous record share of solar in the electricity mix 👏 helping power systems grapple with high demand from ongoing heatwaves.
@ember-energy.org
ember-energy.org/latest-insig...

On one day alone, the heatwave in Europe may have impacted up to 15% of France’s nuclear capacity. Just one nuclear facility was running without capacity reductions.
Rapid turnaround on this analysis from my colleagues at @ember-energy.org
ember-energy.org/latest-insig...

An interactive 3D chart plotting NBA game point differences between teams across one season. Rearranging the camera results in different views with different focal points, like dates and periods. Made by Vinicius Sueiro, reposted by We Do Data.

An interactive area chart visualizing marriage status percentages in Germany across different age groups from 1990 to 2023. Especially young marriages have declined over the years, while older people today are less likely to be widowed than before 2000. Published by Die Zeit.

A world map centered on the north pole, showing flight paths of U.S. planes on their mission to attack Iran. Annotations explain individual roles and specific targets. Published by The New York Times.

A circular diagram showing the status of energy transition targets for member states of the European Union, color coded for different sectors. Published by Ember.
Another week of warfare in the Middle East, rising temperatures and heatwaves, and energy reports from all over the world — all this and more in the new Data Vis Dispatch! 📊
www.datawrapper.de/blog/data-vi...
^ A grainy screenshot because the mobile version is so great!
05.06.2025 16:30 — 👍 1 🔁 0 💬 0 📌 0
NEW | Clean power record in Germany 🇩🇪⚡️
In May, wind and solar produced more than half of Germany's power for the first time, accounting for 56.5%!
This surpasses the the previous record of 49.3% set in July 2023.
From the latest @ember-energy.org data

Same data, more power! @ember-energy.org’s Electricity Data Explorer has a new look and so many new features.
Impressive solar generation looking even more beautiful today! 📈
ember-energy.org/data/electri...
🚨 NEW RECORD | Solar OVERTOOK nuclear for the first time globally ☀️
Solar power has TRIPLED in the last five years, from 79 TWh in April 2020 ➡️ to 233 TWh in April 2025 📈⚡️
For more records, check Ember’s electricity data explorer which has new data every month 🔎
ember-energy.org/dat...

NEW | Mexico’s goal to reach 45% renewable electricity by 2030 would avoid $1.6 Bn in annual gas imports from the US and create 434K jobs 🇲🇽
It would also deliver 10x the fuel cost savings and nearly 2x more jobs compared to the alternative 36% pathway.
ember-energy.org/lat...

NEW | Today we launched a new @ember-energy.org dataset tracking monthly wind and solar capacity.
They're the fastest-growing energy sources ⚡
Solar, especially, is booming everywhere ☀️
Initially, we're covering 25 countries – together making up over 90% of global solar & wind capacity.
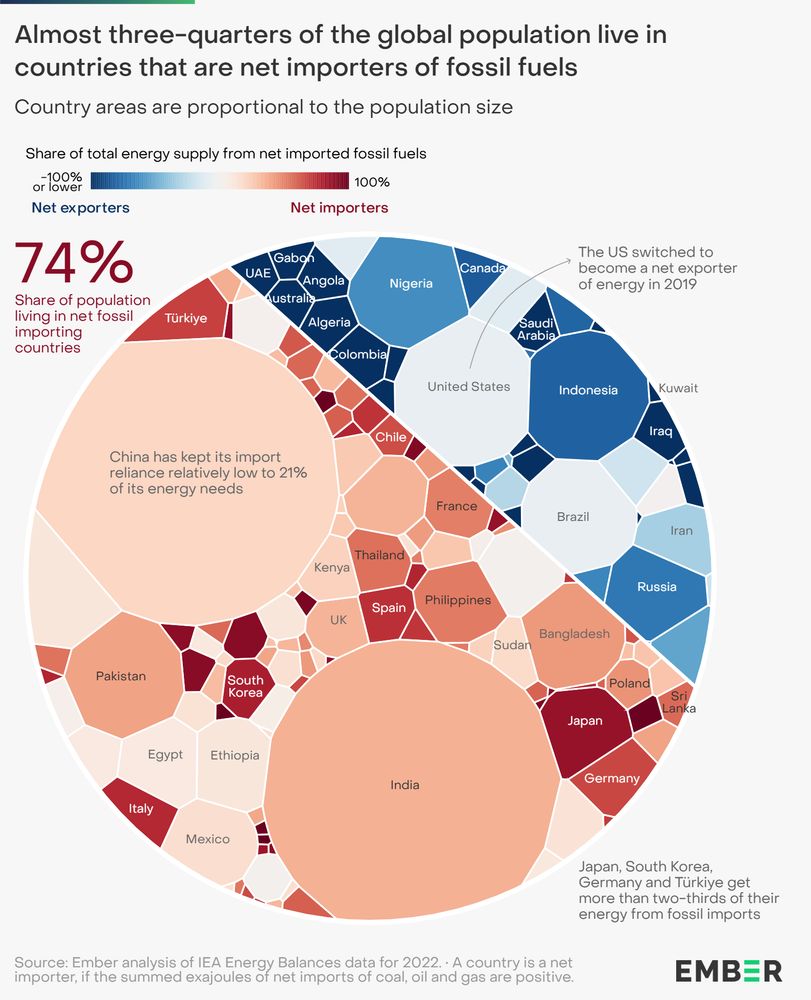
NEW | 74% of the global population lives in countries that are net importers of fossil fuels.
12 countries supply 80% of net fossil fuel exports - with rising trade uncertainty, this puts much of the world at risk.
1/8 🧵
ember-energy.org/lat...

Another chart showing the rise of solar power worldwide ☀️
📏 Larger size = more solar generation
🔸 Darker colour = higher share of solar in country’s electricity mix
ember-energy.org/latest-insig...

Global solar generation is now large enough to power ALL of India ⚡
As electricity demand grows, new solar helps avoid fossil fuels and power sector emissions.
ember-energy.org/lat...
#GER2025

New research!! Clean power is stepping up, and provided more than 40% of global power in 2024
@ember-energy.org Global Electricity Review is out today
Here are some of my favourite takeaways about why solar was the real star of the show this year 🌞🌞🌞 🧵
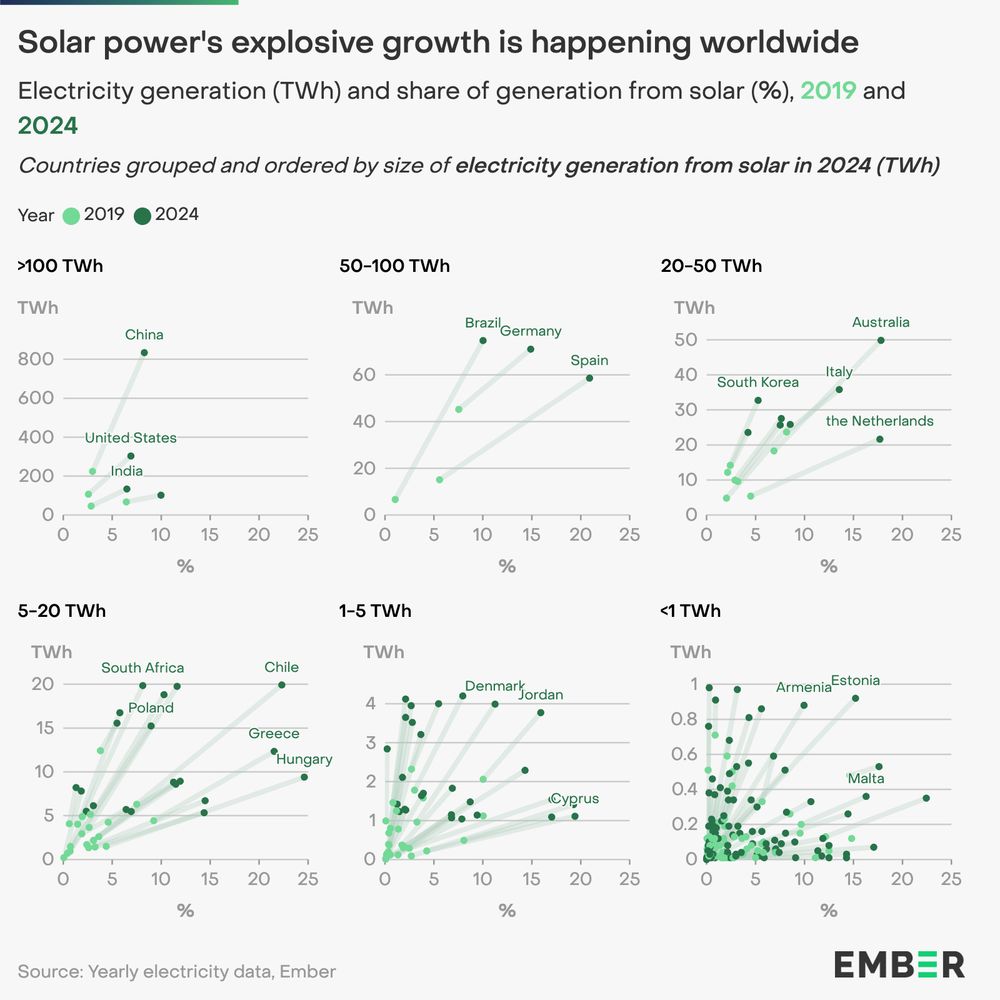
A series of six scatter plots showing global solar power growth from 2019 to 2024. The plots compare electricity generation from solar (in terawatt-hours, TWh) and its share of total electricity generation (percentage) across different countries. Countries are grouped based on their total solar electricity generation in 2024. >100 TWh: China, the United States, and India have seen significant solar growth. 50-100 TWh: Brazil, Germany, and Spain have increased solar generation. 20-50 TWh: Australia, Italy, South Korea, and the Netherlands show strong growth, with solar making up a larger share of their electricity mix. 5-20 TWh: Countries like South Africa, Poland, Chile, Greece, and Hungary have increased solar power generation but remain in the mid-range. 1-5 TWh: Denmark, Jordan, and Cyprus have expanded solar power, with higher shares of solar in their electricity mix. <1 TWh: Smaller markets like Armenia, Estonia, and Malta have also increased solar generation but at lower absolute levels. The chart highlights widespread solar power growth across all regions, with significant increases in both total generation and solar's share of electricity generation between 2019 and 2024.
Charting solar power's explosive global growth!
From 2019 to 2024, countries have moved right (higher share, %) and up (more solar power, TWh), with the boom spanning small to large power markets.
@ember-energy.org's Global Electricity Review is out today!
ember-energy.org/latest-insig...

NEW | World surpasses 40% clean power in 2024, driven by a RECORD rise in renewables 📈
Solar has DOUBLED in just three years, remaining the world’s fastest-growing source of new electricity and the engine of the energy transition ⚡
ember-energy.org/lat...
#GER2025

NEW | The UK’s Clean Power 2030 Action Plan will MORE THAN HALVE fossil gas imports by 2030 to secure supply and reduce exposure to price shocks💹
With rapid electrification, 🇬🇧 can further benefit with low and stable heating and transport costs⚡
ember-energy.org/lat...
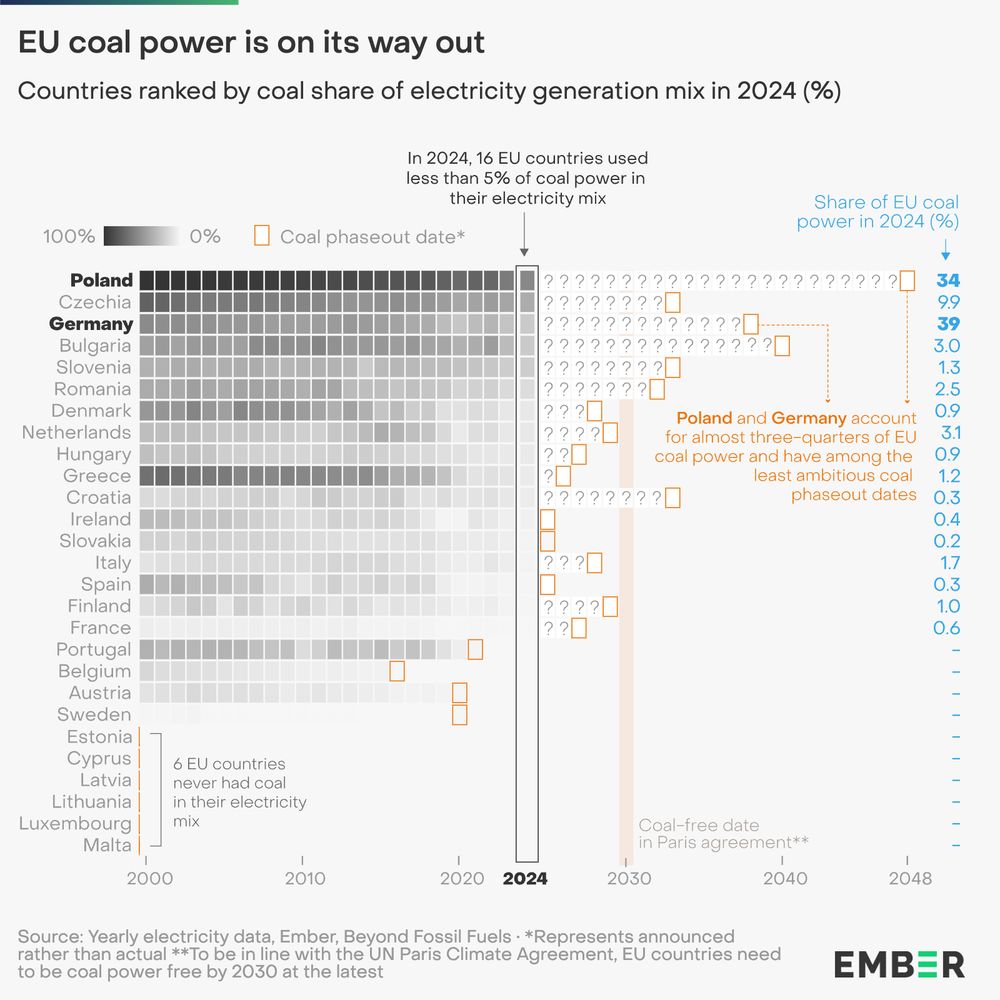
EU coal power is on its way out.
New Ember report on the state of EU power sector out today, with a round up of findings from 2024: ember-energy.org/latest-insig...

A joy to visualise this good climate news ☀️
Solar is growing in every EU country and, for the first time in 2024, generates more electricity than coal.
Plenty more powerful and positive insights in
@ember-energy.org's European Electricity Review 2025 out today ➡️➡️➡️ ember-energy.org/latest-insig...
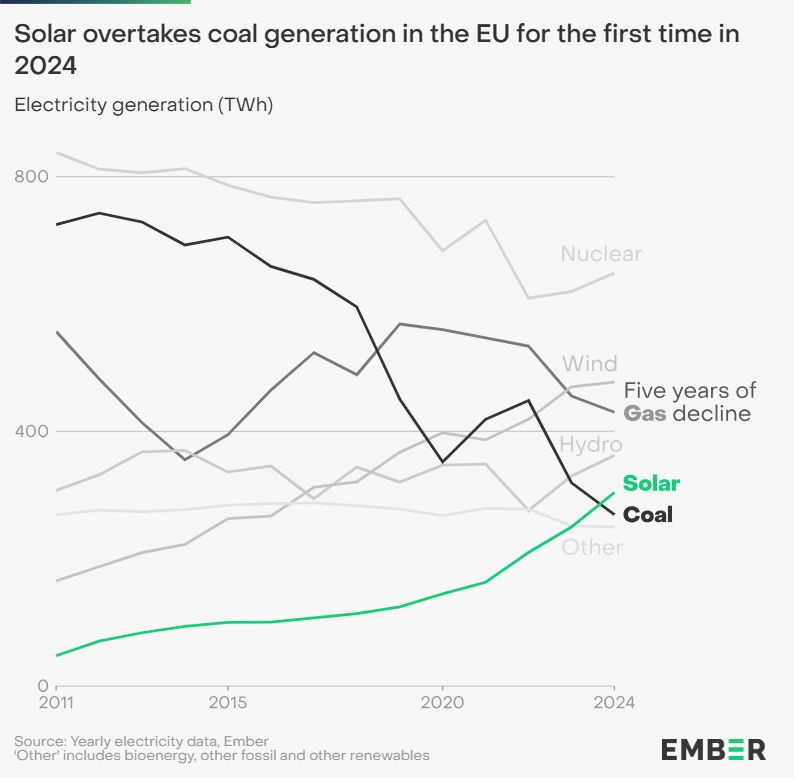
NEW | Solar generates more EU electricity than coal for the first time in 2024 🇪🇺☀️
Renewables made up nearly HALF of the electricity mix last year, while fossil power fell to a historic low ⚡
ember-energy.org/lat...

Almost three months at @ember-energy.org — making maps, charting milestones, publishing my first classic Ember stacked area chart and creating infographics too!
Excited to share more charts and highlight the amazing work of my talented visual storytelling colleagues and Ember analysts.