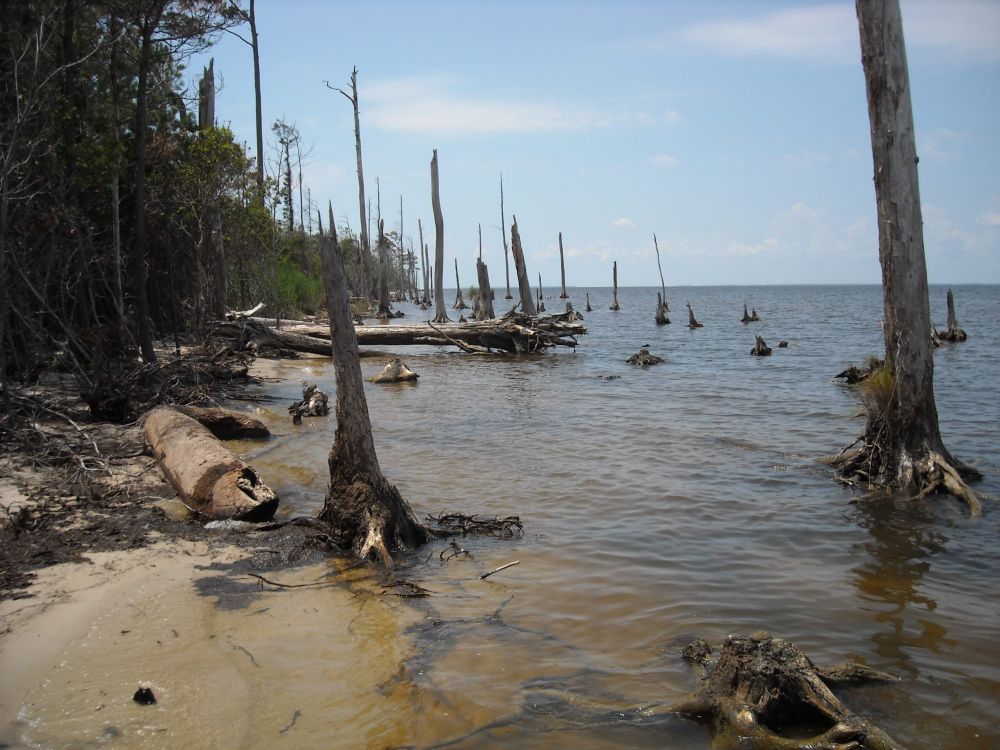
World Peatland Day: Protecting a crucial carbon sink
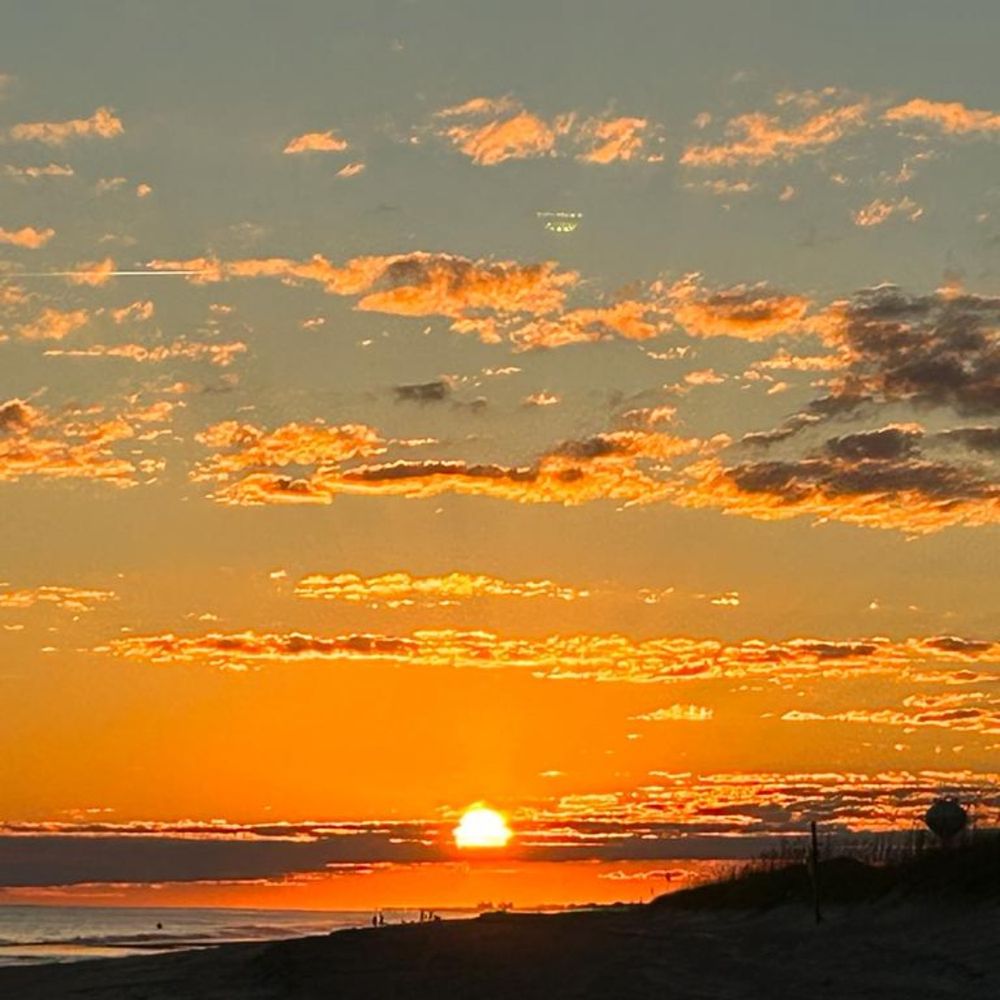
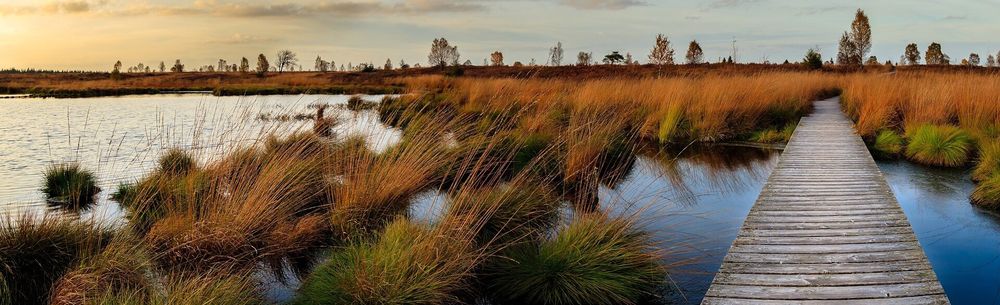
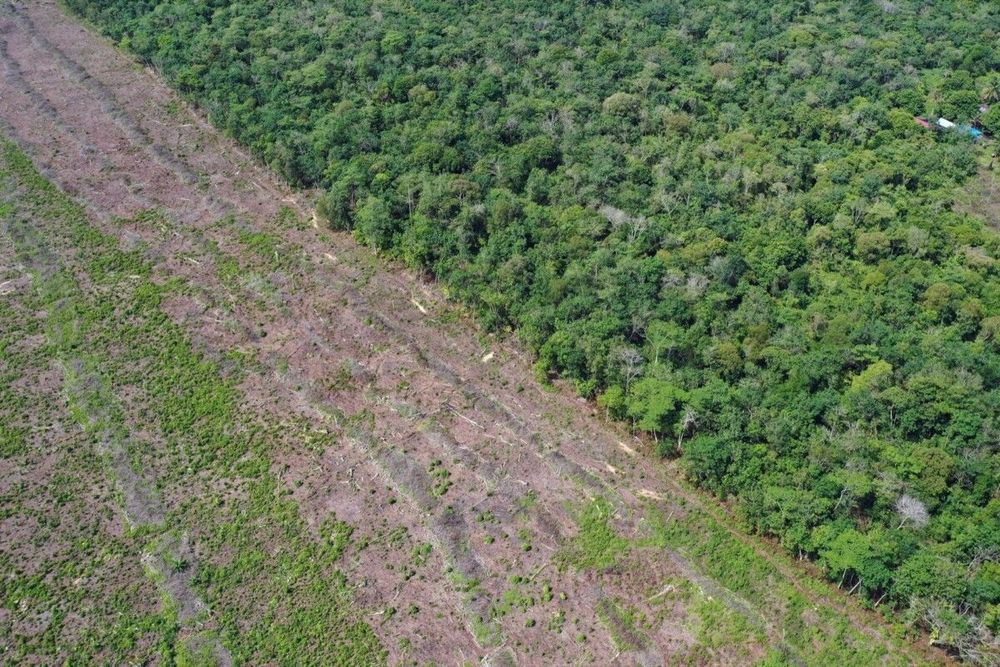
Peatlands are one of the world’s biggest carbon sinks. These naturally waterlogged boggy swamps can hold thousands of years’ worth of compressed, partially decomposed vegetation matter — despite…
Peatlands are one of the world’s biggest carbon sinks. Despite covering just 3-4% of Earth’s land surface, they’re thought to store more carbon per area than the world’s forests combined.
In honor of World Peatland Day on June 2 here's three recent Mongabay stories on this critical ecosystem...
03.06.2025 08:18 — 👍 34 🔁 19 💬 1 📌 1
Agree with the previous comments. You can try three times, and if you don’t succeed you can always submit it to the general programs. And you can turn it into a paper.
31.05.2025 18:59 — 👍 1 🔁 0 💬 0 📌 0
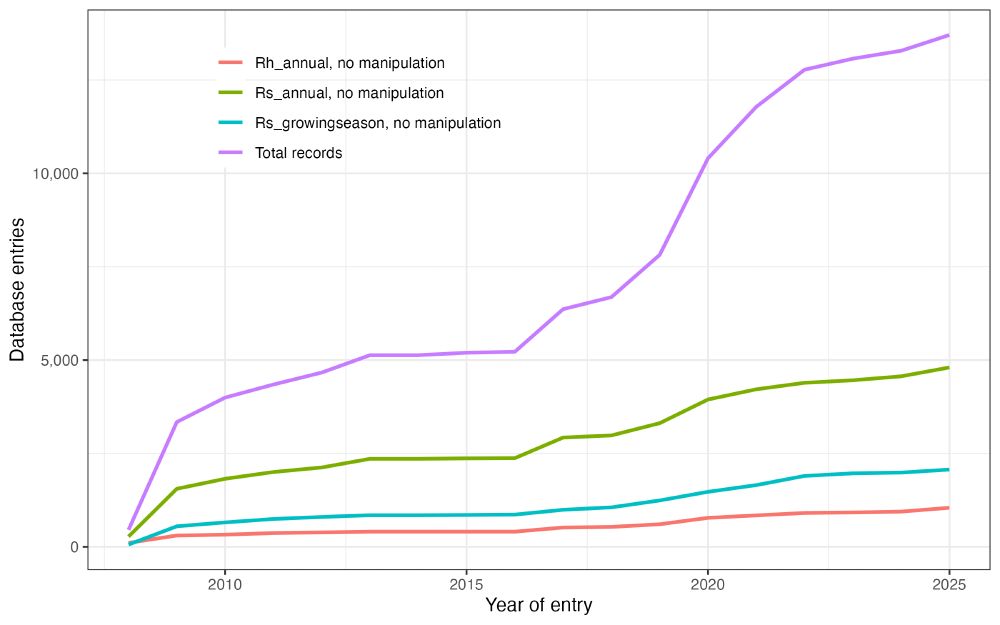
A graphing showing the number of database records for soil respiration raising over time
I used the loooong flight home from #EGU25 to finalize and push a new release of the freely-available Soil Respiration Database github.com/bpbond/srdb/ #openscience
04.05.2025 11:47 — 👍 33 🔁 6 💬 1 📌 0
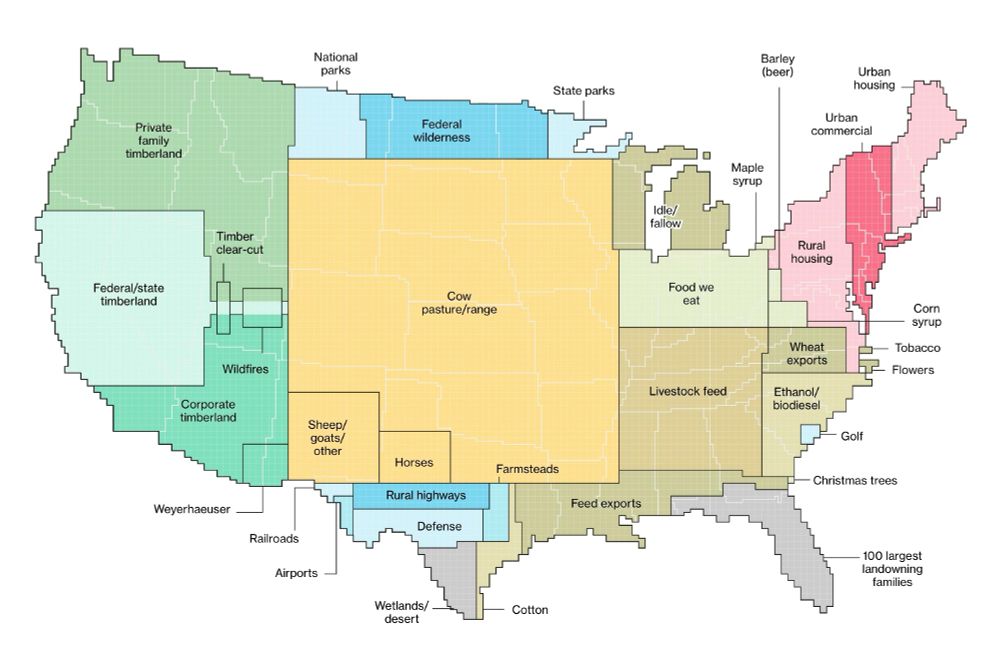
This is a cartogram map of the United States depicting land use by different categories. The map distorts state shapes to represent proportional land usage. Key land use types include cow pasture/range (covering much of the central U.S.), private and federal timberland in the Pacific Northwest, corporate timberland in the Southeast, and urban housing/commercial areas in the Northeast. Other categories include agriculture (livestock feed, wheat exports, ethanol/biodiesel, cotton), protected lands (national parks, federal wilderness, state parks), and infrastructure (railroads, airports, highways). Additional specialized land uses include wildfires, golf courses, Christmas tree farms, and maple syrup production.
I think about this map a lot.
www.bloomberg.com/graphics/201...
27.02.2025 17:26 — 👍 2754 🔁 658 💬 163 📌 140
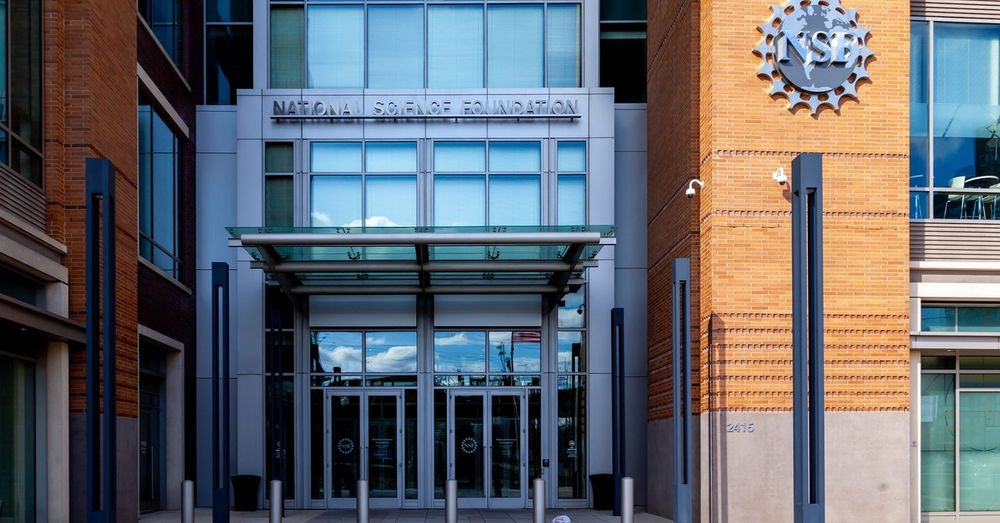
NSF state cards - Google Drive
This is amazing 😍😍 @500womensci.bsky.social has made cards for each state on funding for NSF and NIH avail for download bit.ly/NSF_bystate & bit.ly/NIH_bystate if they are helpful for folks
19.02.2025 11:06 — 👍 272 🔁 177 💬 12 📌 21
U.S. early-career researchers struggling amid chaos
Uncertain funding, government firings, and distressed universities hit vulnerable groups especially hard
Graduating during the pandemic slowed down my process and is part of why I did two postdocs. Now as a first year faculty, all the federal grants are frozen. I love the work I do but this has all of us questioning how much www.science.org/content/arti...
24.02.2025 23:26 — 👍 2736 🔁 543 💬 71 📌 23
The office door of my colleague, fired from his job with no notice. His nameplate is covered in black paper.
168 colleagues lost yesterday, 6 in Earth Sciences alone. Today we grieved. And strategized. www.npr.org/2025/02/18/n...
20.02.2025 01:16 — 👍 563 🔁 121 💬 10 📌 3
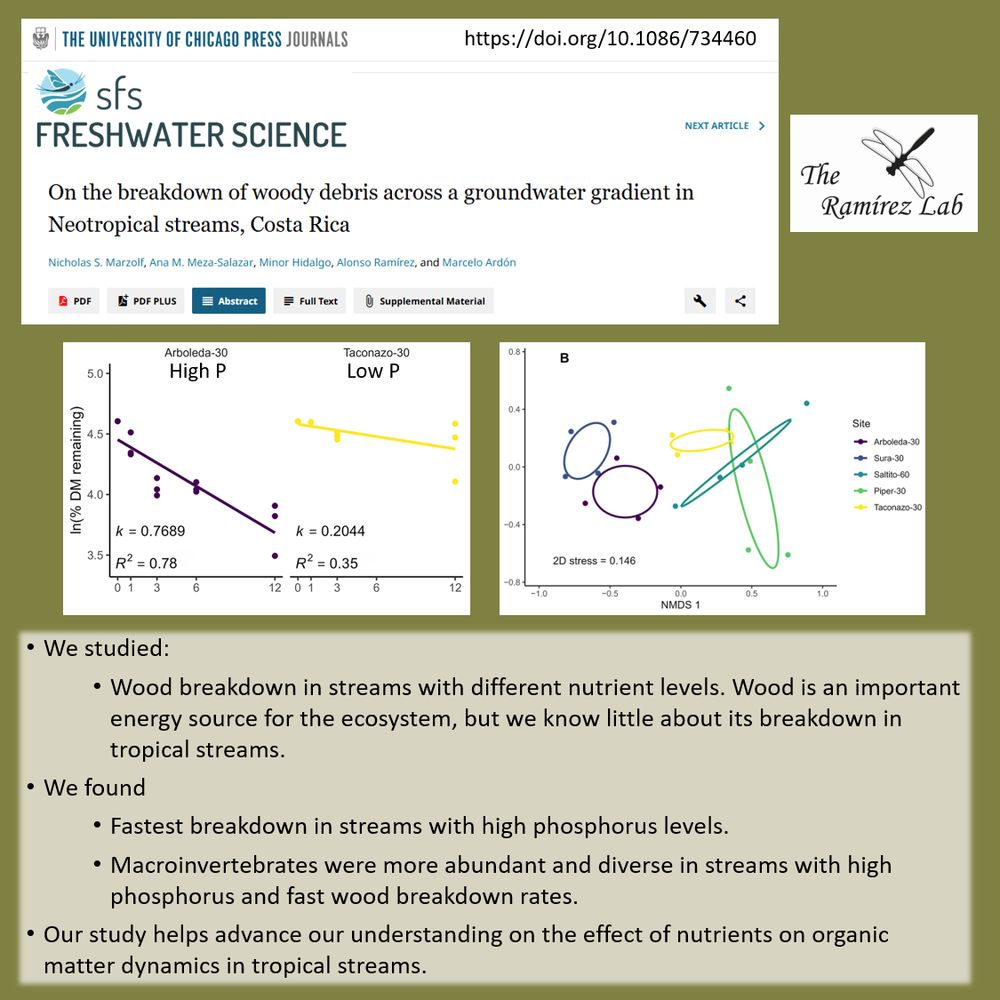
Woody debris breaks down faster in tropical streams with high phosphorus.
Marzolf et al. 2025. On the breakdown of woody ... in Neotropical streams, Costa Rica. Freshwater Science
www.journals.uchicago.edu/doi/10.1086/...
@nickmarzolf.bsky.social @ardonlab.bsky.social @alonsoramirez.bsky.social
19.02.2025 16:16 — 👍 6 🔁 4 💬 1 📌 1
So a former postdoc from our department had just started as a PO at NIH and was terminated in the wave of terminations last week. He is in the research triangle and a phenomenal scientist with expertise in stress and glia. If anyone in the RTI is hiring asap please let me know! #neuroskyence
16.02.2025 21:46 — 👍 1221 🔁 414 💬 21 📌 6
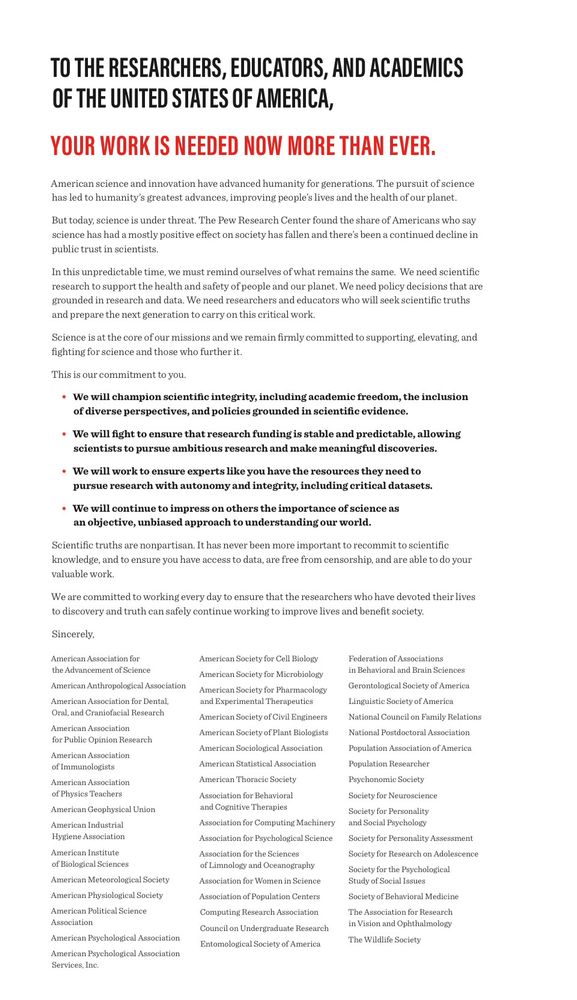
Professional societies stand together in defense of science & scientists.
“science has led to humanity’s greatest advances, improving people’s lives & the health of our planet … (we’re) committed to supporting, elevating, & fighting for science & those who further it.“
www.unitedsciencealliance.org
13.02.2025 03:41 — 👍 242 🔁 122 💬 7 📌 17
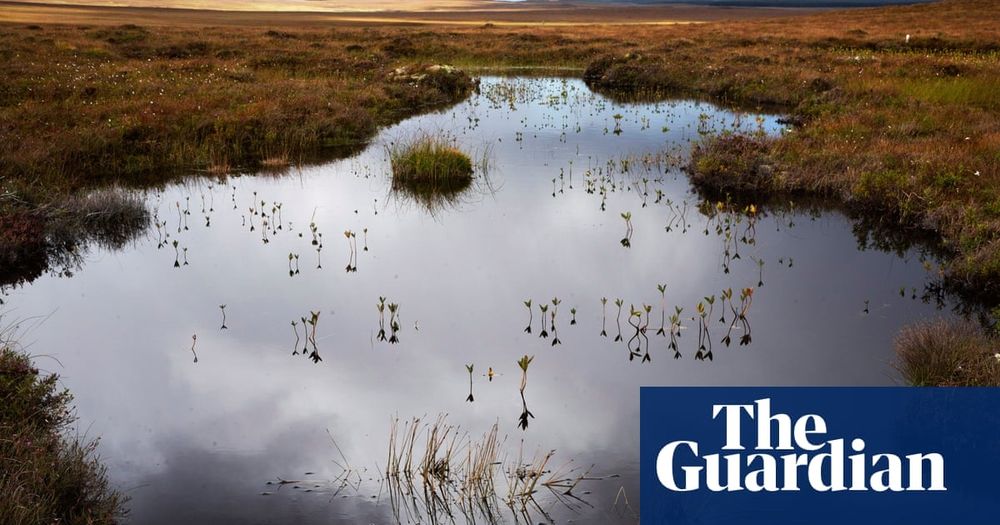
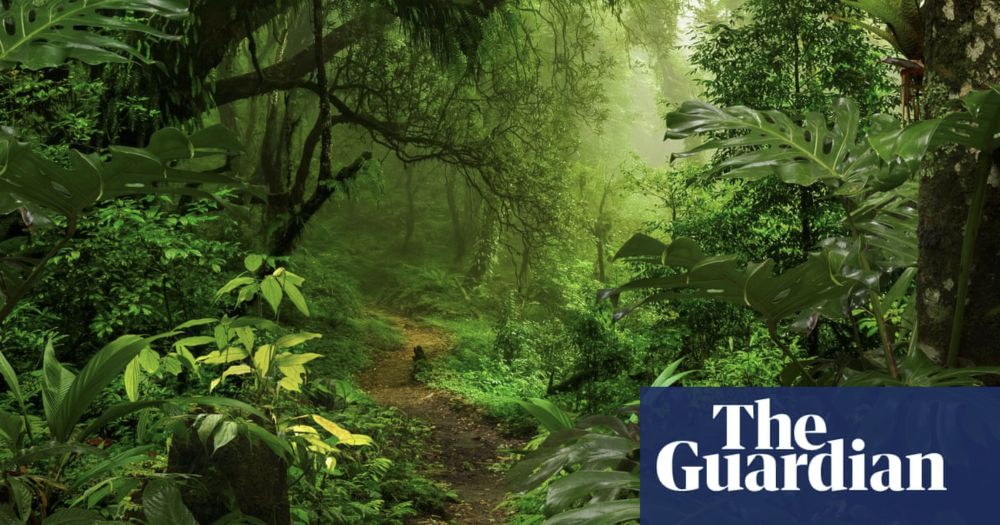
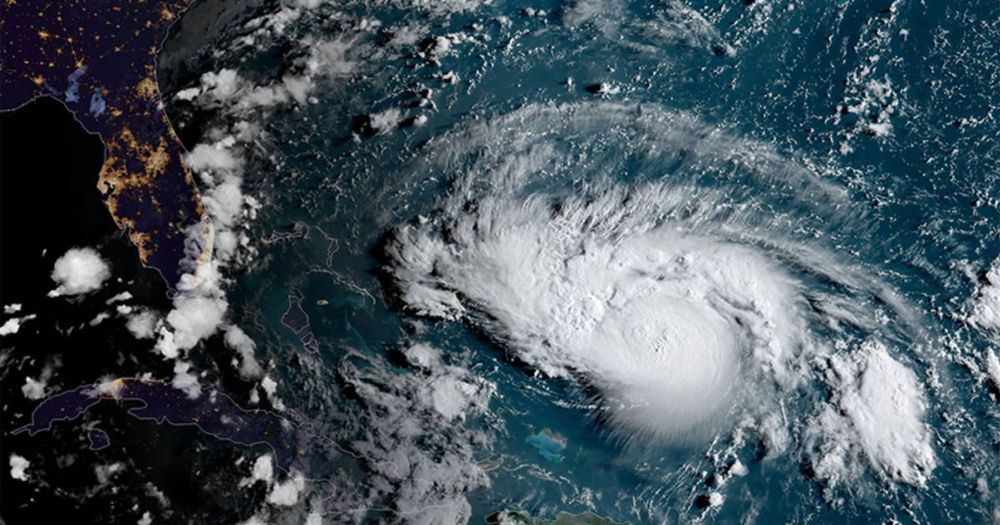
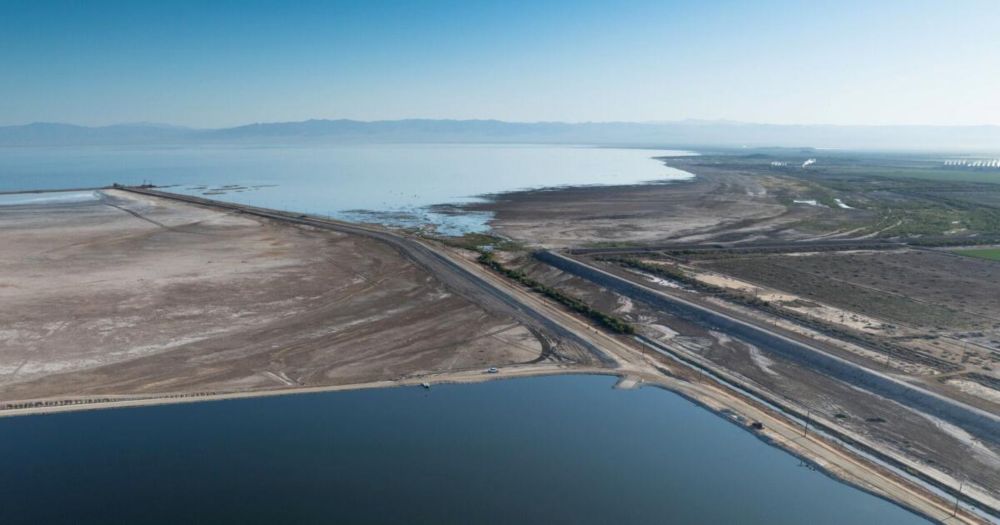
World’s largely unprotected peatlands are ticking ‘carbon bomb’, warns study
Bogs and swamps are a colossal carbon store but their continued destruction would blow climate change targets
Draining the world's peatlands for farming and mining is releasing so much CO2 that if it was a country, it would be the 4th biggest polluter in the world after China, the US, + India.
And the associated losses in biodiversity are vast.
www.theguardian.com/environment/...
13.02.2025 09:05 — 👍 277 🔁 131 💬 3 📌 6
LinkedIn
This link will take you to a page that’s not on LinkedIn
We are looking for two postdocs for a synthesis project focused on soil carbon dynamics and warming experiments. If you are excited about applying ML and process-based models to synthesize mechanisms of temperature sensitivity of soil respiration, please apply!
lnkd.in/dV2wuGSe
lnkd.in/diZiM9HV
11.02.2025 00:15 — 👍 13 🔁 10 💬 1 📌 0
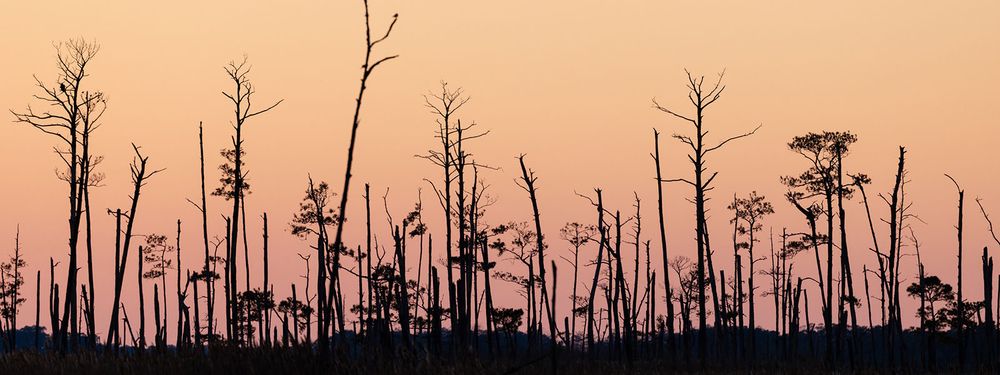
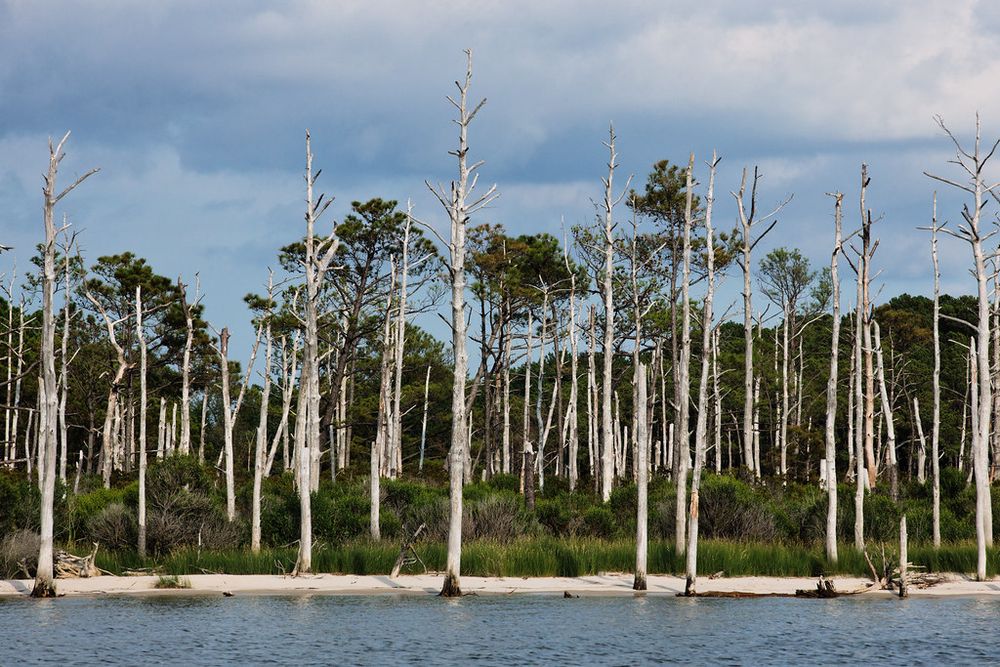
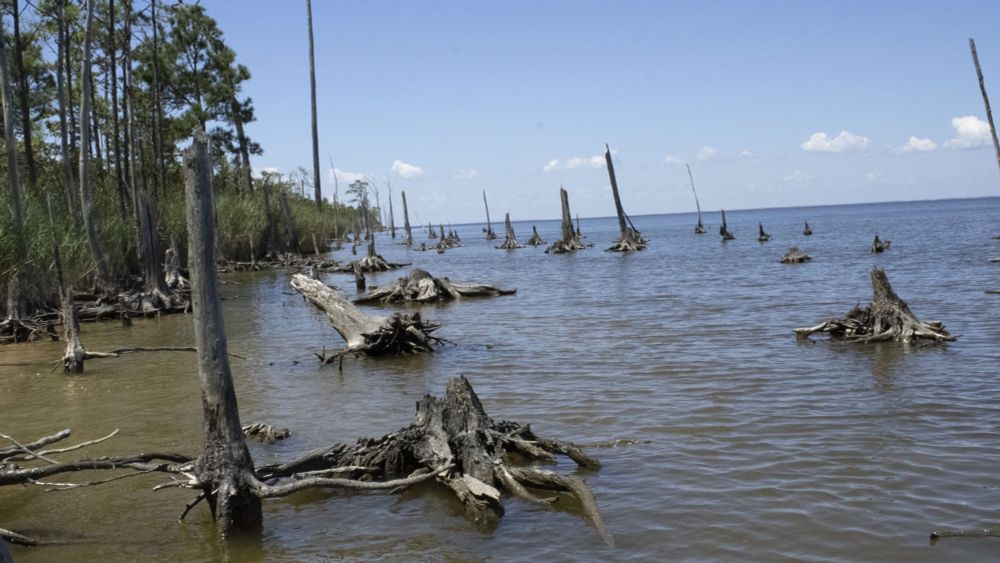
Behind the paper: changing forests on the US East Coast - Latitude
We speak to Marcelo Ardón and colleagues about their recent PLOS Climate publication, “Coastal carbon sentinels: A decade of forest change along the eastern shore of the…
New on the Latitude blog: we talk to the @ardonlab.bsky.social about their recent PLOS Climate article, which looks at how climate change and sea level rise are affecting the ecology and carbon balance of forests along the US East Coast
latitude.plos.org/2025/02/behi...
10.02.2025 11:01 — 👍 5 🔁 4 💬 0 📌 0
Sharing a passion for freshwater science- We spent an evening meeting people from different institutions in NC that work in aquatic ecosystems and talking about freshwater ecosystems
This was part of the "Converge Freshwater Science Series" hosted at #NCSU
@ardonlab.bsky.social @agdelv.bsky.social
05.02.2025 16:06 — 👍 11 🔁 3 💬 0 📌 1
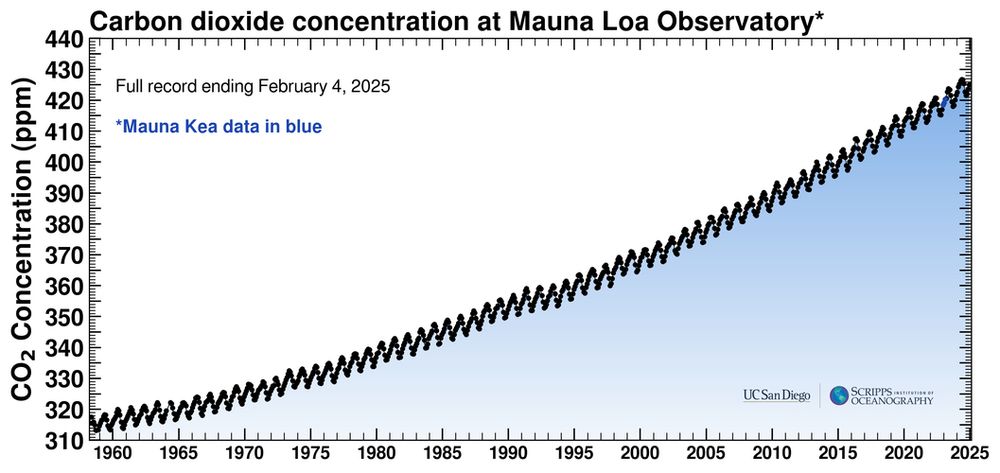
A graph of atmospheric carbon dioxide concentrations at the Mauna Loa observatory, Hawaii, from 1958 to 4th February 2025. It shows carbon dioxide levels rising at an accelerating rate over the decades. This is known to be due to emissions of carbon dioxide from human activity, mainly fossil fuel burning but also deforestation. The first CO2 concentration value in March 1958 was 315 parts per million (ppm). The latest daily value is 426 ppm. The graph also shows a seasonal cycle of a few ppm within each year, which is known to be linked to the growing season in the northern hemisphere causing a temporary uptake of carbon in spring and summer and release in autumn. The graph is produced routinely by the Scripps Institution of Oceanography, UC San Diego.
Although NOAA's page on atmospheric CO2 levels has vanished, you can still get this vital information from Ralph Keeling's team at the Scripps Institution of Oceanography, UC San Diego keelingcurve.ucsd.edu
Please follow bsky.app/profile/keel... for updates and share
Don't let science be hidden
05.02.2025 10:27 — 👍 1821 🔁 959 💬 45 📌 45
I can’t wait for the second round of search terms: climate, sea level, etc. For all you scientists (and you know who you are) who think you won’t be affected because your broader impacts are amazingly still limited to training grad students and chatting to K-12 kids, this won’t stop at one list.
04.02.2025 11:34 — 👍 17 🔁 8 💬 1 📌 0
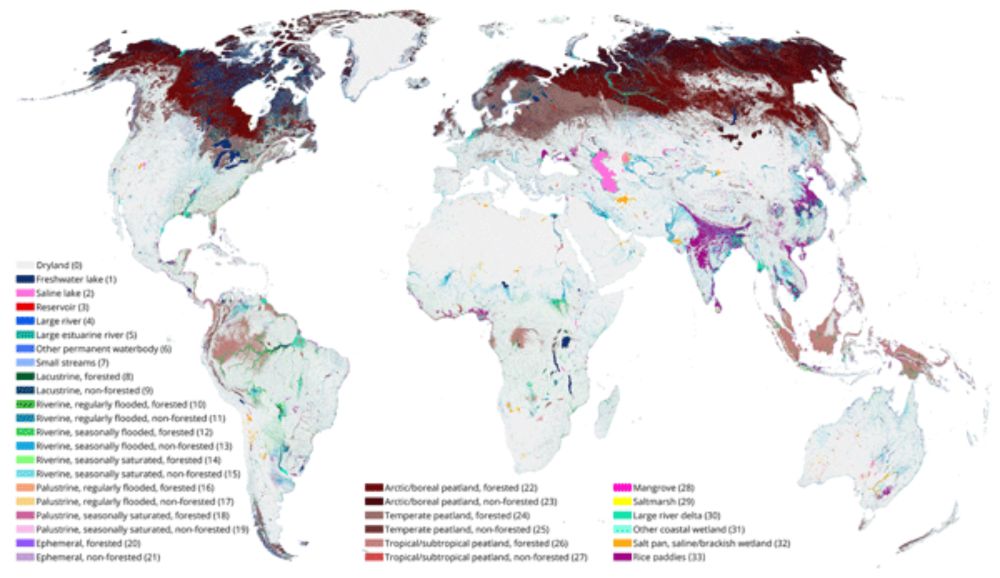
Wetlands are vital for #biodiversity, including as critical habitats for many migratory species.🐦🌍🧪
— @ipbes.bsky.social #LandDegradation Assessment
Yet, many of these #wetlands are now threatened.
Learn how wetlands support biodiversity with Ramsar for #WWD2025:
www.worldwetlandsday.org
02.02.2025 16:14 — 👍 344 🔁 129 💬 1 📌 7
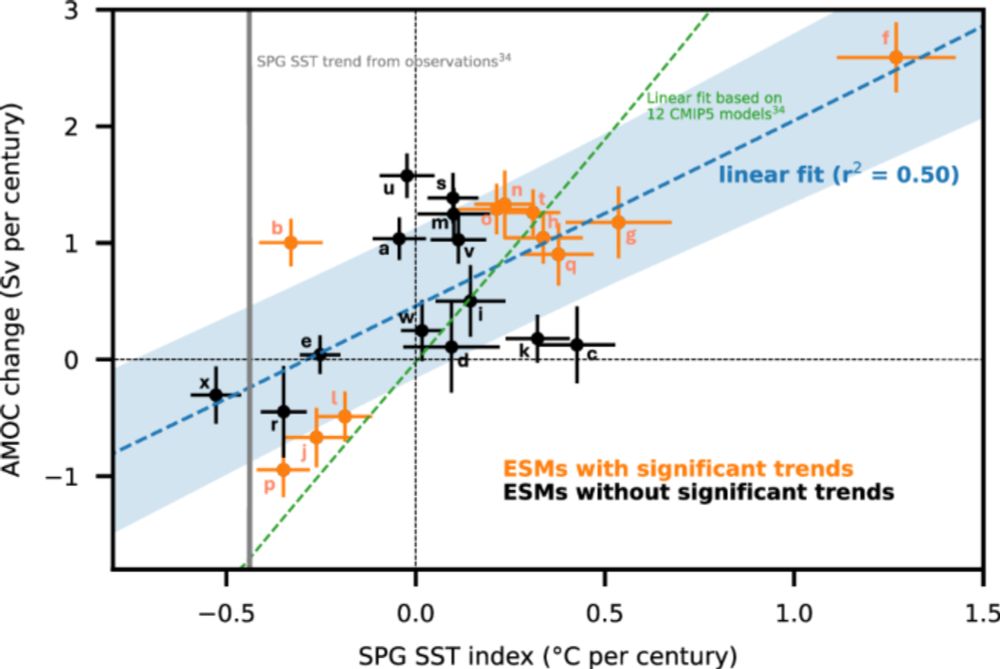
Atlantic overturning inferred from air-sea heat fluxes indicates no decline since the 1960s - Nature Communications
The AMOC is crucial for the global ocean overturning circulation and controls the climate around the North Atlantic. Here, the authors use 24 Earth System Models from the CMIP6 to demonstrate tha...
Has the Atlantic Meridional Overturning Circulation (AMOC) weakened over the last decades? In our new study, we combine state-of-the-art CMIP6 models and observation-based estimates of the air-sea heat flux in the North Atlantic to show that the AMOC has not declined since the 1960s! 🌊
15.01.2025 10:10 — 👍 451 🔁 162 💬 25 📌 58
Professor of Creative Pedagogies | Poet | Game Designer | Slow AI
#SciComm #HigherEd #Poetry #GenAI
https://theslowai.substack.com/
https://linktr.ee/sam.illingworth
Professor, Department of Biological Sciences, University at Buffalo, SUNY | 1st Gen | Extinction is forever | DevoEvo & EvMed | Innovation, Novelty, Constraint, Homology | Science & Society | Friend of Corvids and swans | Science Nerd | I❤️Biology!
The Dust Tweeter! Professor/Scientist, University of Texas-El Paso.
educator, futurist, Predictor, humorist, human rights defender, thoughtprovoker, militant moderate
#dust #aerosols #drylands #aeolian #DisabledInSTEM
@tomgillpredicts on X/Twitter
Ecosystem scientist and computational modeler. Living in Knoxville, TN, formerly of Madison, WI
@emlabtartu.bsky.social
Homepage: https://geograafia.ut.ee/en/content/environmental-microbiology-lab
Scientist studying life in all its mathematical beauty. Bridging bio+social with physics. At Complexity Science Hub. Former NSF GRFP, SFI postdoc, Austrian Science Fund ESPRIT. PoETs Lab. Associate Editor ACM Social Computing.
https://eddielee.co
A multi-institutional network that integrates MARE - Marine and Environmental Sciences Centre, CBMA - Centre for Molecular and Environmental Biology, and CIMA - Centre for Marine and Environmental Research. From river basins to deep-sea ecosystems.
Geochemistry | 🌊 | Deep-sea | UNCLOS |
Assoc. Prof. at ULACIT 🇨🇷 Visiting Assoc. Prof. at 同济大学 🇨🇳
@geolatinas.bsky.social | @aslo.org Early Career Committee
We are local communities restoring Earth for a sustainable future. Join the Mighty Movement!
I’m campaigning for more messy spaces for nature, join our messy mission and let’s Rewild together by doing less- and letting nature do the rest!
PhD researcher - Rewilding with Beavers 🦫
Founder of the Wee Pond Project 🐸
They say I’m outspoken. Professor of Global Change Science at UCL and University of Leeds. Author, The Human Planet. Trying to understand the world and change it too.
Sound science. Smart stories. Fact-checked journalism. Published by the nonprofit @annualreviews.bsky.social
📨 Weekly newsletter: https://knowmag.org/SIGNUP
🌎 Lea en español: @revistaknowable.bsky.social
💚 Support: https://knowablemagazine.org/donate
Huge animal lover, uk transplant,singer with Goliath (uk) political junkie & proud resister.
Support LGBTQ.
Hobbies: Interior decorating & Gardening.
Husband, dad, veteran, writer, and proud Midwesterner. 19th US Secretary of Transportation and former Mayor of South Bend.
The ClimateChangePost: the latest news on how the shifting climate is affecting life in Europe. https://www.climatechangepost.com
🇺🇸🇨🇷Assistant Prof of Biology at Hope College in Michigan. My undergrad team investigates ecological and evolutionary drivers of freshwater fish diversity in 🇨🇷 and 🇺🇸
https://www.instagram.com/freshwaterfishecologylab?igsh=MXFxY2VsOTc5bG42dA==
Ocean advocate, community builder, climate scientist. I make sure the ocean interior is healthy so you don't have to.
Faculty at UNC-Chapel Hill in Earth, Marine, and Environmental Science.
John is Professor of Soil Science at Lancaster University . He teaches about soil and his research is focused on the restoring degraded soils an mitigating diffuse pollution. He has current projects in Kenya and the UK.
Scientist, artist, educator, chef, fisherman, outdoor enthusiast, bookworm, linguist, peacemaker, volunteer, etc. in no particular order.
Please don't ask because I will not date you, I will not send you money, and I will not be your disciple. Thanks.
 04.06.2025 22:58 — 👍 7 🔁 2 💬 1 📌 1