This plot shows the number of hybrid and electric car registrations per 1000 people in Catalonia as a function of the socio-economic index (with an average value of 100). Each point represents a municipality. Each panel corresponds to a specific vehicle type. The color shows the log10 of population.
04.06.2025 15:43 — 👍 1 🔁 0 💬 0 📌 0

El tall elèctric del dilluns, que va afectar la península Ibèrica, activà les torxes del complex petroquímic de Tarragona. El gràfic següent mostra les concentracions de contaminants al voltant de la ciutat durant la darrera setmana. Les mesures es van interrompre durant l’apagada massiva.
29.04.2025 15:03 — 👍 0 🔁 0 💬 0 📌 0

Importacions i exportacions de roses fresques i tallades en tones. Les bandes verticals de colors corresponen Sant Valentí, Sant Jordi i Tot Sants.
23.04.2025 13:22 — 👍 0 🔁 0 💬 0 📌 0

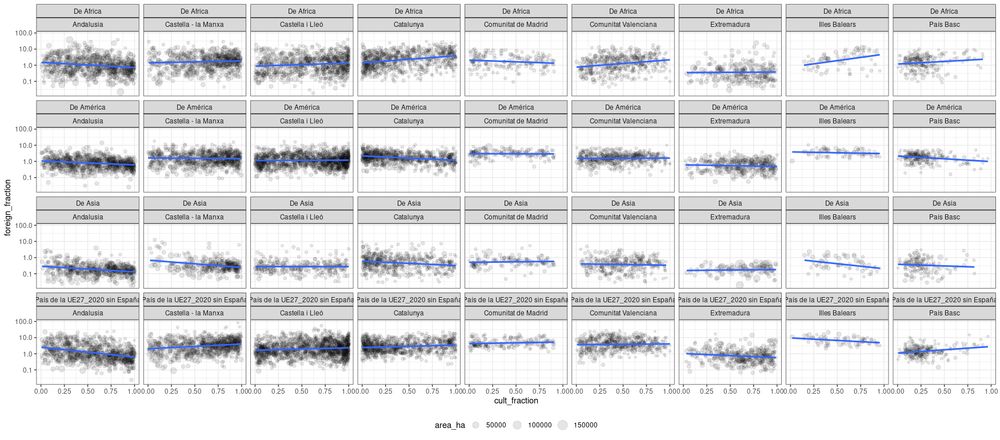
The figure shows the equilibrium mole fraction of dissolved CO₂ for each temperature and pressure range for the 12 most studied ionic liquids in the literature. For reference, the equilibrium CO₂ molar fraction in water within a pressurized and refrigerated soda bottle is around 0.0025.
03.04.2025 17:51 — 👍 0 🔁 0 💬 0 📌 0
Given their high capacity to dissolve CO2, ionic liquids have received significant attention from the scientific community interested in developing viable carbon capture solutions. Although I know very little about the topic, I downloaded, preprocessed, and harmonized data from a top open database.
03.04.2025 17:51 — 👍 0 🔁 0 💬 1 📌 0

Ratio entre l'energia eòlica estimada i la màxima teòrica (capacity factor) a Catalunya juntament amb la localització dels aerogeneradors
01.04.2025 16:22 — 👍 0 🔁 0 💬 0 📌 0

Tarragona with streets (from OSMaps), restaurants (from OvertureMaps), soil use (from SIOSE-AR) and hillshade (via the elevatr package)
18.03.2025 12:30 — 👍 1 🔁 0 💬 0 📌 0
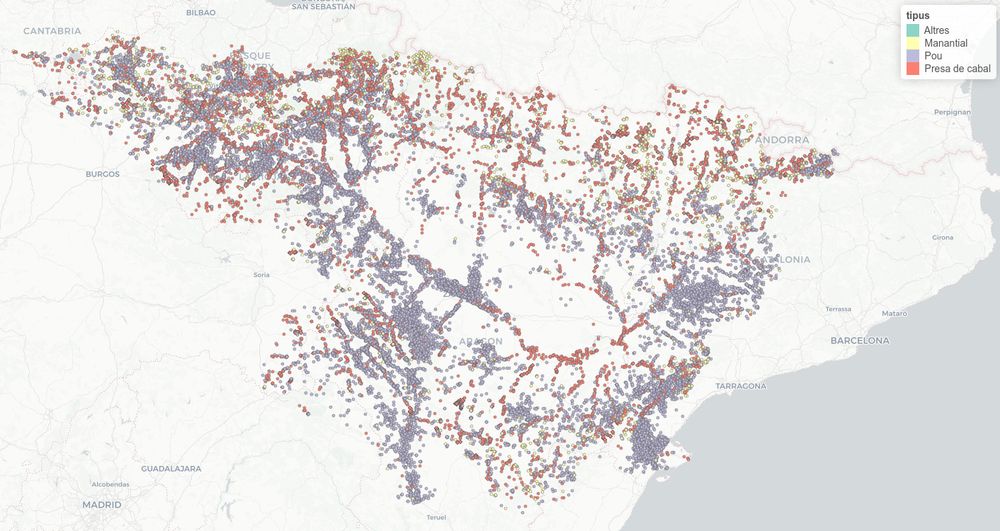
Wells, springs, and flow intake points in the Ebro River Basin:
03.02.2025 19:07 — 👍 1 🔁 0 💬 0 📌 0
Great tutorial! Thanks
19.01.2025 15:16 — 👍 1 🔁 0 💬 1 📌 0
Data from the National Institute of Statistics reveal that during the 3 months of the event (Aug-Oct 2024), the number of tourists arriving in the city increased by 100k compared to the 2023.
However, the scam is already a fact and 50M euros have passed from the public treasury into private hands.
17.12.2024 20:13 — 👍 1 🔁 0 💬 0 📌 0
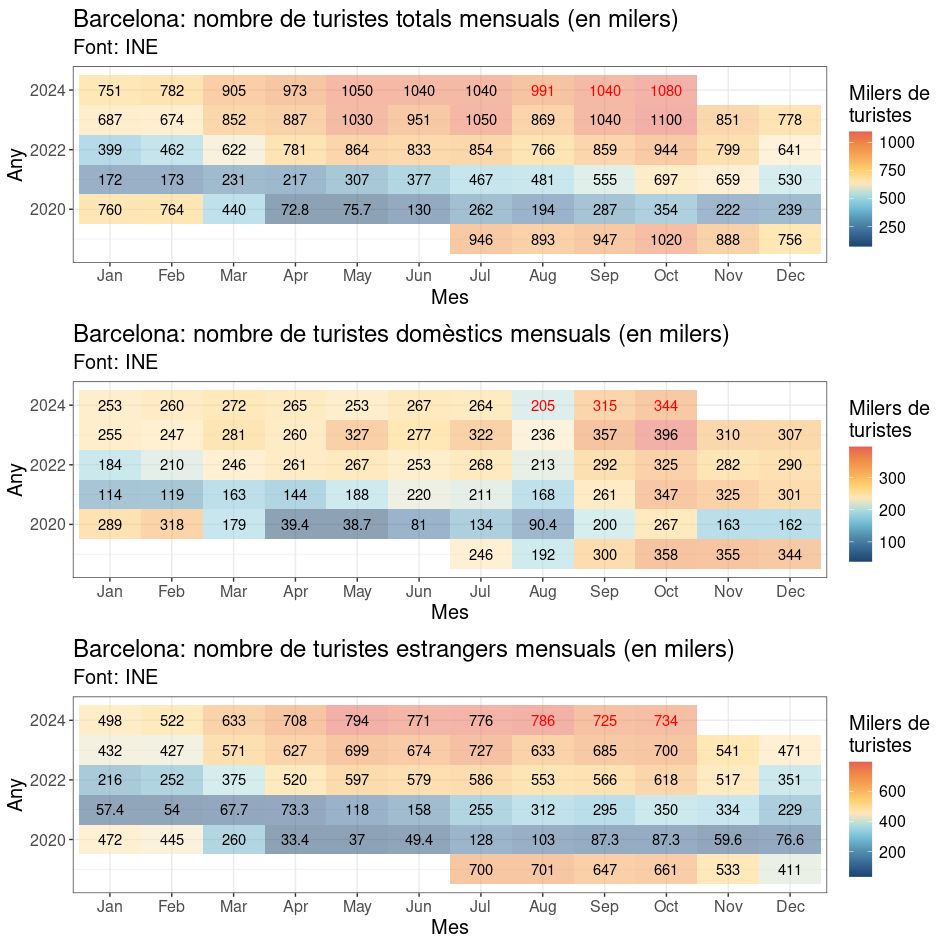

Municipal officials, media and even some university professors defended incessantly the absurd idea that the America's Cup would bring more than 2 million visitors to the city of Barcelona.
17.12.2024 20:13 — 👍 1 🔁 0 💬 1 📌 0
Beautiful!
11.12.2024 18:50 — 👍 1 🔁 0 💬 1 📌 0
Data from the Spanish Institute of Statistics, INE (2022) and CORINE land cover/use dataset (2018)
26.11.2024 16:36 — 👍 0 🔁 0 💬 0 📌 0
Although relatively mild, there are a few notable features, such as the distinct preference for siestas in Extremadura.
26.11.2024 15:29 — 👍 0 🔁 0 💬 0 📌 0

My first post here! This shows the self-reported sleep time for each autonomous community in Spain, expressed as the percentage of the sleeping population. Hopefully, I didn’t mess up the elevation factors! Similar data for other countries can be found on @ipums.bsky.social .
26.11.2024 15:29 — 👍 5 🔁 0 💬 1 📌 0
I make @hyperfixedpod.bsky.social I used to make Reply All. One day I will be in the ground hopefully flowers will grow out of me
Music:
Slowfawns.bandcamp.com
Western kabuki (the official podcast of Bluesky):
patreon.com/weste
Demographics | Geospatial | Data Science | Open Source
ugh, who invited this guy
Periodista de Datos en el periódico ABC de España. Datos, gráficos, mapas, visualización y nuevas narrativas. https://www.abc.es/autor/luis-cano-1387/
La vida excitant de l'acadèmia.
Professor ICREA de Ciències Experimentals i Matemàtiques a la URV. Bayesià-jaynesià. Socialista d'ordre. Aquí xerro sobretot de política. For science, follow @seeslab.bsky.social
GIS | Geospatial health | Spatial epidemiology |
| Based @itmantwerp.bsky.social | Funded by @fwovlaanderen.bsky.social | Visiting Scientist @ KEMRI-Wellcome Trust Research Programme | https://www.petermacharia.com/
Health Geographer • Spatial Epidemiology • Climate & Health • Researcher at @cepsudd
Prof. Human #Mobility & #Migration • Geographic #DataScience • #Spatial #Inequality
🙌🏽 Lead @geodatascience.bsky.social & @qmrg-rgs-ibg.bsky.social
✍️ Editor @region.bsky.social
💻 Project: https://de-bias.github.io/debias/t
🔗 www.franciscorowe.com
Computational geographer. Associate Professor at AMU, Poznan, Poland. Co-author of http://r.geocompx.org, http://py.geocompx.org, and https://tmap.geocompx.org books […]
🌉 bridged from ⁂ https://fosstodon.org/@nowosad, follow @ap.brid.gy to interact
Ex-Health geographer at Glasgow Uni 🗺️
Previous: Spatial ecologist & modeller 🌿
Always: #Rspatial #RStats ✨ Dog video connoisseur 🐶
Geographer
PhD Student in Epidemiology - Ensp/Fiocruz
Passionate about spatial statistic and health statistics
denis-or.com.br
Public health, climate, air pollution and geography.
Research assistant at Fiocruz, Brazil
Inria alumni.
#rstats developer
https://rfsaldanha.github.io
health geographer & demographer @ Penn State Geography studying structural health inequity / substance use / neighborhoods /methods geek. Seattle born and raised / #PNW
views mine #LandBack
DrPH student @ Johns Hopkins BSPH •
geospatial epidemiology, health geography, and infectious disease • opinions are mine alone
F.R.S.-FNRS Research Associate at the University of Brussels (Spatial Epidemiology Lab - SpELL, https://spell.ulb.be/) and Visiting Professor at the University of Leuven (Evolutionary & Computational Virology lab, https://rega.kuleuven.be/cev/ecv)