#QuoteOfTheDay
"Understanding is accomplished through: (a) the use of relative size of the shapes used in the graphic; (b) the positioning of the graphic-line forms; (c) shading; (d) the use of scales of measurement; and (e) the use of words to label the forms in the graphic." Robert Lefferts 1981
21.09.2025 12:07 — 👍 1 🔁 0 💬 0 📌 0

🧭Business Intelligence: Perspectives (Part 33: Data Lifecycle for Analytics)
📢 𝗕𝗜: 𝗗𝗮𝘁𝗮 𝗟𝗶𝗳𝗲𝗰𝘆𝗰𝗹𝗲 𝗳𝗼𝗿 𝗔𝗻𝗮𝗹𝘆𝘁𝗶𝗰𝘀
👉 In the context of #BI / #Analytics one talks about #ingestion, #preparation, #storage, #analysis and #visualization, ignoring aspects like #data #generation, #collection or #interpretation. A few starters to think about!
👇https://tinyurl.com/bdcsbvdt #600words
09.08.2025 12:11 — 👍 1 🔁 0 💬 0 📌 0
📢 𝗕I: 𝗗𝗮𝘁𝗮 𝗦𝘁𝗼𝗿𝘆𝘁𝗲𝗹𝗹𝗶𝗻𝗴 𝗶𝗻 𝗩𝗶𝘀𝘂𝗮𝗹𝗶𝘇𝗮𝘁𝗶𝗼𝗻𝘀
👉 The need for #dataviz to tell a #story may be entitled, though in business setups the data, its focus and #context change continuously with the communication means, objectives, [.] one can question #storytelling’s hard requirement.
👇 tinyurl.com/yfrwwyz3
18.07.2025 20:25 — 👍 1 🔁 0 💬 0 📌 0

🧭Business Intelligence: Perspectives (Part XXXI: More on Data Visualization)
📢 𝗕I: 𝗠𝗼𝗿𝗲 𝗼𝗻 𝗗𝗮𝘁𝗮 𝗩𝗶𝘀𝘂𝗮𝗹𝗶𝘇𝗮𝘁𝗶𝗼𝗻
👉 There are many reasons why the #dataviz available in the different mediums can be considerate as having poor #quality and unfortunately there is often more than one issue that can be corroborated with this [.]
👇 tinyurl.com/2p9v66x2
#analytics #gaps #perspectives
03.05.2025 13:43 — 👍 2 🔁 0 💬 0 📌 0
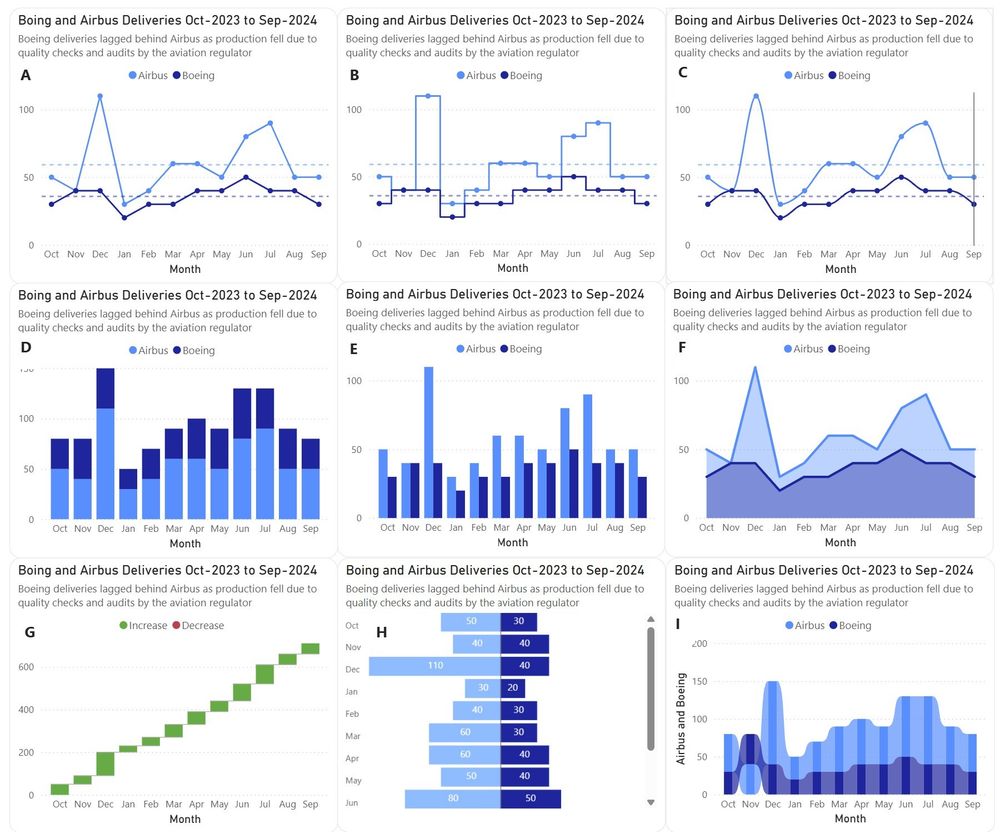
📢𝗗𝗮𝘁𝗮 𝗩𝗶𝘀𝘂𝗮𝗹𝗶𝘇𝗮𝘁𝗶𝗼𝗻: 𝗖𝗼𝗺𝗽𝗮𝗿𝗶𝘀𝗼𝗻𝘀 𝗕𝗲𝘁𝘄𝗲𝗲𝗻 𝗗𝗮𝘁𝗮 𝗦𝗲𝗿𝗶𝗲𝘀
For comparing two data series, one can use line charts (A-C), column charts (E), stacked column charts (D), area charts (F), water charts (G), tornado charts (H) and even ribbon charts (I). Which one you'd prefer?
👉https://tinyurl.com/bdekvwvu
02.05.2025 23:32 — 👍 2 🔁 0 💬 0 📌 0
📢 𝗕𝗜: 𝗧𝗵𝗲 𝗗𝗮𝘁𝗮 𝗦𝗰𝗶𝗲𝗻𝗰𝗲 𝗖𝗼𝗻𝗻𝗲𝗰𝘁𝗶𝗼𝗻
👉 Given any amount of #data, the #knowledge that can be obtained from it can be limited by many factors - the degree to which the data, #processes and #models built reflect #reality, and there can be many levels of #approximation [.]
👇 tinyurl.com/2pjtzx6s
24.04.2025 17:10 — 👍 0 🔁 0 💬 0 📌 0

🧮ERP: Implementations (Part XVIII: The Price of Partnership)
📢 𝗘𝗥𝗣 𝗜𝗺𝗽𝗹𝗲𝗺𝗲𝗻𝘁𝗮𝘁𝗶𝗼𝗻𝘀: 𝗧𝗵𝗲 𝗣𝗿𝗶𝗰𝗲 𝗼𝗳 𝗣𝗮𝗿𝘁𝗻𝗲𝗿𝘀𝗵𝗶𝗽
👉 When one proceeds on a journey, it’s important to have a precise destination, a good map to show the road, [.] good gear, enough resources [.] but probably more important, good companions [.]
👇 tinyurl.com/3wsp829x
#ERP #implementation #partners
22.04.2025 08:06 — 👍 0 🔁 0 💬 0 📌 0

🧮ERP: Implementations (Part XVII: Taming the Monsters)
📢 𝗘𝗥𝗣 𝗜𝗺𝗽𝗹𝗲𝗺𝗲𝗻𝘁𝗮𝘁𝗶𝗼𝗻𝘀: 𝗧𝗮𝗺𝗶𝗻𝗴 𝘁𝗵𝗲 𝗠𝗼𝗻𝘀𝘁𝗲𝗿𝘀
👉 "[ #ERP #implementations] are often a matter of endurance with many junctions, skirts, turns, shortcuts, ups and downs, a continuous carousel in which the various issues tend to misbehave like little monsters [.]"
👇 tinyurl.com/3wrtfdsf
20.04.2025 13:15 — 👍 0 🔁 0 💬 0 📌 0

🧮ERP: Implementations (Part XVI: It’s All About Politics)
📢 𝗘𝗥𝗣 𝗜𝗺𝗽𝗹𝗲𝗺𝗲𝗻𝘁𝗮𝘁𝗶𝗼𝗻𝘀: 𝗜𝘁’𝘀 𝗔𝗹𝗹 𝗔𝗯𝗼𝘂𝘁 𝗣𝗼𝗹𝗶𝘁𝗶𝗰𝘀
👉 "An #ERP #implementation takes place within a political #context and #politics can make or break implementations. Politics occurs whenever individuals or organization groups interact to make #decisions [.]"
tinyurl.com/2bwvz5jb
#600words #projects
19.04.2025 12:55 — 👍 0 🔁 0 💬 0 📌 0

🧮ERP: Implementations (Part XV: An Ecosystemic View)
📢 𝗘𝗥𝗣 𝗜𝗺𝗽𝗹𝗲𝗺𝗲𝗻𝘁𝗮𝘁𝗶𝗼𝗻𝘀: 𝗔𝗻 𝗘𝗰𝗼𝘀𝘆𝘀𝘁𝗲𝗺𝗶𝗰 𝗩𝗶𝗲𝘄
👉 [.] the network of interconnected #systems, technologies, applications, users [.] through their direct or indirect interactions form an #ecosystem governed by common goals, #principles, values, policies, processes and resources.
👇 tinyurl.com/mtahex4t
18.04.2025 11:48 — 👍 0 🔁 0 💬 0 📌 0

🧮ERP: Implementations (Part XIV: A Never-Ending Story)
📢 𝗘𝗥𝗣 𝗜𝗺𝗽𝗹𝗲𝗺𝗲𝗻𝘁𝗮𝘁𝗶𝗼𝗻𝘀: 𝗔 𝗡𝗲𝘃𝗲𝗿-𝗘𝗻𝗱𝗶𝗻𝗴 𝗦𝘁𝗼𝗿𝘆
👉 "An #ERP #implementation is occasionally considered as a one-time endeavor after which an organization will live happily ever after. In an ideal world that would be true, though the work never stops [.]"
👇 tinyurl.com/yeyrfsa5
#projects #optimization
16.04.2025 20:24 — 👍 1 🔁 0 💬 0 📌 0

🧮ERP: Implementations (Part XIII: On Project Management)
📢 𝗘𝗥𝗣 𝗜𝗺𝗽𝗹𝗲𝗺𝗲𝗻𝘁𝗮𝘁𝗶𝗼𝗻𝘀: 𝗢𝗻 𝗣𝗿𝗼𝗷𝗲𝗰𝘁 𝗠𝗮𝗻𝗮𝗴𝗲𝗺𝗲𝗻𝘁
👉 Given its intrinsic #complexity and extended implications, an #ERP #implementation can be considered as the real test of endurance for a Project Manager, respectively the team managed.
👇https://tinyurl.com/4xwpjdde
#ProjectManagement #projects #PMO
16.04.2025 11:15 — 👍 1 🔁 0 💬 0 📌 0

🧮ERP: Implementations (Part XII: The Process Perspective)
📢 𝗘𝗥𝗣: 𝗧𝗵𝗲 𝗣𝗿𝗼𝗰𝗲𝘀𝘀 𝗣𝗲𝗿𝘀𝗽𝗲𝗰𝘁𝗶𝘃𝗲
👉 #Technology can have a tremendous #potential impact on #organizations, helping them achieve their strategic #goals and #objectives, however it takes more than an #implementation of one or more technologies to leverage that potential!
👇 tinyurl.com/4fwmwxf8
15.04.2025 19:47 — 👍 0 🔁 0 💬 0 📌 0

🧭Business Intelligence: Perspectives (Part XXIX: Navigating into the Unknown)
📢 𝗕𝗜: 𝗡𝗮𝘃𝗶𝗴𝗮𝘁𝗶𝗻𝗴 𝗶𝗻𝘁𝗼 𝘁𝗵𝗲 𝗨𝗻𝗸𝗻𝗼𝘄𝗻
"One of the important challenges in Business Intelligence [.] is that people try to oversell ideas, overstretching, shifting, mixing and bending the definition of concepts and their use to suit the sales pitch or other related purposes."
tinyurl.com/mtxtw84s
27.03.2025 12:16 — 👍 0 🔁 0 💬 0 📌 0

GitHub - microsoft/mssql-python
Contribute to microsoft/mssql-python development by creating an account on GitHub.
Microsoft are rewriting the SQL server driver for Python as a standalone package that doesn’t require ODBC. The new driver will be faster, async, and much easier to install. At the moment it’s a very early Alpha build but checkout the roadmap.
github.com/microsoft/ms...
10.03.2025 05:51 — 👍 48 🔁 9 💬 2 📌 0
📢 𝗕𝗜: 𝗖𝘂𝘁𝘁𝗶𝗻𝗴 𝘁𝗵𝗿𝗼𝘂𝗴𝗵 𝗖𝗼𝗺𝗽𝗹𝗲𝘅𝗶𝘁𝘆
👉 "Independently of the #complexity of the #problems, one should start by #framing the problem(s) correctly and this might take several steps and #iterations until a #foundation is achieved, upon which further steps can be based."
👇https://tinyurl.com/2fu2ehk8
10.03.2025 22:43 — 👍 1 🔁 0 💬 0 📌 0
🚧𝗦𝘁𝗮𝘁𝘂𝘀 𝗨𝗽𝗱𝗮𝘁𝗲: 𝗖𝗼𝗽𝗶𝗹𝗼𝘁
Until #Copilot for #SQLServer is ready, one can use #M365 or #Edge Copilot to #learn writing #code in #T-SQL. The starts are modest/error-prone, though enough for creating the basic scaffolds required for more complex #programming.
sql-troubles.blogspot.com/search/label...
06.03.2025 15:51 — 👍 1 🔁 1 💬 0 📌 0
🌌𝗞𝗤𝗟 𝗥𝗲𝗹𝗼𝗮𝗱𝗲𝗱: 𝗙𝗶𝗿𝘀𝘁 𝗦𝘁𝗲𝗽𝘀
I started a series of posts on #KQL, exemplifying its use from basic #queries and data types to #joins, #dataviz, #SQL to KQL translations and much more. All on sql-troubles.blogspot.com or follow the link.
tinyurl.com/284fafhx
19.02.2025 21:38 — 👍 0 🔁 0 💬 0 📌 0
📢 𝗕I: 𝗔 𝗧𝗮𝗹𝗲 𝗼𝗳 𝗧𝘄𝗼 𝗖𝗶𝘁𝗶𝗲𝘀
👉 "Do not try to rush things; ignore matters of minor advantage" but people love to rush in and make progress rapidly, respectively discuss minor things until they get exhausted.
👇https://tinyurl.com/5cf3dsjw
#dataanalytics #BI #dataviz #prototyping #processes #600words
17.02.2025 18:05 — 👍 1 🔁 0 💬 0 📌 0
📢 𝗕I: 𝗠𝗼𝗻𝗶𝘁𝗼𝗿𝗶𝗻𝗴 - 𝗔 𝗖𝗼𝗰𝗸𝗽𝗶𝘁 𝗩𝗶𝗲𝘄
👉 "The monitoring of business imperatives is sometimes compared [.] with piloting an airplane, where pilots look at the cockpit instruments to verify whether everything is under control and the flight ensues according to the expectations."
👇 tinyurl.com/yvkz4vbb
17.02.2025 15:50 — 👍 0 🔁 0 💬 0 📌 0
📅𝗘𝘃𝗲𝗻𝘁𝘀: 𝗗𝗮𝘁𝗮 𝗧𝗼𝗯𝗼𝗴𝗴𝗮𝗻 (𝗪𝗶𝗻𝘁𝗲𝗿 𝗘𝗱𝗶𝘁𝗶𝗼𝗻 𝟮𝟬𝟮𝟱)
#datatoboggan has great sessions on #MicrosoftFabric #SynapseAnalitics #FabSQL #PowerBI #LLMs #DeltaLake #Copilor #ADF and much more.
Join the fun, learn and interact!
#DataEngineering #DataManagement #DataAnalytics #BI #DataScience
14.01.2025 09:55 — 👍 2 🔁 0 💬 0 📌 1
🚧𝗦𝘁𝗮𝘁𝘂𝘀 𝗨𝗽𝗱𝗮𝘁𝗲: 𝗦𝗤𝗟 𝗗𝗯
I've spent the past 2 weeks looking at #SQLdatabase in #MicrosoftFabric reviewing old/new #features, incl. the #scripts created for standard #SQLServer and #SQLAzure. The results look promising, at least from features' perspective.
sql-troubles.blogspot.com/search/label...
08.01.2025 11:47 — 👍 1 🔁 0 💬 0 📌 0
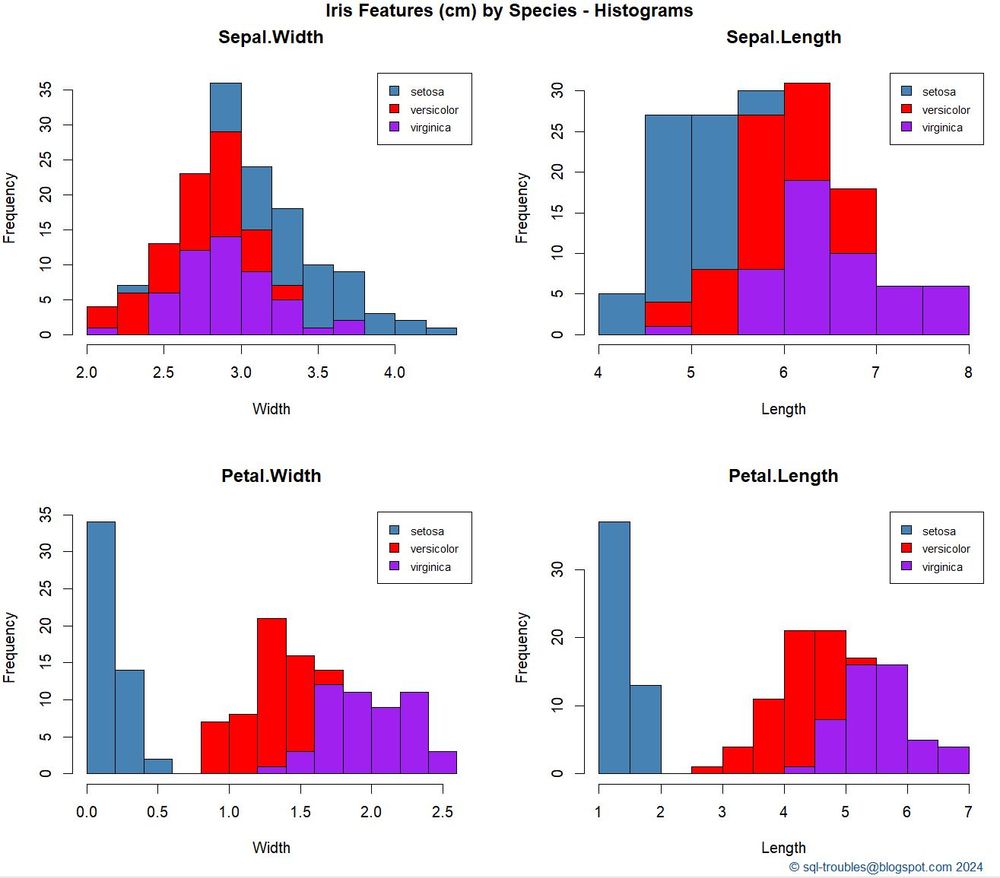
stacked histograms on the iris features prepared in R language
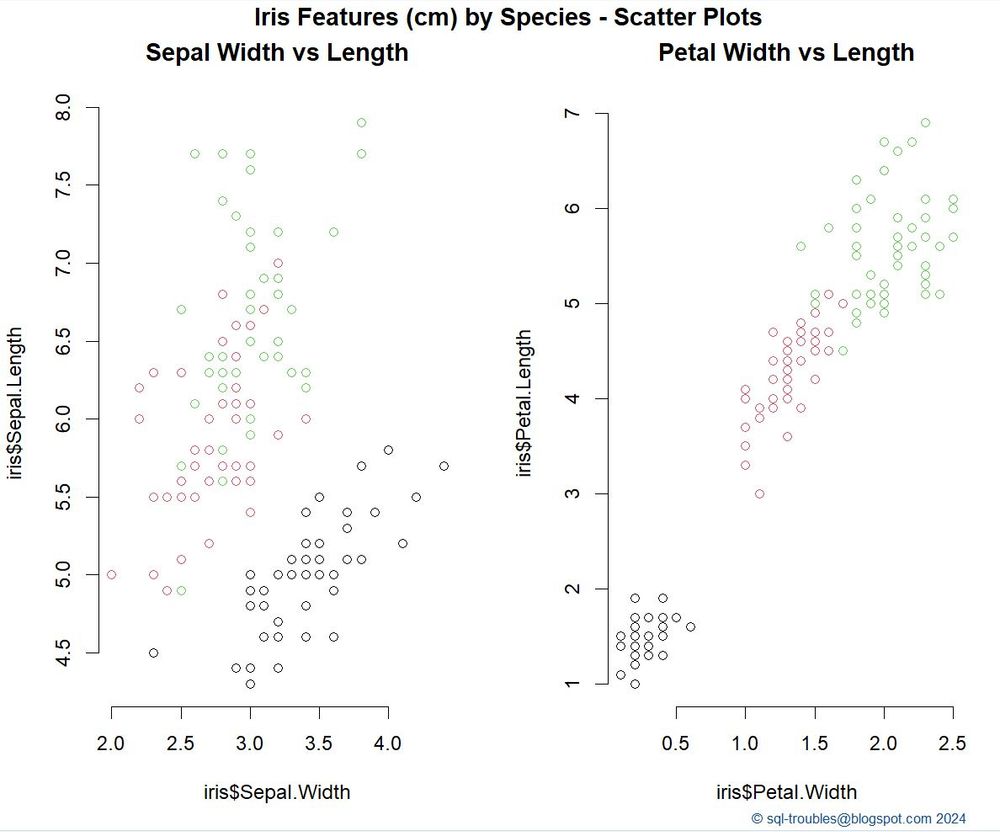
scatter plots on the iris features prepared in R language
📊𝗩𝗶𝘀𝘂𝗮𝗹𝗶𝘇𝗶𝗻𝗴 𝘁𝗵𝗲 𝗜𝗿𝗶𝘀 𝗗𝗮𝘁𝗮𝘀𝗲𝘁 𝗶𝗻 𝗥
The #dataviz on the Iris dataset are already a classical because it allows to exemplify how #visuals can provide different #perspectives into the same data, e.g. stacked #histograms (left) vs #scatterplots (right) in #rlanguage.
tinyurl.com/3j5a2kd5
17.12.2024 23:31 — 👍 1 🔁 0 💬 0 📌 0
Time to channel my network.
My current contract expires at the end of the month. So I am looking for new opportunities. Do you know anyone who can use a very experienced #SQLServer developer, specialized in query tuning? Please reach out!
Reposts appreciated. #OpenToWork
17.12.2024 09:41 — 👍 21 🔁 37 💬 3 📌 3

Course DP-700T00-A: Microsoft Fabric Data Engineer - Training
Course DP-700T00-A: Microsoft Fabric Data Engineer
An official free self-paced course for #DP700 Microsoft Fabric Data Engineer just got released by #MicrosoftLearn learn.microsoft.com/en-us/traini... Great job @shan-gsd.bsky.social and team!
17.12.2024 17:02 — 👍 13 🔁 7 💬 0 📌 0
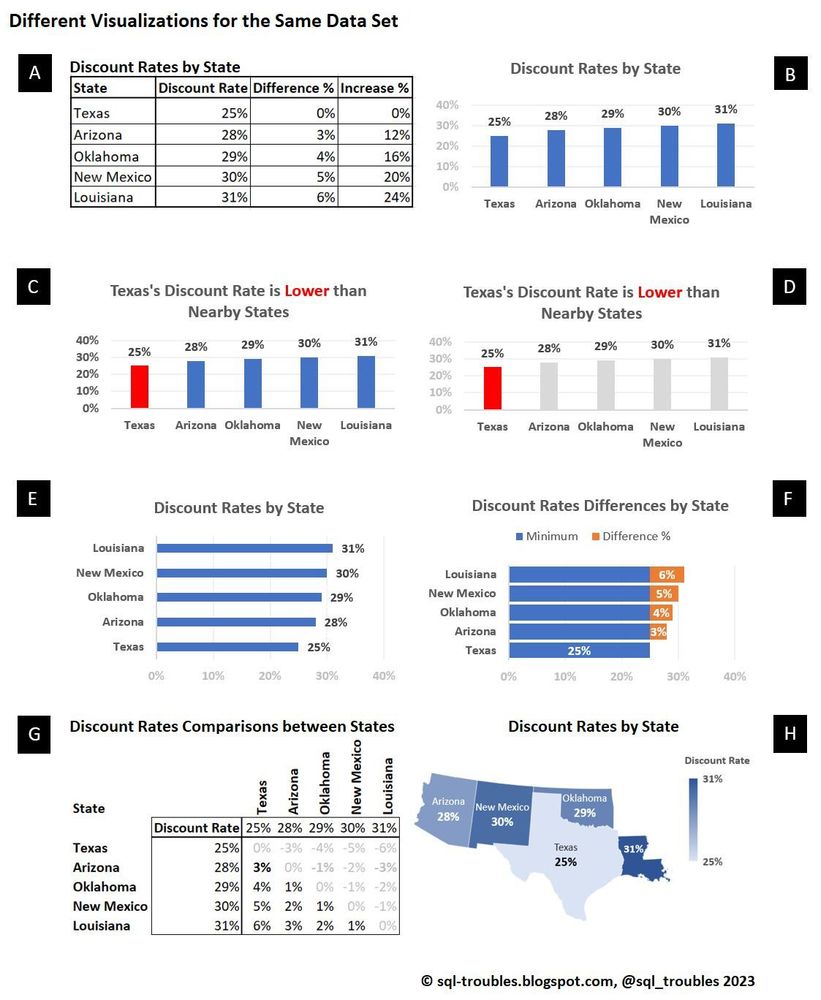
Different ways of displaying Exchange Rates in Microsoft Excel, though applicable to other visualizations tools as well.
📊𝗗𝗶𝘀𝗰𝗼𝘂𝗻𝘁 𝗥𝗮𝘁𝗲𝘀 𝗶𝗻 𝗠𝗦 𝗘𝘅𝗰𝗲𝗹
Which of the data visualizations would you prefer?
(A) a table is simple enough in many cases
(B), (C), (D) column charts
(E), (F) bar charts
(G) a matrix table is more appropriate for technical readers
(H) a choropleth map
#dataviz #Excel
tinyurl.com/5ybssn33
16.12.2024 01:42 — 👍 3 🔁 0 💬 0 📌 0
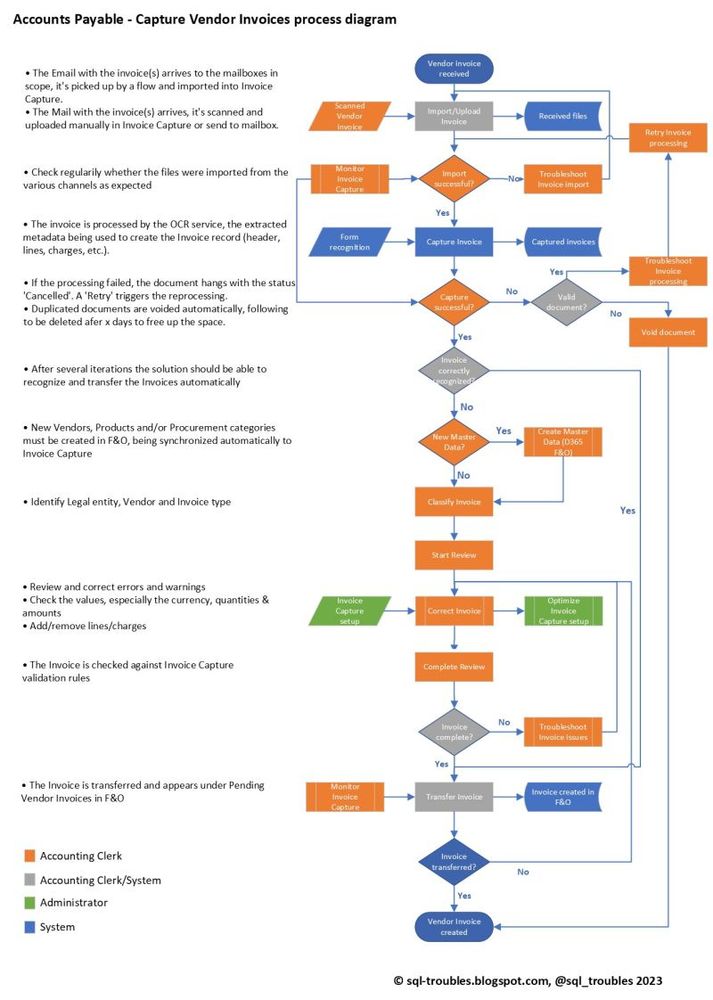
D365 Accounts Payables - Capture Vendor Invoices process diagram
🗺️𝗗𝘆𝗻𝗮𝗺𝗶𝗰𝘀 𝟯𝟲𝟱: 𝗖𝗮𝗽𝘁𝘂𝗿𝗲𝘀 𝗩𝗲𝗻𝗱𝗼𝗿 𝗜𝗻𝘃𝗼𝗶𝗰𝗲 - 𝗣𝗿𝗼𝗰𝗲𝘀𝘀 𝗗𝗶𝗮𝗴𝗿𝗮𝗺
The below process diagram attempts to depict the main steps performed in Dynamics 365 CRM, respectively F&O for importing automatically the vendor invoices received by email.
#D365F&O #D365CRM #AccountsPayables #VendorInvoices #automation
16.12.2024 01:29 — 👍 0 🔁 0 💬 0 📌 0
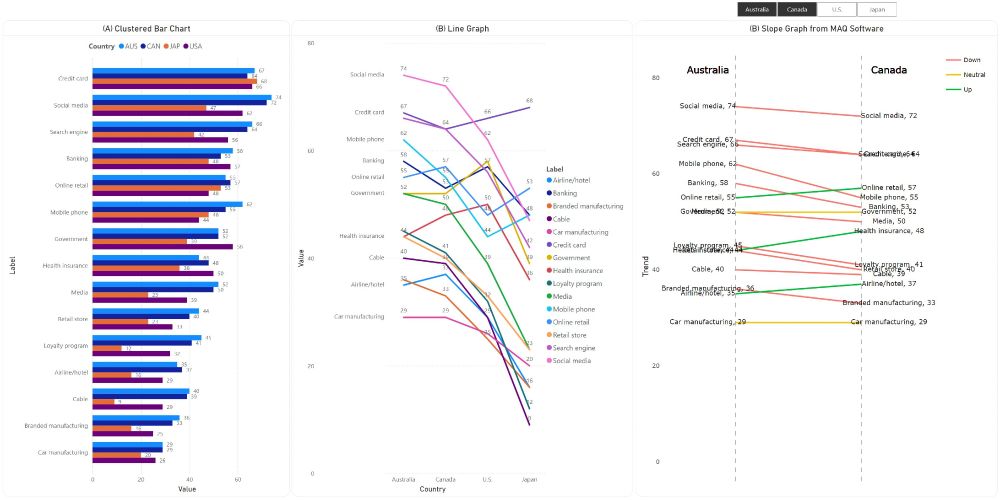
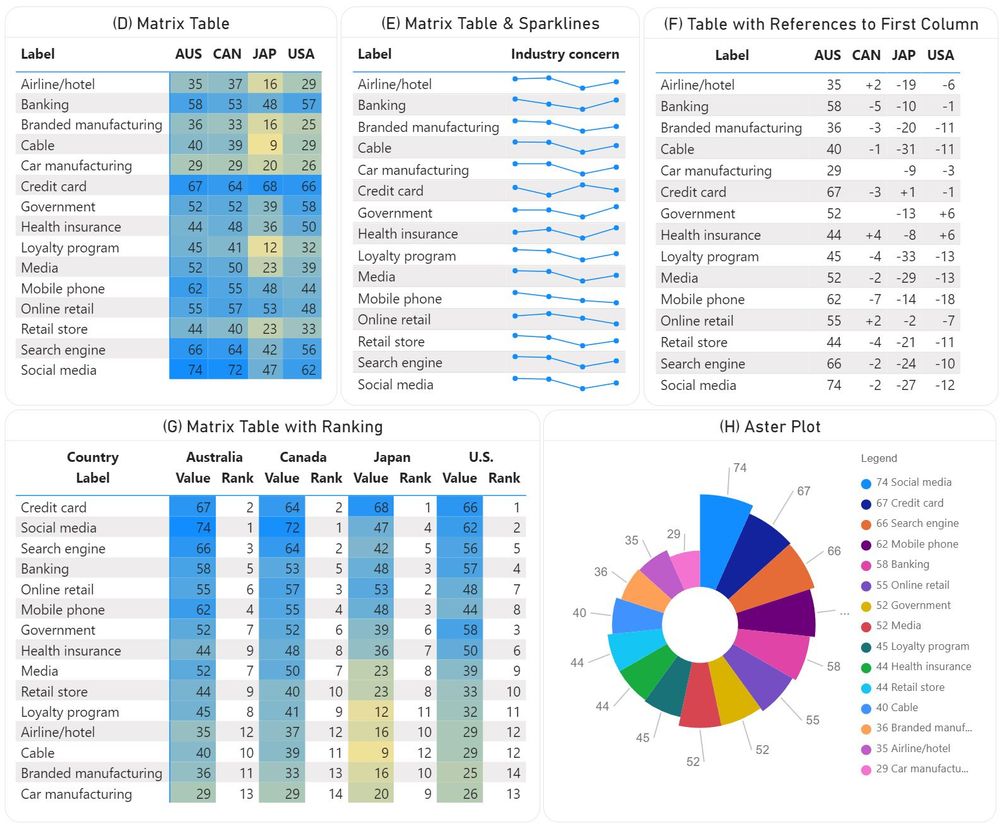
📊𝗟𝗶𝘀𝘁 𝗼𝗳 𝗜𝘁𝗲𝗺𝘀 𝗶𝗻 𝗣𝗼𝘄𝗲𝗿 𝗕𝗜
Clustered #barcharts seem to be often abused in #dataviz to compare the items from a cluster when line and slop graphs (B), respectively enhanced matrix #tables (D,E,F,G) and #aster plots (H) can occasionally do a better job.
#PowerBI
tinyurl.com/y2tjkbbv
16.12.2024 01:09 — 👍 0 🔁 0 💬 0 📌 0
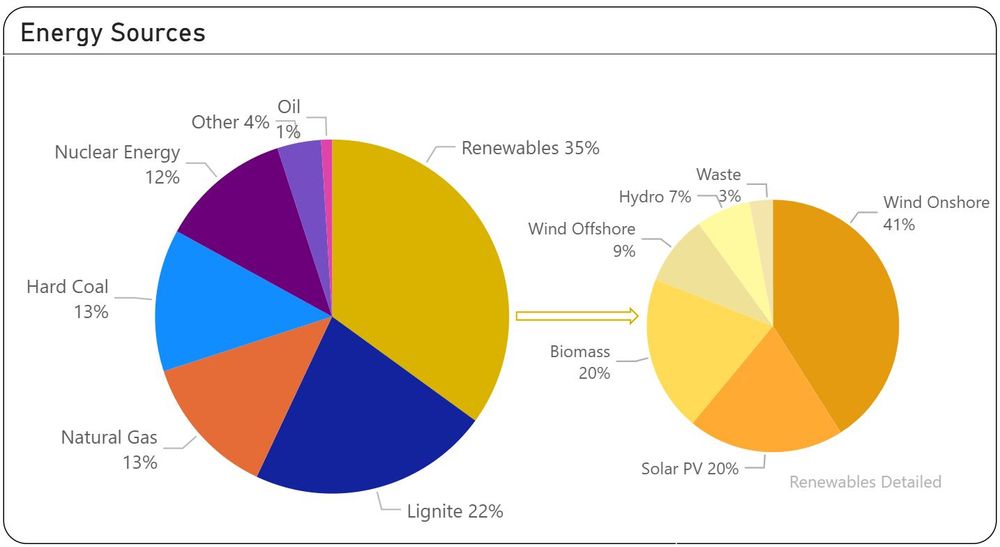
Pie of Pie example in Power BI - depiction of energy sources where renewables is further detailed in a second pie chart.
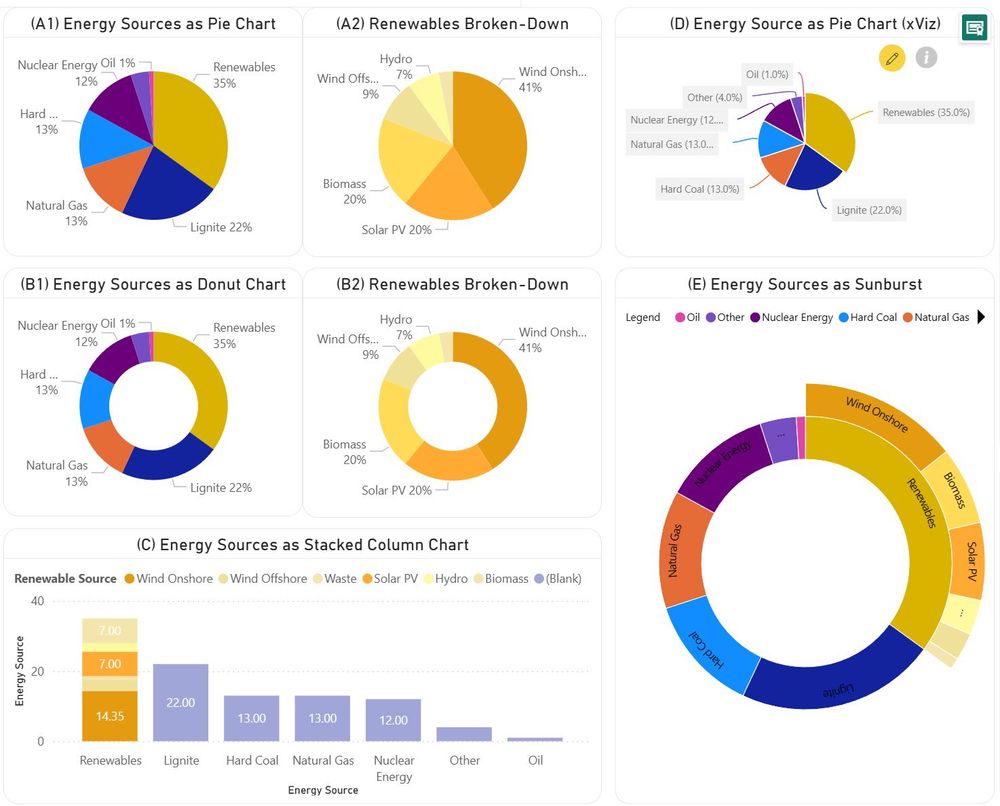
Different ways of visualizing the data from a Pie of Pie using pie charts (A,(A), donut chart (B), stacked column chart (C), respectively sunburst (E). (D) provides an alternative to the old-fashioned visual in which the main slice is highlighted.
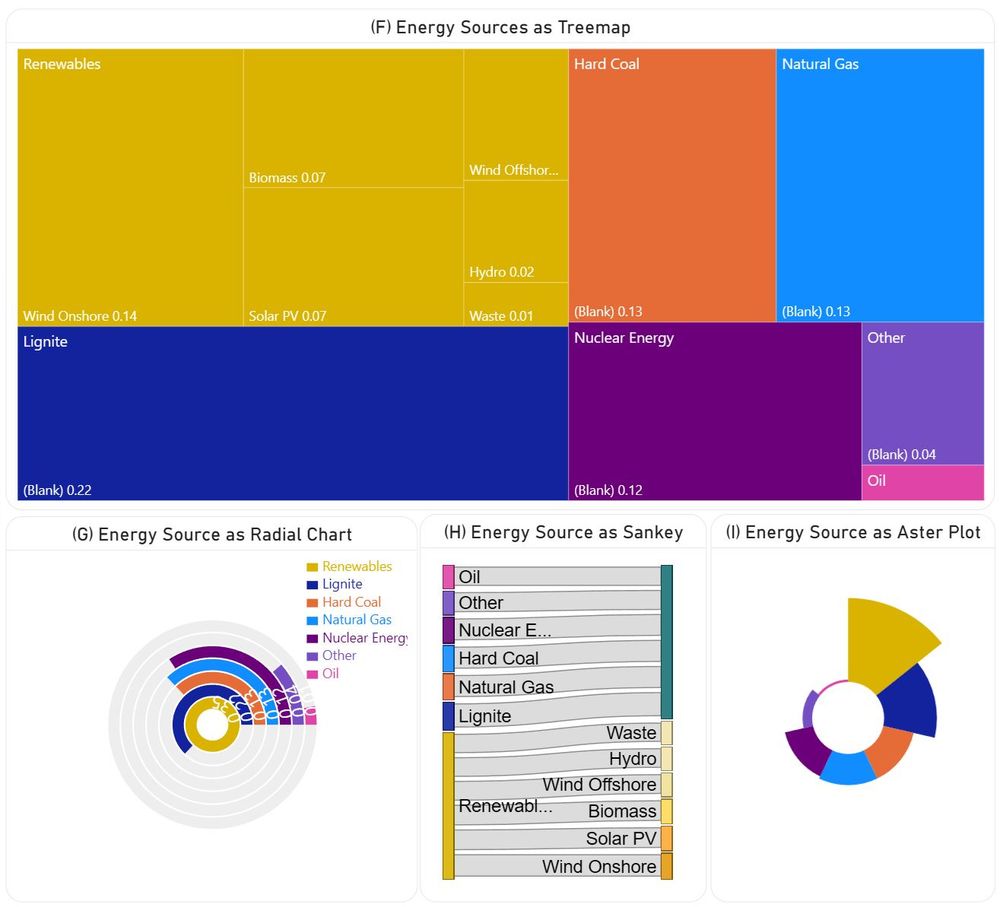
Different ways of visualizing the data from a Pie of Pie using treemap (F), radial chart (G), Sankey chart (H), respectively Aster plot (I).
📊𝗣𝗶𝗲 𝗮𝗻𝗱 𝗗𝗼𝗻𝘂𝘁 𝗖𝗵𝗮𝗿𝘁𝘀 𝗶𝗻 𝗣𝗼𝘄𝗲𝗿 𝗕𝗜
There are many voices against the use of pie and donut #charts, though they have their place in #dataviz. However, one should consider also the alternatives, when appropriate.
#PowerBI #piechart #donut #treemap #sankey #aster #radialchart
tinyurl.com/5fkcys5f
16.12.2024 00:50 — 👍 0 🔁 0 💬 0 📌 0
I am a professor of tropical ecology at the University of York. I have a passion for Mountain ecosystems and cultures across the Global South, particularly in Kenya and Tanzania where I work with many Universities, NGOs and Government organisations.
chinese-american artist, software engineer, dataviz designer, keynote speaker, published author && a work-in-progress learning to take up space ✨
🔗 shirleywu.studio
💞Chief Troublemaker for @Microsoft #AI #Copilot #Agents Extensibility + #CopilotLearningHub⚡️Code-blooded beast 🤷🏽♀️@FastCompany Most Productive 🧠NeurodivergentAF
😹 I WILL volunTELL you at some point
Code | Test | Deploy | Get paged
Data streaming, Machine Learning and AI app intensive Systems
MS Fabric CAT PM. Posts are my own not my employer’s.
Anxious af. He/him. Posts my own thoughts, not works.
Director of product for Microsoft OneLake. Formally worked on SQL Server Analysis Services and Power BI. Opinions are my own.
universally beloved author
www.danozzi.com
linktr.ee/danozzi
MTB, Cosmos DB, and Guild Wars. Did a lot of SQL performance tuning.
Lead Documentarian for PowerShell at Microsoft. Technical Communicator. Teacher. PowerShell champ.
Blog: https://sdwheeler.github.io/sdwheeler/seanonit
Making memes, dreams, & software!
Sr. Director of Dev Advocacy at GitHub. Married to a dweeb and mom to a nerdy toddler + baby combo. She/Her ✝️ CHI 🏠
Subscribe to my newsletter!
cassidoo.co/newsletter
Your least favorite account’s favorite account. She/her.
Research Data Management Consultant | cghlewis.com
Co-organizer @r-ladies-stl.bsky.social
Co-organizer POWER Data Management Hub | https://osf.io/ap3tk/
Author of DMLSER: https://datamgmtinedresearch.com/
RDM Weekly: https://rdmweekly.substack.com/
Same me, another platform. I code stuff. It usually involves some Maths. I enjoy music mandatory religion classes warned me about. And other things that may kill me.
https://thebabydino.github.io/
Data geek who loves puzzles that turn the rows into the answers, especially via Power BI.
She/her
Equestrian & cat lady, I work hard to give my animals a good life.
Can we have class outside?
Data Architect | Fabric | Power BI | Power Platform. I like code.
Husband, father, grandfather, Fabric Data Factory, ADF, and SSIS guy, data engineer, author, consultant, slave for Jesus (Romans 1:1) http://linktr.ee/AndyLeonard
Microsoft MVP - BlazorHelpWebsite.com - BlazorData.net - AIStoryBuilders.com (He/Him) - #Blazor - 💙- #Resistance - #NoICE
Googler, ex-MSFT. All things data and AI.


