Ab der 2. Flugreise stark progressiv besteuern!
04.04.2025 08:14 — 👍 0 🔁 0 💬 0 📌 0
Podcast: So wurde Grasser bestochen
Das Geständnis seines Komplizen Peter Hochegger – Folge #1355
Ein Podcast, den man echt gehört haben muss
Peter Hochegger im Gespräch mit @klenkflorian.bsky.social darüber wie in Ö Korruption funktioniert. Eigentlich ist das schon True Crime. Große Empfehlung!
www.falter.at/podcasts/rad...
03.04.2025 09:26 — 👍 182 🔁 38 💬 11 📌 1
It's here.
Pit in stomach feeling.
www.theguardian.com/commentisfre...
02.04.2025 10:29 — 👍 654 🔁 200 💬 32 📌 50
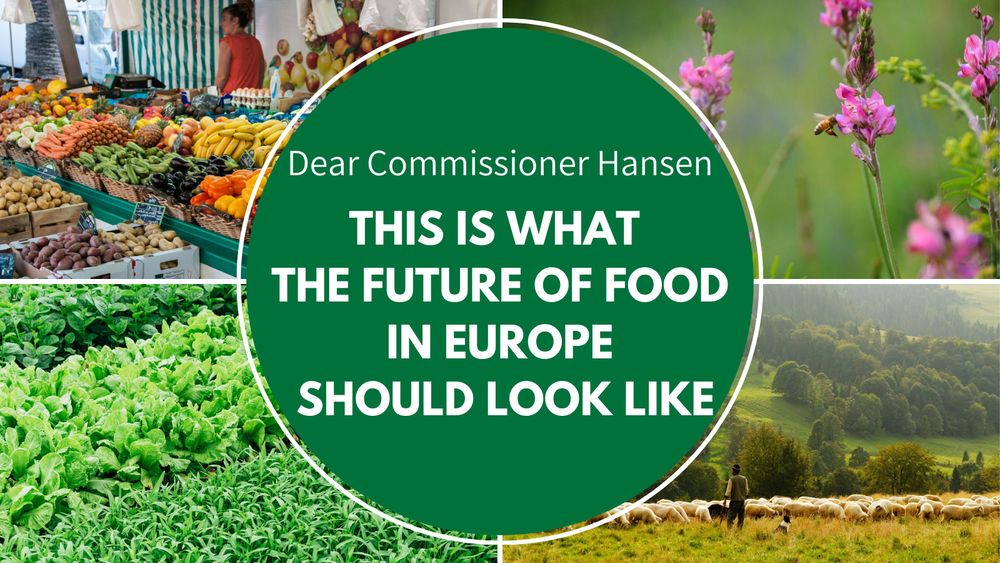
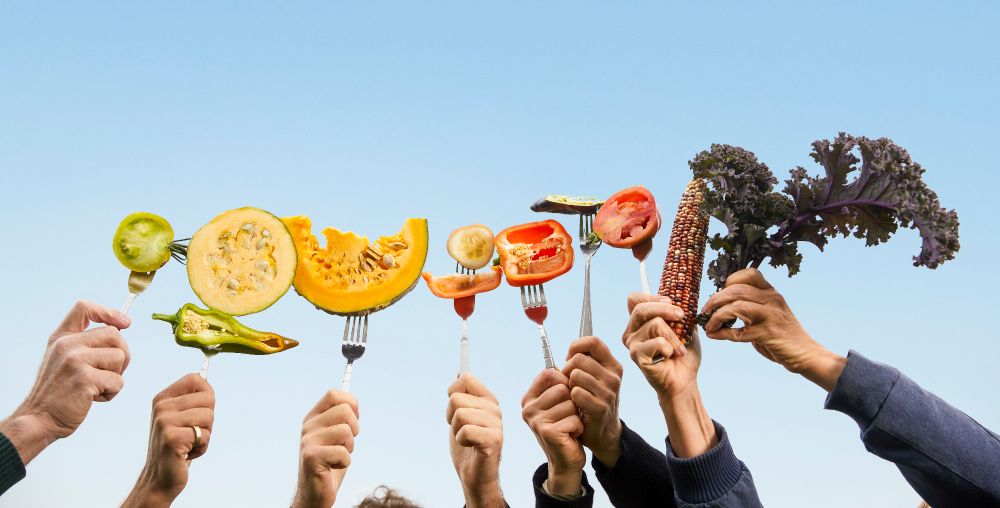
🌍🍽️ A better food and farming system is possible!
The upcoming EU Vision must support farmers in transitioning to #ClimateResilient, #NatureFriendly farming while ensuring healthy, sustainable food for all.
@christophehansen.bsky.social: Let’s get this right!
Letter➡️ bit.ly/3OLFjql
13.02.2025 11:43 — 👍 3 🔁 1 💬 0 📌 0
Hi Camille, thanks for setting this up, can you please add me, @arche-noah.bsky.social and @axelgrunt.bsky.social? Thanks a lot!
14.02.2025 13:43 — 👍 2 🔁 0 💬 1 📌 0
„Today we produce more food per person than ever before. Yet hunger and malnutrition persist in every corner of the globe.“
Ramping up food production is not the solution. Must read:
14.02.2025 10:18 — 👍 3 🔁 2 💬 0 📌 0
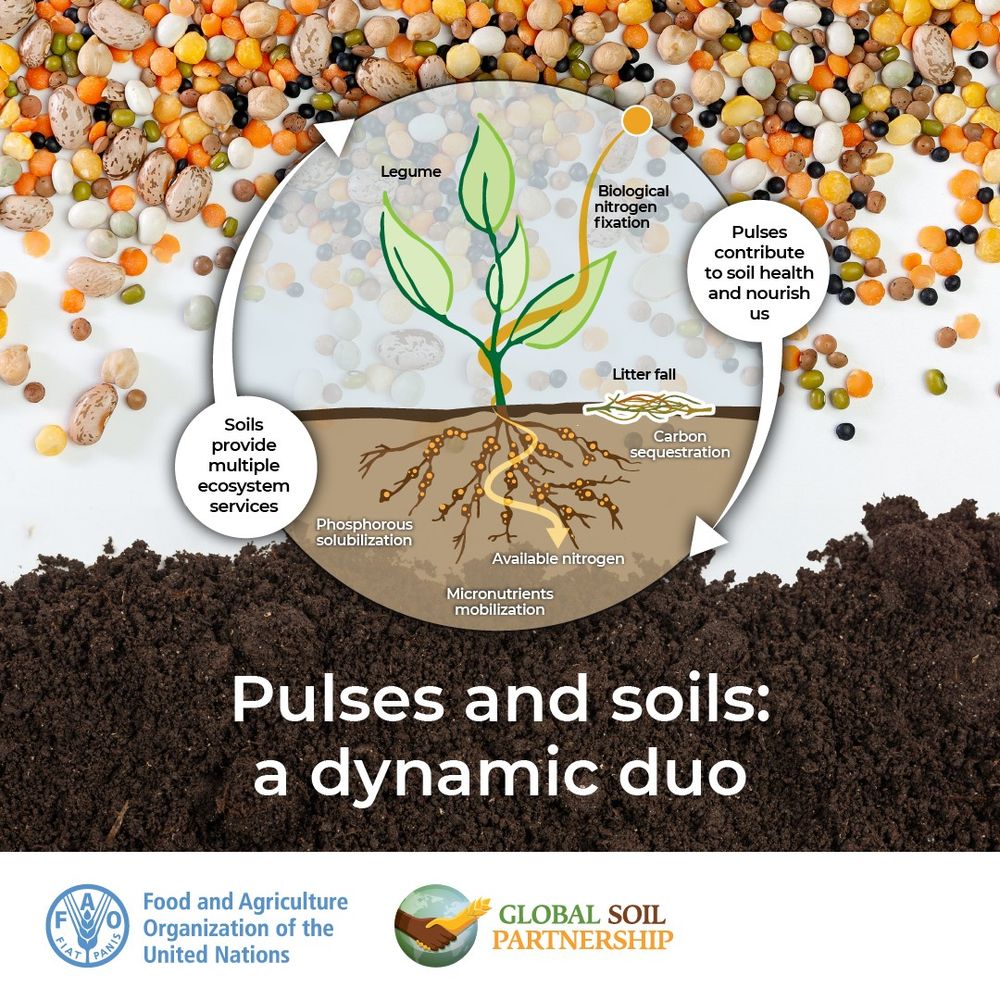
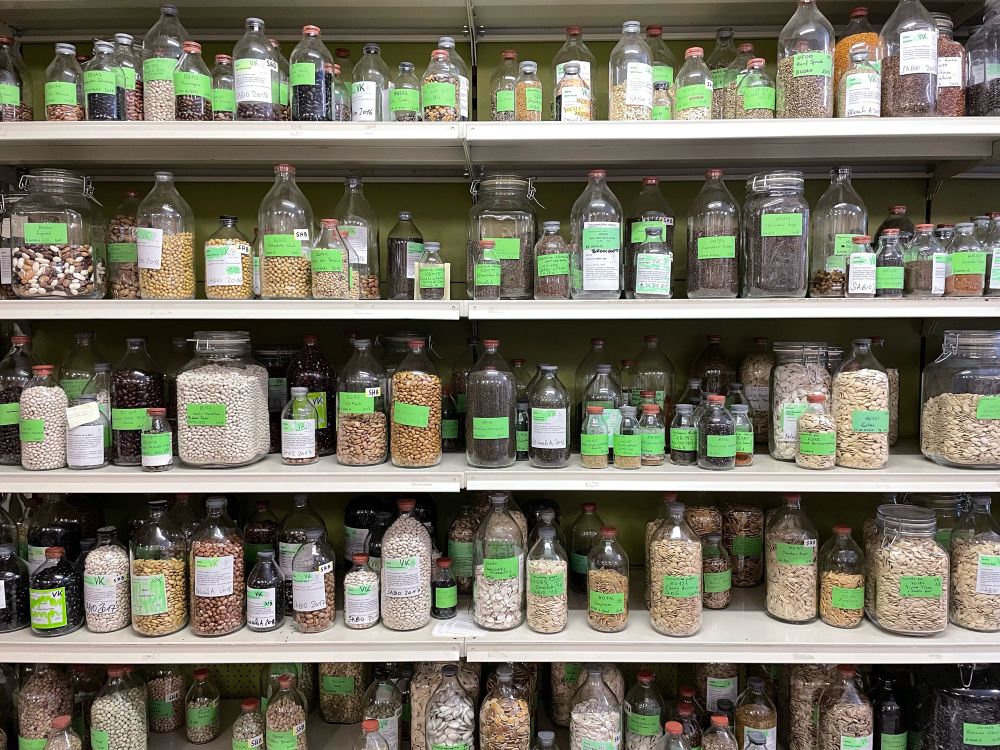
An infographic from FAO showing the positive relationship between pulses contributing to soil health and healthy soil providing ecosystem services in return.
🌿 Pulses and soils: a dynamic duo that sustain one another! 🌍🧪
Pulses improve soil health and well-maintained soils allow pulses to thrive.
For #WorldPulsesDay, explore this complementary relationship with @fao.org⤵️ #SaveSoil
10.02.2025 08:56 — 👍 72 🔁 22 💬 0 📌 1
ARCHE NOAH verstärkt ihr Team. Zwei super Jobs an den spannendsten Orten Europas werden neu besetzt: eine Campaigner-Stelle für Saatgutpolitik in Brüssel und eine Stelle im Herzstück unserer Organisation, im größten privaten Samenarchiv Europas in Schiltern im Waldviertel. Details dazu im Netz.
09.12.2024 20:24 — 👍 10 🔁 4 💬 0 📌 1
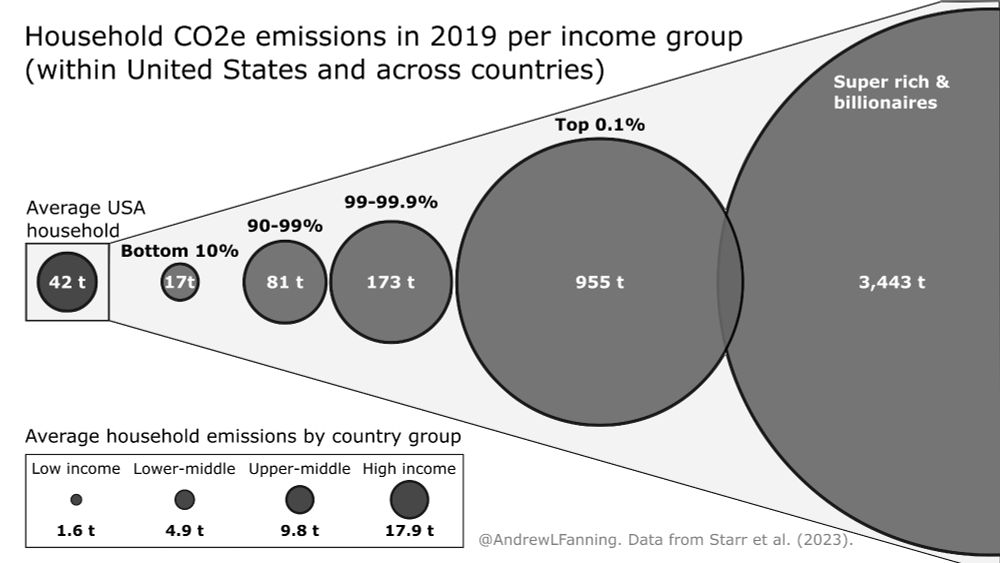
An infographic entitled 'Household CO2e emissions in 2019 per income group (within United States and across countries)'. The graphic uses different-sized bubbles to show household carbon dioxide-equivalent emissions between across countries groups (low-income, lower-middle, upper-middle, and high-income), and also within the United States (bottom 10%, 90-99%, 99.9%, and super-rich & billionaires). Emissions values shown range from a tiny bubble representing 1.6 tonnes of CO2e per household in low-income countries to a huge bubble extending beyond the chart area representing nearly 3,500 tonnes per household among US-based super-rich & billionaires. Image by @AndrewLFanning using data from Starr et al. (2023).
You need to see shocking extent of carbon inequality around the world.
A remarkable study led by Jared Starr finds that super-rich US households emit *2000 TIMES* more CO2e than average low-income country households.
How the f*ck is that even possible? The disparity never ceases to enrage me.
30.11.2024 19:41 — 👍 614 🔁 287 💬 31 📌 37
SAFE is a non-profit independent organisation aimed at ensuring that consumers' health and concerns stay at the core of EU food legislation.
www.safefoodadvocacy.eu
Politischer Content aus Deutschland und der Welt. Analysen, Meinungen und Diskussionen zu politischen Themen. Politik ist Kunst.
Political content from Germany and around the world. Analyses, opinions and discussions on political issues. Politics is art.
codirectrice de @institut-veblen.bsky.social
coauteure de Chroniques critiques de l'Eco @franceculture.fr et Après le libre échange @lespetitsmatins.bsky.social
Chroniqueuse @altereco.bsky.social
ex @ccfd-tsolidaire.bsky.social
www.veblen-institute.org
Campaigner for @corporateeurope.org Working on #PFAS #BigToxics #Chemicals #Deregulation #LobbyFacts #PrivilegedAccess
She/her
Human, enjoys debate, 🤘 rock gigs, humour, 🏊♂️, ⛷️, 🤿, 🍴 & 🐺 FC.
Citizen of 🌎, 🇮🇪, 🇪🇺 & 🇬🇧. Work @Oakfnd. Trying to learn French. Les vues ici sont les miennes. Mostly in Geneva & Twickenham
Researcher at @iiasa.ac.at || land use modeling | biodiversity | climate change || Views are my own
We envision a world where the economy works for all. We work to make supply chains more fair and sustainable for small-scale farmers, workers and miners.
Visit www.solidaridadnetwork.org
Working on food, agriculture, resource justice @foeeurope.bsky.social - Loves social movements, intersectional feminism and emergent strategy
Be kind to animals. Work with food policy at Eurogroup for Animals. Own views (but shared by many!). Vegan since before it was cool.
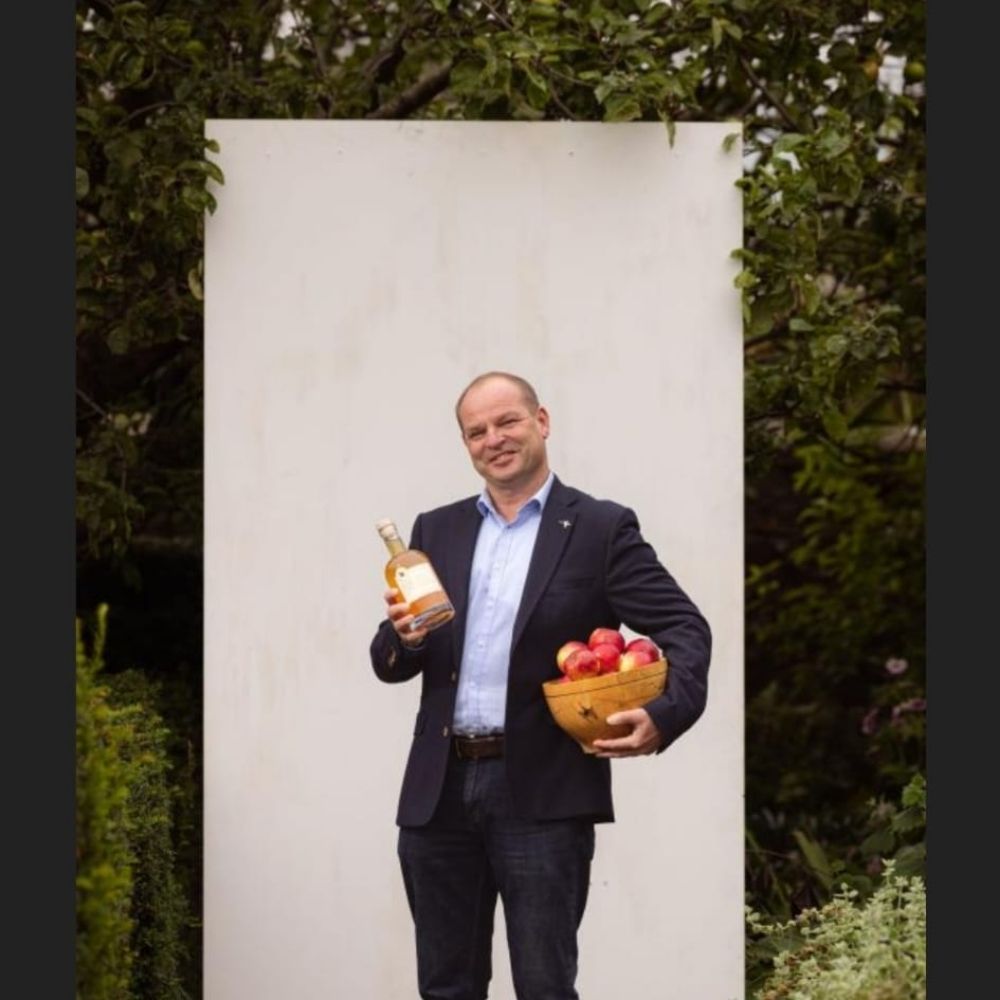
Fruit Grower. University Lecturer. Horticultural Scientist. Drinks Manufacturer (juices, cider, spirits). Sustainable Food Production Systems. Statistics hobbyist.
General Secretary of EFFAT (@effat.org), the European Federation of Food, Agriculture, and Tourism Trade Unions, also representing Domestic Workers.
Posts are personal views.
International and Institutional Relations Manager at the Fair Trade Advocacy Office #FairTradeMovement
"Food Sovereignty" policy officer CNCD-11.11.11
#FoodSovereignty #Agroecology #ClimateJustice
Views are mine
Working for the future of agriculture & food 🌱 • Secretary General of CEJA & Guest Lecturer on European Affairs at Sciences Po Lille • 🇫🇷&🇪🇺citizen
A global voice for the Sustainable Food Movement, founded by Patrick Holden. Working to accelerate the transition to more sustainable food and farming.
🔗 https://sustainablefoodtrust.org
Sociologist of the food system at the University of Copenhagen, interest in food poverty and food access, lapsed Fed, lapsed philosopher, lapsed baptist, lapsed Texan, Malmönian, he, him, his. My avian friends mostly keep me from going off my rocker. 🇵🇸🇱🇧
Professor Emeritus of European Agricultural Policy, Trinity College Dublin, Ireland with interests in agricultural policy, trade, climate and Brexit.
Diana Smith. Interested in better conversations. Co-ordinator for Rethink Food. Working with farmers, councils and community towards Staffordshire good food movement. Looking at the future of food, health, local economy, stronger communities.
💚 Lawyer4Future+Environmentalist + European
🐧 Head of Office NABU Brussels + Greens
✊️ #ActNow on Climate + #RestoreNature
🇪🇺 #EUGreenDeal + #RuleOfLaw + #EUBudget
🧭 #LessIsMore = Sufficiency
🐦 No more XTwitter. Also on #Mastodon/IG