Fig. 3. Percentage of reads attributed to carabid, prey and other for Nebria salina and Poecilus cupreus for samples from 2013 to 2019 and 2021. Colors distinguish between (a) prey reads (green), (b) carabid reads (blue) and (c) other reads (contaminants and not assigned – orange). Proportions are given as percentages of the total number per sample (after filtering the singletons).

Fig. 5. Prey diversity in the diet of Nebria salina (a) and Poecilus cupreus (b) through time. Each dot represents the diet of one carabid specimens, dots are jittered horizontally and vertically for more clarity. The curve corresponds to a linear regression with the grey area displaying the 95 % confidence interval.
🪲 New BAAE article:
Metabarcoding of stored carabid beetles reveals declining prey diversity over the last decade. Temporal diet shifts highlight long-term invertebrate declines and the value of historical collections for monitoring.
DOI: doi.org/10.1016/j.ba...
@gfoesoc.bsky.social
11.02.2026 07:00 — 👍 12 🔁 8 💬 0 📌 0

Figure 2. (A) Globally threatened species richness in quarter-degree grid cells in Mozambique. Threatened species include those listed as ‘Critically Endangered’, ‘Endangered’, or ‘Vulnerable’ on the IUCN Red List (IUCN, 2024). (B) Proportion of open-habitat species in quarter-degree grid cells. Open-habitat species are those primarily associated with deserts, grasslands, open water, low shrubs, rocky habitats, seashores, urban areas, or the forest canopy (Tobias et al., 2022). (C) Proportion of large-range species in quarter-degree grid cells. Large-range species are defined as those with distribution ranges exceeding 15 million km² (Tobias et al., 2022).
🦜 New BAAE article:
In Mozambique, bird diversity peaks at intermediate farmland in savannas but declines in rainforests. Farmland expansion favors widespread species, threatening biodiversity. Biome-specific strategies are needed for conservation.
DOI: doi.org/10.1016/j.ba...
@gfoesoc.bsky.social
09.02.2026 07:01 — 👍 4 🔁 1 💬 0 📌 0

🌱🪱 New BAAE article:
Three pathways regulate soil micro-food webs under global change. Heavy metals cut nematodes by 76%, acid rain boosts them. Nematodes actively regulate ecosystem stress; soil acidification is a key driver.
DOI: doi.org/10.1016/j.ba...
@gfoesoc.bsky.social
06.02.2026 07:01 — 👍 1 🔁 1 💬 0 📌 0

Fig. 1. Analytical workflow from community data processing to LCBD and Boosted Regression Trees (BRTs) results.

Fig. 2. Maps for the U.S. showing the local contribution to beta diversity (sesLCBD). (a) Watersheds without nonnatives (sesLCBDhistorical); (b) with nonnatives in LCBD (sesLCBDpresent).
🌊New BAAE article:
High-altitude watersheds are vulnerable to invasion. Nonnative species strongly drive declines in Local Contributions to Beta Diversity. Prioritize high-LCBD, low-richness-distinct, and low-FOri communities for conservation.
DOI: doi.org/10.1016/j.ba...
@gfoesoc.bsky.social
04.02.2026 07:01 — 👍 3 🔁 2 💬 0 📌 0


New article led by Evan T. Sloan🐝
Pollen metabarcoding shows strong preference for Cichorioideae in the specialist bee Osmia leaiana.
Foraging patterns are driven by local flower abundance and nearby semi-natural grasslands.
www.sciencedirect.com/science/arti...
@basicapplecol.bsky.social
03.02.2026 07:27 — 👍 7 🔁 3 💬 2 📌 0

Fig. 1. Thinned Hooded Vulture occurrence records January 2015 – June 2024, land cover, annual mean temperature and precipitation across the study area (East Africa).

Fig. 5. Hooded Vulture response to (a) Annual Mean Temperature, (b) Annual Precipitation, (c) Precipitation Seasonality (CV: Coefficient of Variation), (d) Precipitation of Driest Quarter, (e) Precipitation of Warmest Quarter, (f) Isothermality, (g) Temperature Seasonality (SD × 100: Standard Deviation), (h) Temperature Annual Range, and (i) Elevation by GLM, Maxent, RF and eSDMs.
🦅🌍 New BAAE article:
Hooded Vultures in East Africa occupy only 12% of the landscape. Climate, elevation, and land cover shape their distribution. Conservation beyond protected areas is urgent to safeguard this declining species.
DOI:https://doi.org/10.1016/j.baae.2025.12.010
@gfoesoc.bsky.social
02.02.2026 07:00 — 👍 1 🔁 2 💬 0 📌 0

The slope of the red line shows the shift in the onset of flowering as a function of temperature over the spatial gradient and the slope of the blue line shows the shift over the temporal gradient in Vienna. The gray area represents the 95 % confidence interval for both linear regressions, overlapping across the entire possible range. The linear regressions run nearly parallel to each other, illustrating the similarity between both methods. The dots combine mean temperature (x-axis) and flowering time (y-axis) within a year. The boxes represent the temperature ranges of the respective gardens and years.
🌸 New #BAAE article: Flowering shifts response to temperature.
Early-flowering species advance ~7 days per 1°C increase & space-for-time substitutions work well for general patterns but species-specific caution is needed.
DOI:https://doi.org/10.1016/j.baae.2025.10.007
@gfoesoc.bsky.social
30.01.2026 07:01 — 👍 3 🔁 1 💬 0 📌 0

We are excited to present to you the keynote speakers of #NSO2026 and #gfoe2026! First off is @jessicakabbott.bsky.social, professor of evolutionary genetics at @lund-university.bsky.social, Sweden. She works on the evolution of sex differences and sex chromosomes.
@gfoesoc.bsky.social
28.01.2026 13:18 — 👍 9 🔁 4 💬 1 📌 0

Fig. 1. Distribution of the study sites in the municipalities of Jardín and Andes in Colombia. Red dots represent the sun coffee system, the yellow triangles the coffee-plantain intercropping, and the green squares the shade coffee system.

Fig. 2. A) Experimental block. Exclusion treatments from left to right: ant and bird exclosure, bird exclosure, ant exclosure, and open control. B) Exclosure treatments: B1) Grease applied on coffee shrubs to exclude ants. B2) Exclosure treatments and control. B3) Setting up exclosure treatments.
☕🐦 New BAAE article:
Birds and ants interact to control coffee berry borer in Colombian coffee farms. Shade coffee and crop diversification enhance natural pest control, showing biodiversity can boost pest management.
DOI:https://doi.org/10.1016/j.baae.2025.11.002
@gfoesoc.bsky.social
28.01.2026 07:00 — 👍 4 🔁 1 💬 0 📌 0

Fig. 1. Estimated probability of fruit set for Pink Lady apples across different pollination treatments. Points represent model-predicted posterior means (±95% credible intervals). “Control” refers to open-pollinated flowers exposed to natural pollination, “Emasculation” to flowers with anthers removed to prevent self-pollen deposition, “Self-pollination” to hand-pollinated flowers using pollen from the same cultivar, and “Spontaneous” to flowers bagged throughout anthesis to test autonomous self-pollination. The other treatments represent the cultivar used to hand-pollinate the flowers. Fruit set was modelled as a binary response (1 = fruit set, 0 = no fruit set).

Fig. 2. Fruit weight and seed quality of Pink Lady apples. (A) Estimated fruit weight (g) and (B) estimated proportion of well-formed seeds for fruits that developed following different pollen-donor treatments: Control (open pollination), or hand-pollination with pollen from Fuji, Royal Gala, Granny Smith, or Kanzi. Dots represent individual fruit/seed measurements, while larger filled circles and error bars show model-predicted means ± 95% credible intervals from Bayesian mixed-effects models.
🍎🐝 New BAAE article:
In apples, pollen donor identity strongly affects fruit set, weight & seed quality. Choosing high-performing donors (beyond basic compatibility) can boost orchard productivity and fruit quality.
DOI: doi.org/10.1016/j.ba...
@gfoesoc.bsky.social
26.01.2026 07:00 — 👍 2 🔁 1 💬 0 📌 0
The first LUNCHBOX MODELS Event is happening next Wednesday 28th January at 12PM!!
Find out more about the Event: www.yomos.org/lunchbox-mod...
@yomoseco.bsky.social
22.01.2026 14:16 — 👍 3 🔁 5 💬 0 📌 0


Three funded PhD positions on Geo-Biosphere Interactions in the South African Fynbos biome @terra-cluster.org 🪴⛰️
Please RT and forward to suitable candidates.
Link: bwsyncandshare.kit.edu/s/67A6Kx7MLf...
13.01.2026 07:08 — 👍 7 🔁 5 💬 1 📌 0

Fig. 1. Conceptual diagram of the relationships among the social-ecological dimensions of urban soundscapes. Urban soundscape characteristics likely are influenced by urban green space vegetation structure, which in turn influences biodiversity. Furthermore, urban soundscapes relate to dimensions of acoustic comfort and human wellbeing (restoration). Key for urban planning is to identify places of high biodiversity, acoustic comfort and restoration with positive effects on human wellbeing that can be equitably promoted in planning and sound-based policies. Graphic by Sophie Arzberger.

Fig. 2. Research sites in the inner city of Munich, Germany (as delineated by black line) where sound recordings took place (circles, squares, diamonds) as well as soundwalk routes took place (colored lines). Graphic by Sophie Arzberger.
🌳🎶 New BAAE article:
The CitySoundscapes pilot links urban soundscapes, bird diversity, and human well-being. Methods combining ecology, psychology & planning show how green space structure supports biodiversity and acoustic comfort.
DOI: doi.org/10.1016/j.ba...
@gfoesoc.bsky.social
22.01.2026 07:00 — 👍 6 🔁 3 💬 0 📌 0
Great news 🎉
The deadline for Thematic Session proposals for NSO-GFÖ-conference has been extended! Submit your proposals until 31. January!
We are excited to see all of you in Odense in September!
Guidelines: vist.ly/4nbus
Submit: vist.ly/4nbuv
21.01.2026 13:29 — 👍 5 🔁 3 💬 1 📌 0

Effect of tillage regime and distance from field margin on (a) overall ground beetle activity density and (b) Pterostichus melas activity density, with 95 % confidence intervals.

Effect of tillage regime on the number of ground beetle species by trap, with 95 % confidence intervals. Different letters indicate statistically significant differences according to post-hoc pairwise comparisons with Tukey adjustment.
🌾🐞 New #BAAE article: Conservation tillage boosts ground beetle abundance & richness.
But drought and seed-predator dynamics complicate weed control—highlighting smarter strategies for climate-ready farming. 🌱🌦️
DOI:https://doi.org/10.1016/j.baae.2025.11.001
@gfoesoc.bsky.social
21.01.2026 07:00 — 👍 2 🔁 2 💬 0 📌 0

Fig. 1. Map of the city of Munich in Southern Germany consisting of over 10,300 blocks including built-up area (white areas) and urban green spaces such as parks, cemeteries, green belt or conservation areas (green areas). Black areas represent 90 residential blocks selected for sampling. Data on block geometries and green spaces were provided by the Municipal Department of the City of Munich.

Fig. 2. Partial effects of the percentage of total vegetation cover (left), vegetation of 1–5 m height (middle) and vegetation of > 10 m height (right) on bird diversity (A–I), based on mixed effect models, and on abundance (J–L) based on generalized linear models. Hill numbers were used as diversity measures, with order q = 0 equaling species richness and orders q = 1 and q = 2 being interpreted as the effective number of common and abundant species, respectively. Thin lines without confidence bands indicate non–significant effects. The percentages of vegetation of 1–5 m height and vegetation > 10 m height were square-root transformed, but their effects are shown on the original scales.
🌳🪶 New BAAE article:
Urban vegetation boosts bird diversity in Munich. Total vegetation cover, especially large trees, drives rare species, while distance to green spaces matters less. ≥10–20% cover benefits biodiversity and human well-being.
DOI: doi.org/10.1016/j.ba...
@gfoesoc.bsky.social
20.01.2026 07:00 — 👍 3 🔁 1 💬 0 📌 0

A framework of human-driven disturbance hypothesis illustrating the predicted relationships between species richness and island area and between species richness and available habitat area across different island groups in the context of human disturbances. (A) The distribution and diversity of species on small islands; (B) The relationship between species richness and island area on islands; (C) The distribution and diversity of species on large islands; (D) The relationship between species richness and available habitat area on islands.

Map of the 50 study islands in the Zhoushan Archipelago, China. The selected islands are labeled in green and ranked according to the decreasing areas from Island 1 to Island 50.
🌏🦌 New #BAAE article:
Mammal richness on small islands is driven more by people than area. Highlighting the need to protect low-disturbance islands and safeguard larger ones. 🌿
DOI:https://doi.org/10.1016/j.baae.2025.10.003
@gfoesoc.bsky.social
19.01.2026 07:00 — 👍 5 🔁 3 💬 0 📌 0

Fig. 1. Genetic composition of rookeries and Foraging grounds of loggerhead sea turtle in the Northeast Atlantic. The pie charts represent the haplotype composition (776 bp) at nesting sites, indicated by a hatchling turtle, and foraging grounds in Macaronesia and ABJN-EA. The haplotype frequencies of the Northeast Atlantic FG used for time comparisons (380 bp) are shown in the barplot (H = Historical, C = Current). The arrows indicate the main source of juveniles to each FG. NRU = Northern Recovery Unit, FL-CE = Florida Central East, FL-SE = Florida Southeast, FL-SW = Florida Southwest, FL-CW = Florida Central West, FL-NW = Florida Northwest, DRT = Dry Tortugas, MEX = Mexico, CAV = Cape Verde, MED = Mediterranean, ABJN-EA = Area Beyond National Jurisdiction in the North-East Atlantic.

Fig. 2. Juvenile sea turtle rookery contributions to foraging grounds. Foraging-ground-centric estimates (cMSA1) showing the mean and SD contributions from rookeries to Macaronesia foraging areas using 776-bp mtDNA fragment. ABJN-EA = Areas Beyond National Jurisdiction in the Eastern Atlantic.
🐢🌊 New BAAE article:
Temporal shifts in juvenile turtle stocks detected. Florida is a major source for Azores & Madeira, Cape Verde for Canary Islands. Genetic differences highlight need for long-term monitoring.
DOI: doi.org/10.1016/j.ba...
@gfoesoc.bsky.social
18.01.2026 07:00 — 👍 4 🔁 1 💬 0 📌 0
Last chance to submit thematic session proposals is today!
@nordicjbotany.bsky.social @ecography.bsky.social @oikosjournal.bsky.social @wildlifebiology.bsky.social @avianbiology.bsky.social @basicapplecol.bsky.social
nordicsocietyoikos.glueup.com/event/nordic...
16.01.2026 09:22 — 👍 3 🔁 2 💬 0 📌 0
👩🏼💻 Ein R Paket für freshwater traits. Es umfasst: 1) Initialisierung: Registrierung und Einstellung des API-Schlüssels in der Benutzerumgebung, 2) Datenabruf und -verarbeitung: Suche, Download, Sortierung und Verwendung der Daten 3) Nachbearbeitung, Visualisierung und Berechnung ökologischer Indizes
14.12.2025 07:43 — 👍 4 🔁 3 💬 0 📌 0

🌳🪱 New #BAAE article: Urbanization reshapes soil biodiversity in green spaces 🏙️
Soil compaction & pore loss reduce nematode diversity, showing that physical soil changes matter as much as chemical ones for healthy urban ecosystems.
DOI: doi.org/10.1016/j.ba...
@gfoesoc.bsky.social
19.12.2025 07:01 — 👍 5 🔁 3 💬 0 📌 0

Schematic of data collection methods applied on the research plots to assess faunal abundance and diversity, with numbers referencing the corresponding section in the Methods text: camera traps (2.2.1); pitfall traps, flight interception traps and trap nests (2.2.2), bird point counts (2.2.3) and bat loggers (2.2.4). Adapted from ConFoBi schematic in Storch et al., 2020.

Effect plots for the effects of roe deer on a subset of taxa showing significant responses. Gray areas display the 95 % confidence intervals. “Ab” indicates abundance, “Div” Shannon diversity. Roe deer abundance on the x-axis is the relative abundance index, i.e., average detections per trapnight.
🌲🦌 New #BAAE article: Roe deer show non-linear impacts on forest biodiversity in German Black Forest 🌿
Many taxa thrive at low–intermediate densities, supporting the intermediate-disturbance hypothesis and challenging the “deer threat” narrative.
DOI: doi.org/10.1016/j.ba...
@gfoesoc.bsky.social
17.12.2025 07:01 — 👍 4 🔁 1 💬 0 📌 0

🌼🐞 New #BAAE article: Coccinellid diversity drives pest control in Brazilian organic farms 🌿
Flowers & non-crop plants boost ladybird abundance, and high species complementarity enhances aphid predation. 🐛🌺
DOI: doi.org/10.1016/j.ba...
@gfoesoc.bsky.social
15.12.2025 07:01 — 👍 4 🔁 3 💬 0 📌 0

Abbreviations
CMWCommunity Weighted MeansEPEcological parametersFWEw w w. freshwaterecology. info database
🌊🐟 New #BAAE article: Introducing fwtraits, an R package unlocking freshwater ecological parameters from FWE!
Easily access traits for fishes, inverts, plants & algae to power reproducible biodiversity analyses and identify critical habitats. 🌿📊
DOI: doi.org/10.1016/j.ba...
@gfoesoc.bsky.social
12.12.2025 07:00 — 👍 11 🔁 4 💬 1 📌 1

Overview of the study location and system. The inset in panel a) shows the location of the study area (red rectangle) in Jimma zone in southwestern Ethiopia. The 58 sites (coffee beans) are plotted on the map of the study area. The gray and green background colours represent open and forested areas, respectively. The photos in the bottom right show characteristic damage by the two major coffee fungal diseases: b) the characteristic brown or blue–black discoloured bands that are seen on the exposed wood of a coffee wilt disease infected stem when the bark is scraped off, as caused by Gibberella xylarioides, and (c) the typical black threadlike rhizomorphs in the cracked stem caused by Armillaria root rot (Armillaria mellea) (photos credits: Beyene Zewdie).

The effect of local climate, habitat, spatial and management variables on the incidence of coffee wilt disease (caused by Gibberella xylarioides) on Arabica coffee in southwestern Ethiopia in the rainy season of 2019. Shown are the relationships between canopy cover and (a) annual mean soil temperature, (b) annual soil temperature variability and (c) soil moisture, as well as the relationships between coffee wilt disease incidence with (d) annual mean soil temperature, (e) soil moisture, (f) coffee density and (g) shade tree species composition. The black circles represent the proportion of infected coffee shrubs with coffee wilt disease at the site-level, and the blue trend line represents the model-predicted relationship. Shaded areas represent the 95 % confidence interval. Only significant relationships are shown.
☕ New #BAAE article: Climate and moisture shape stem & root diseases in Ethiopian coffee
Coffee wilt rises with heat & wet soils, while Armillaria root rot falls with temperature but grows with moisture, key insights for climate-smart management.
DOI: doi.org/10.1016/j.ba...
@gfoesoc.bsky.social
11.12.2025 07:00 — 👍 3 🔁 1 💬 0 📌 0

Overview of the study system. Panel A shows a regional map with the locations of the 23 study sites marked in red, with an inset of the national map in the top-left with the study area in southwestern Ethiopia marked with a red square. The photos below the regional map illustrate B) herbivory (coffee leaf skeletonizer; Leucoplema dohertyi; photo by Ayco Tack) and examples of the local C) bird (common bulbul Pycnonotus barbatus; photo by Kristoffer Hylander) and D) bat community (Egyptian tomb bat Taphozous perforatus, photo by Jens Rydell).

The relationship between coffee yield and a) bird species richness, b) bat species richness, c) bird community composition (axis 1 of an NMDS ordination) and d) bat community composition (axis 1 of an NMDS ordination) across 23 sites in southwestern Ethiopia. Shown are regression slopes with 95% confidence intervals from a GAM model. Solid lines represent a significant relationship (P < 0.05) and dashed lines represent a non-significant relationship (P > 0.05). For statistical details, see Table S5. Bird and bat illustrations by Hannah Burger.
🌳☕ New #BAAE article: Shade-tree diversity shapes bird & bat communities in Ethiopian coffee agroforests 🌿
Richness stays stable across farms, but forest birds decline with higher yields—key insights for sustainable coffee! 🐦
DOI: doi.org/10.1016/j.ba...
@gfoesoc.bsky.social
10.12.2025 07:00 — 👍 4 🔁 2 💬 0 📌 0
🏆🏆🏆 We are still accepting applications for the BEST STUDENT PAPER AWARD! 🏆🏆🏆
Apply now: gfoe.org/en/gfoe-awar...
@elsevierps.bsky.social
18.11.2025 10:46 — 👍 3 🔁 2 💬 0 📌 0


🌸🐝 New #BAAE article: Floral richness shapes plant–pollinator networks in urban agroecosystems 🌆
Higher floral richness boosts pollinator diversity but alters network structure, reshaping urban ecosystem services. 🌼
DOI: doi.org/10.1016/j.ba...
@gfoesoc.bsky.social
10.11.2025 08:45 — 👍 4 🔁 2 💬 0 📌 0

Picture: Marco Ferrante sound recorder
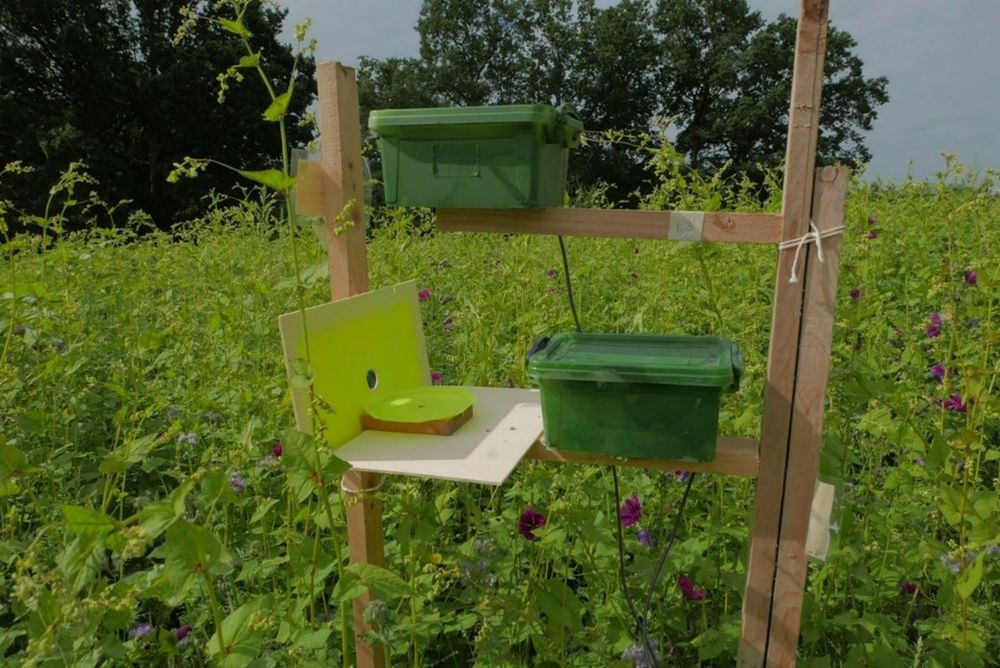
Picture: Isabelle Arimond soundrecorder and video recordings on yellow plate for insect monitoring
International Spring School: #Bioacoustics & Species Recognition using AI 🐝🐦🦗
Join us March 23–27, 2026!
Infos & registration: www.biointakt.de/en/springsch...
@feda.bio
@uni-goettingen.de
@agrarunigoe.bsky.social
@thuenen.de
19.09.2025 07:40 — 👍 13 🔁 5 💬 1 📌 2

Programm of Ecology Seminar
📢 The new programme for our Ecology Seminar is out!
It features a diverse lineup of early career researchers sharing insights on #Agroecology every week 🐝🚜🐦
🗓️ Wednesdays at 10:15 CET
📧 DM for webinar link!
www.uni-goettingen.de/en/ecology+s...
@agrarunigoe.bsky.social
@uni-goettingen.de
24.10.2025 06:17 — 👍 17 🔁 8 💬 1 📌 0