Do you know what happened?
27.01.2025 19:00 — 👍 0 🔁 0 💬 1 📌 0
Incredibly disappointed that MPs didn’t get the chance to vote on the Climate and Nature Bill - a crucial piece of legislation to prevent climate breakdown and protect our natural world. But thanks to all those who backed it - I'll keep fighting for urgent climate action #CANBill
24.01.2025 16:43 — 👍 888 🔁 228 💬 31 📌 27

Labour MPs ordered to sink landmark climate and environment bill
Exclusive: Supporters of bill say Labour has already insisted on removal of clauses requiring UK to meet targets agreed at Cop and other summits
If true, what Labour front bench is doing is unforgivable. The #CANBill is essential & has backing of huge number of experts, scientists, unions & enjoys cross-party support. If backbench Labour MPs ever consider rebelling against leadership on anything, let it be this - a liveable future for all 👇
24.01.2025 08:41 — 👍 1852 🔁 854 💬 100 📌 60

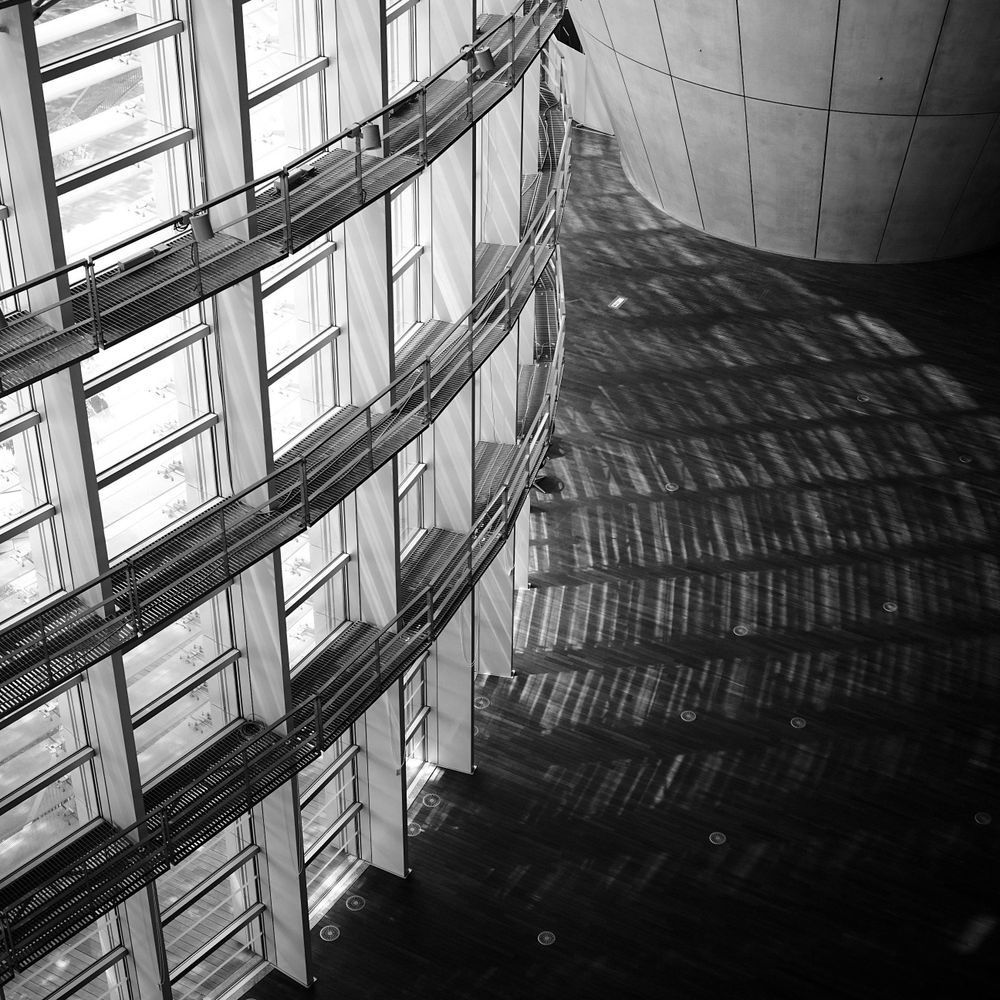
A high contrast black and white picture of London. It only shows two buildings. In the foreground a shadowed rectangular building. Behind it is the Shard (the tallest building in western Europe) completely illuminated by the sun. The perspective makes them look as part of a tangram. But in reality the Shard is much larger than the building in the foreground.
Trigonometría in London (2025) #Fotografía #Photography
22.01.2025 21:03 — 👍 2 🔁 0 💬 0 📌 0

Hey @nytimes.com, the 2000s called and they want their old, battered cliche back.
11.01.2025 17:43 — 👍 464 🔁 72 💬 17 📌 7

Screenshot of a Threads post from @swilua.bsky.social giving the following guidance to Bluesky newbies:
“Reminder to everyone that Bluesky has no central algorithm! Even the Discover feed is MUCH LESS of an algorithm than you are used to!
You need to follow more people than you used to and think differently about how you engage.
Replies help! Likes don't matter much! Posts alone won't get you seen!
Hashtags can help. Look at the feeds and interact A LOT!
When in doubt hang out on my feed, my followers are chatty!!”
This great guidance for #Threads refugees from @swilua.bsky.social.
09.01.2025 06:51 — 👍 57 🔁 18 💬 3 📌 2
Bueno, pues ya me fui de #threads.
08.01.2025 21:24 — 👍 2 🔁 0 💬 0 📌 0

I also does not help that both Otis’ land John’s landfalls points are in a radar blind spot!
24.09.2024 07:05 — 👍 0 🔁 0 💬 0 📌 0
I think we were lucky it moved fast. Had it spent more time over water I could have been even strongest at landfall. Also the track forecasts changed a lot in the last 4 advisories!
24.09.2024 05:03 — 👍 0 🔁 0 💬 1 📌 0

Monitoring Tropical Storm John, which could rapidly intensify to a major hurricane before hitting southern Mexico, likely Oaxaca, on Tuesday evening. 30+ inches of rain could cause life-threatening flooding.
Hurricane Otis rapidly intensified to a Cat 5 and struck Acapulco (just west) last year.
23.09.2024 17:57 — 👍 1 🔁 1 💬 0 📌 1
Completely agree!
03.09.2024 06:44 — 👍 0 🔁 0 💬 0 📌 0

This is a graph depicting air pollution (PM2.5 concentrations) in London, UK, from 1850 to 2021. It includes a color-coded scale indicating levels of air quality, ranging from "Extremely Poor" to "Very Good." There's also a white line that shows the same information. The air quality level in London has been gradually getting worse since the start of the Industrial Revolution, improving drastically in the 1970s and continuing to the present day.

This is a graph depicting air pollution (PM2.5 concentrations) in Delhi, India, from 1850 to 2021. It includes a color-coded scale indicating levels of air quality, ranging from "Extremely Poor" to "Very Good." There's also a white line that shows the same information. The air quality was already quite poor since the industrial age, and has gotten significantly worse starting in the 1970s and is now extremely poor.
Behold air quality stripes; like climate stripes, but for the stuff that kills you directly.
The visualization shows how much clean air legislation, moving away from coal, and generally not setting carbon on fire improve air quality and reduce excess deaths.
airqualitystripes.info/stripes/?con...
23.08.2024 18:54 — 👍 397 🔁 171 💬 15 📌 9
Welcome! Find us weekdays 10:30pm on BBC Two, BBC News, iPlayer with Victoria Derbyshire, Paddy O'Connell & Matt Chorley - plus Katie Razzall, Nicholas Watt and Faisal Islam
Author & photographer Luke Agbaimoni's project capturing stations & stops on the London Underground tube map.
Tubemapper.com
💰 Book,Prints & Calendars
✉ luke@tubemapper.com
DM for info
Distinguished Professor of Ecology-Oregon State University
Director-Alliance of World Scientists
Co-Lead author "The 2024 State of the Climate Report" https://doi.org/10.1093/biosci/biae087
Somos un grupo de activistas científicxs que forma parte de Scientist Rebellion, que exige acción urgente ante la crisis climática mediante movilización, intervención pública y difusión científica.
@ScientistRebellion.bsky.social en España:
Por una Revolución Climática frente a la inacción política: #LaCienciaEsClara
📩 rebelioncientificaesp@protonmail.com
RT ≠ apoyo.
rebelioncientifica.es
Mouvement citoyen mobilisé pour sortir des énergies fossiles et bâtir un avenir alimenté par les énergies renouvelables, pour toutes et tous 🧡
Nous appelons le gouvernement à taxer les ultra-riches pour répondre à la crise climatique #TaxonsLeursMilliards
This account is maintained by federal staff to share services and legislation relevant to constituents of NY-14.
Former MP for Brighton Pavilion, former Leader & Co-Leader of @greenparty.org.uk.Co-President of the European Movement. Mum of 2, plus puppy Nell. Author, Another England: How to Reclaim our National Story. Still writing & campaigning on climate & nature 🌎
Mad scientist telling stories from the wild!
Ambassador | @polarbearsinternational
Contributor | @natgeoyourshot
@cangeo 🇨🇦 Fellow. 📍Treaty 7
Glass is a paid, global photography community and photo sharing platform. With no ads or manipulative algorithms you can fall in love with photography again.
📷写真が好き/ SIGMA fp L / LUMIX S9
Millwall fan of too many years to mention,
Lonely miserable git basically.
We look out for trees in the Southwark wards of North and South Bermondsey, London Bridge and West Bermondsey, and Chaucer.
Occasional posts about Rotherhithe, Surrey Quays & Bermondsey. The https://SE16.com website is closed for now.
From the makers of @se1.news
En alianza con Bloomberg, El Financiero te da la mejor información de economía, empresas y finanzas
Husband, father and Mayor of the greatest city in the world. He/Him.
Contamos historias… y también noticias.
 28.01.2025 14:11 — 👍 1 🔁 0 💬 0 📌 0