Observable Notebooks 2.0 Technology Preview | Observable
I've been playing with the new Observable Notebooks 2.0 over the past days and I'm amazed. While still a preview I think it's already a serious alternative to R or Jupyter notebooks. Love that it works locally now and that notebooks are just HTML files with vanilla JS observablehq.com/notebook-kit/
02.08.2025 10:26 — 👍 39 🔁 9 💬 0 📌 1
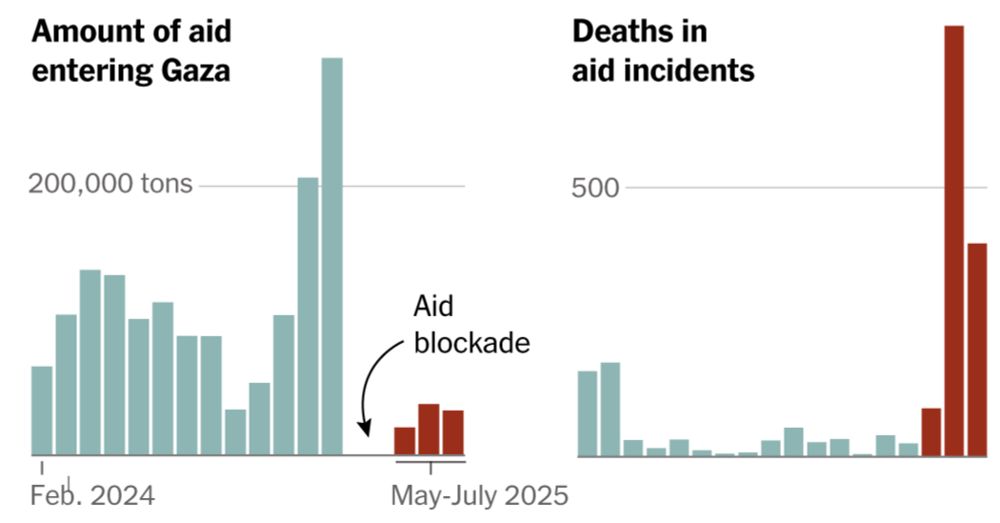
How Did Hunger Get So Much Worse in Gaza?
Less food is going into Gaza now than during most other times in the war. Hundreds of Palestinians have been killed while heading toward aid sites. Many others are suffering from serious malnutrition,...
„In March, Israel imposed an aid blockade on Gaza in an effort to squeeze concessions from Hamas; it also said, without providing evidence, that the militant group was systematically stealing the supplies. That (...) caused widespread hunger among Gazans.“ www.nytimes.com/interactive/...
01.08.2025 19:33 — 👍 33 🔁 5 💬 0 📌 0
Observable Notebooks 2.0 Technology Preview | Observable
Notebooks 2.0 is here! 📓🔮 Previewing today:
Notebook Kit, an open file format for notebooks with open-source tooling for generating static sites; and
Observable Desktop, a macOS desktop application for editing notebooks as local files, with a radical new approach to AI. observablehq.com/notebooks/2/
29.07.2025 14:38 — 👍 58 🔁 25 💬 2 📌 4
Nein, ich glaube das ist nicht so gern gesehen, wenn man seinen eigenen Artikel schreibt. Fakten korrigieren müsste aber gehen, so lange du sie auch mit externen Quellen belegen kannst (du selbst zählst glaube nicht als Quelle 😅).
24.07.2025 17:03 — 👍 1 🔁 0 💬 1 📌 0
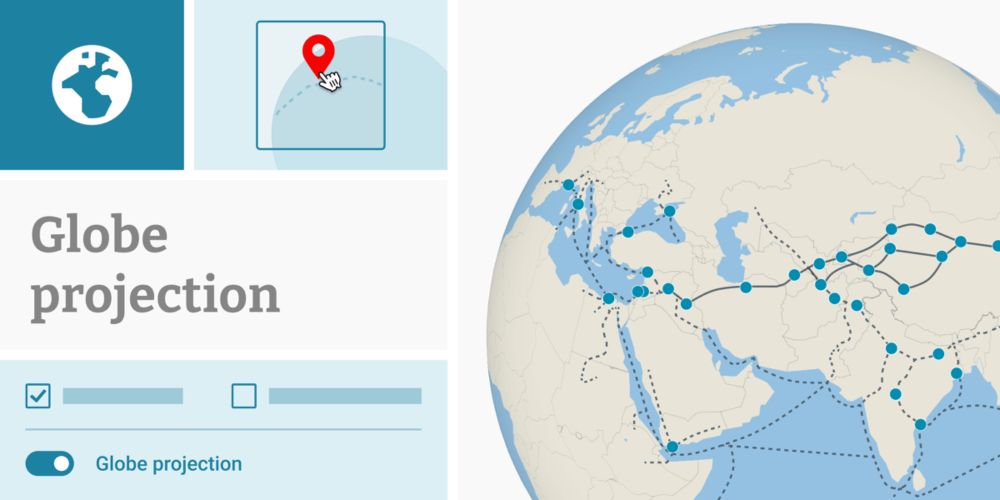
New: Globe projection in locator maps | Datawrapper Blog
Create locator maps using a globe projection
*Huge* new feature in Datawrapper! You can now create locator maps using the globe (aka orthographic) projection. Makes small scale maps so much better compared to the Mercator projection! All thanks to the amazing folks at @datawrapper.de and @maplibre.org ❤️
www.datawrapper.de/blog/new-glo...
24.07.2025 16:19 — 👍 33 🔁 10 💬 1 📌 0

What Makes Heat So Hard to Cover?
For journalists, the most urgent climate disaster is also the trickiest to report on.
Extreme heat doesn’t receive the same “round-the-clock” coverage as wildfires, hurricanes, or floods. Yet, “Of all the climate disasters we face, heat is the most urgent, and its day-to-day effects are also the trickiest to talk about.” By Meg Bernhard @columjournreview.bsky.social
19.07.2025 12:31 — 👍 72 🔁 42 💬 1 📌 2
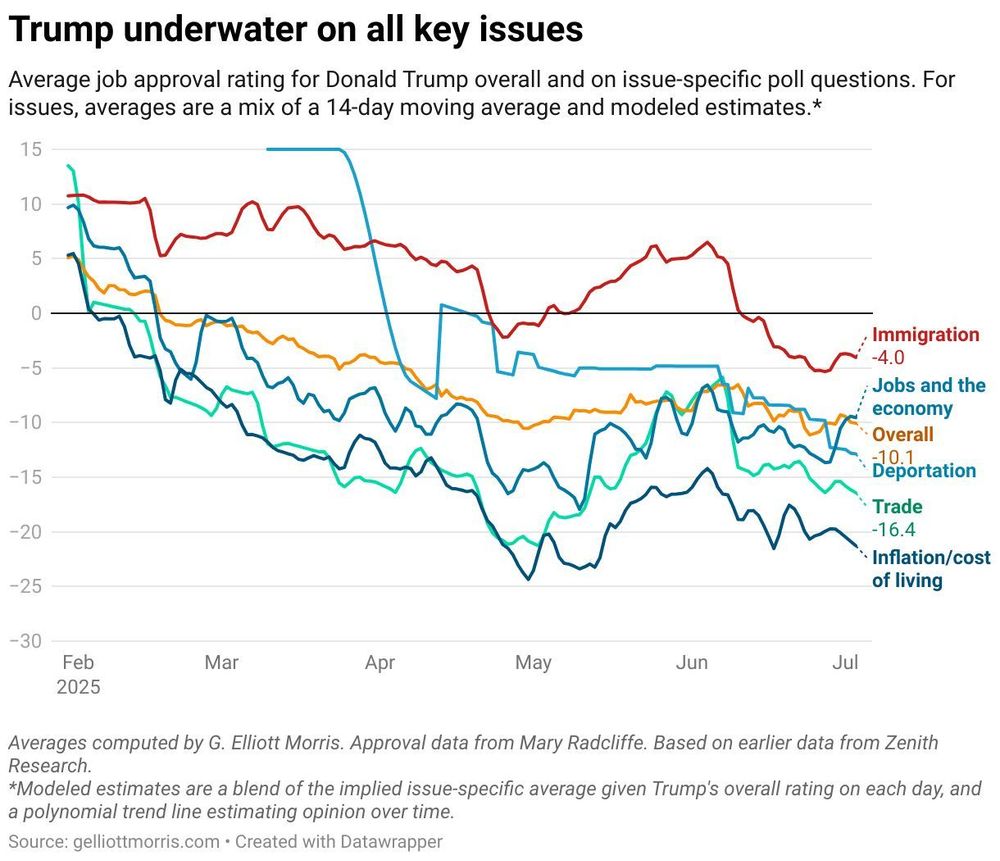
Trump’s approval rating on deportations is currently lower than his approval on the economy
www.gelliottmorris.com/p/data
05.07.2025 15:15 — 👍 1258 🔁 389 💬 56 📌 76
I feel we can look at data as long as we want without ever grasping how serious this is. This is what 1.5 degrees warming feels like, and on our current course we’re heading for 2.7. There’s no „good side“ to look at in a summer like this.
02.07.2025 12:36 — 👍 8 🔁 1 💬 0 📌 0
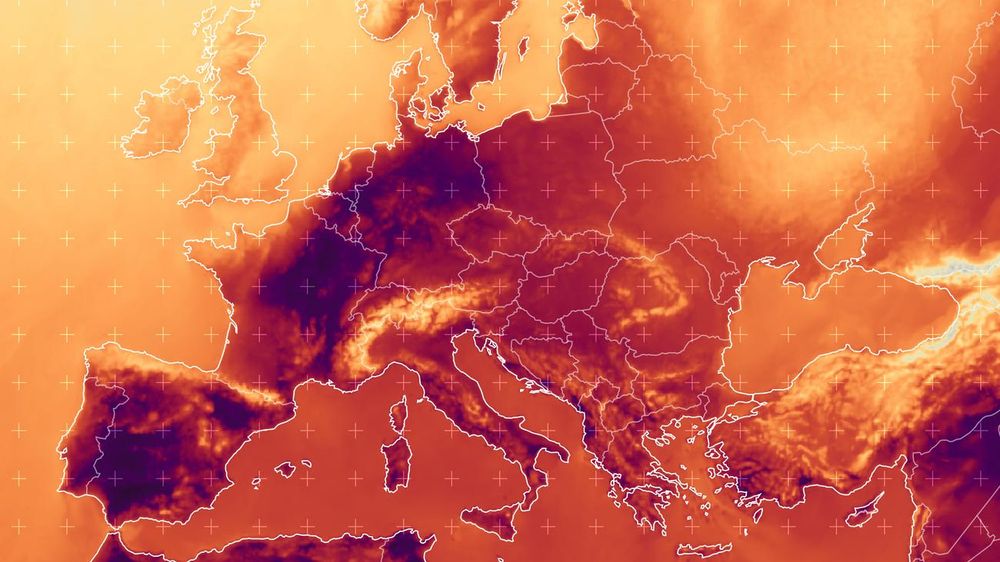
Hitze in Europa: Hier ist die Hitze am extremsten
Selten war es in ganz Europa so früh so heiß. Für Millionen Menschen wird das zu einer wiederkehrenden Gefahr. Daten zeigen, welche Regionen besonders betroffen sind.
No map or visualization can tell you how hot 37°C feels like. Walking the streets in Berlin today feels like slowly dying. Spain and Portugal have suffered from this heat wave all week, and I can’t even begin to imagine temperatures in China, India, Iran, etc. www.zeit.de/wissen/2025-...
02.07.2025 12:36 — 👍 38 🔁 12 💬 4 📌 0
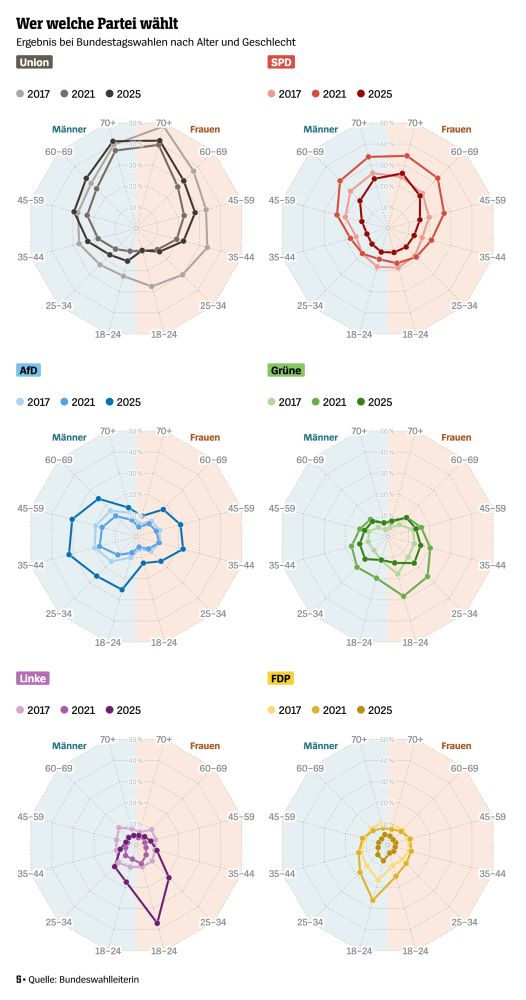
The representative electoral statistics show how often each demographic group voted for different parties in the German federal election. This year, I’ve prepared the data as radar charts. What do you think: does this type of chart work well for this kind of data? www.spiegel.de/politik/deut...
23.06.2025 16:00 — 👍 46 🔁 13 💬 5 📌 0
Multiple tornadoes tore across parts of South Dakota on Saturday.
29.06.2025 14:14 — 👍 145 🔁 48 💬 3 📌 8

The 100 Best Movies of the 21st Century (Gift Article)
More than 500 influential directors, actors and other notable names in Hollywood and around the world voted on the best films released since Jan. 1, 2000. See how their ballots stacked up.
So excited to have this out!
I’ve been working on The 100 Best Movies of the 21st Century for months. We polled over 500 major directors, actors, and other people in and around Hollywood to find out the best films released since 2000. You’re gonna be obsessed. www.nytimes.com/interactive/...
23.06.2025 13:28 — 👍 267 🔁 55 💬 22 📌 33
Special thanks to Prof. Dr. Georg Feulner who compiled data from many different studies into a single time series. Without climate scientists, we wouldn't be able to do this!
22.06.2025 11:53 — 👍 3 🔁 0 💬 1 📌 0
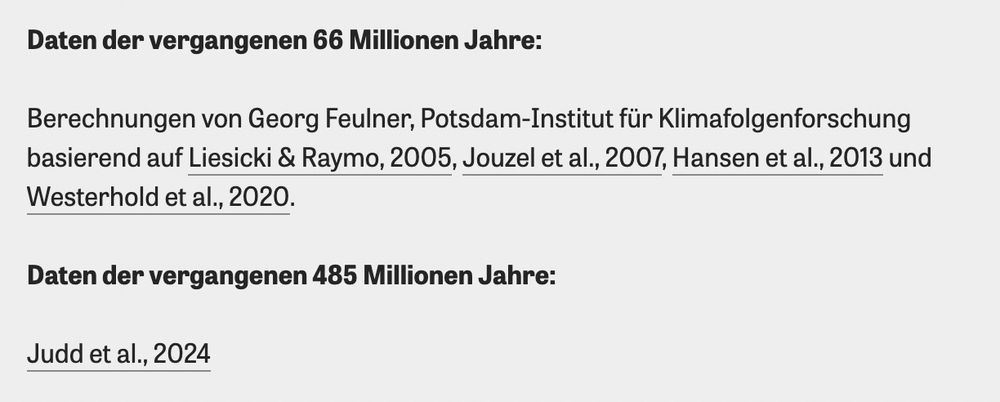
Based on these studies
- Liesicki & Raymo, 2005 (https://agupubs.onlinelibrary.wiley.com/doi/10.1029/2004PA001071)
- Jouzel et al., 2007 (https://www.science.org/doi/10.1126/science.1141038)
- Hansen et al., 2013 (https://royalsocietypublishing.org/doi/10.1098/rsta.2012.0294)
- Westerhold et al., 2020 (https://www.science.org/doi/10.1126/science.aba6853)
- Judd et al., 2024 (https://www.science.org/doi/10.1126/science.adk3705)
I don't know how many climate scientists where involved in collecting all these samples and turning them into models of past surface temperatures, but we linked to all the related studies in the methodology.
22.06.2025 11:53 — 👍 2 🔁 0 💬 1 📌 0
Paleoclimatology
NCEI manages the world's largest archive of climate and paleoclimatology data. Our mission is to preserve and make this data and information available in order to understand and model environmental va...
It's crazy to think about where this data is coming from. To recover temperatures over such long time periords, samples where taken from over 5,100 trees, 2,300 ocean sediments, 800 boreholes, 351 coral reefs, and 170 ice cores, historical paper records, and more. www.ncei.noaa.gov/products/pal...
22.06.2025 11:53 — 👍 5 🔁 1 💬 1 📌 0
War es auf der Erde schonmal so warm wie jetzt? Ja. Aber dafür muss man verdammt weit zurückblicken. @driven-by-data.net und ich haben uns 485 Millionen Jahre Klimageschichte angeschaut- von den Dinosauriern bis zum iPhone.
20.06.2025 11:34 — 👍 10 🔁 3 💬 0 📌 0
People tell me nobody wants to look at climate curves anymore, yet here we are!!! Please enjoy our interactive journey through 485 million years of climate history and dive into the fascinating and important work of paleoclimate scientists.
🎁 www.zeit.de/wissen/umwel...
20.06.2025 09:32 — 👍 114 🔁 40 💬 8 📌 1

Picture of me and the text "Impactful Community Leader, Lisa Charlotte Muth, Datawrapper" below and the text "Information is Beautiful Awards 2024 Winner" in a badge.
Wow! It's a great honor to receive this Information is Beautiful Award.
Thanks to @datawrapper.de for letting me inspire people. And thanks to everyone else who's contributing to the lovely #dataviz community!
Find all #IIBAwards winners here: www.informationisbeautifulawards.com/news/680-ann...
18.06.2025 13:08 — 👍 82 🔁 4 💬 10 📌 2
I think I'd like to have all features from Obs Plot in SveltePlot and keep their APIs closely aligned. There are already some minor differences and SveltePlot introduced some features not yet available in Obs Plot (e.g. brushing). But I would like the grammar to be almost interchangeable, ideally
23.05.2025 11:52 — 👍 6 🔁 0 💬 1 📌 0
You can also use Tween from svelte/animate to transition the data and domain. But I’m still waiting for a replacement for the in: out: syntax using @attach to support passing svelte transitions through the mark components.
22.05.2025 20:27 — 👍 6 🔁 0 💬 1 📌 0
✨Use llms from #rstats with ellmer ✨Version 0.2.0 is on CRAN now. No blog post yet because I'm about to go on vacation, but in the meantime you can check out the release notes: github.com/tidyverse/el....
18.05.2025 14:13 — 👍 69 🔁 14 💬 3 📌 0
Finally, SveltePlot is just an idea. Maybe it's not the best one, we'll see! Big thanks to everyone on whose shoulders I am standing, including @ocks.org, @fil.rezo.net, @rich-harris.dev, @hadley.nz, @techniq.dev and everyone contributing to free and open source projects! You're all my heroes!! ♥️
13.05.2025 11:21 — 👍 15 🔁 0 💬 0 📌 0
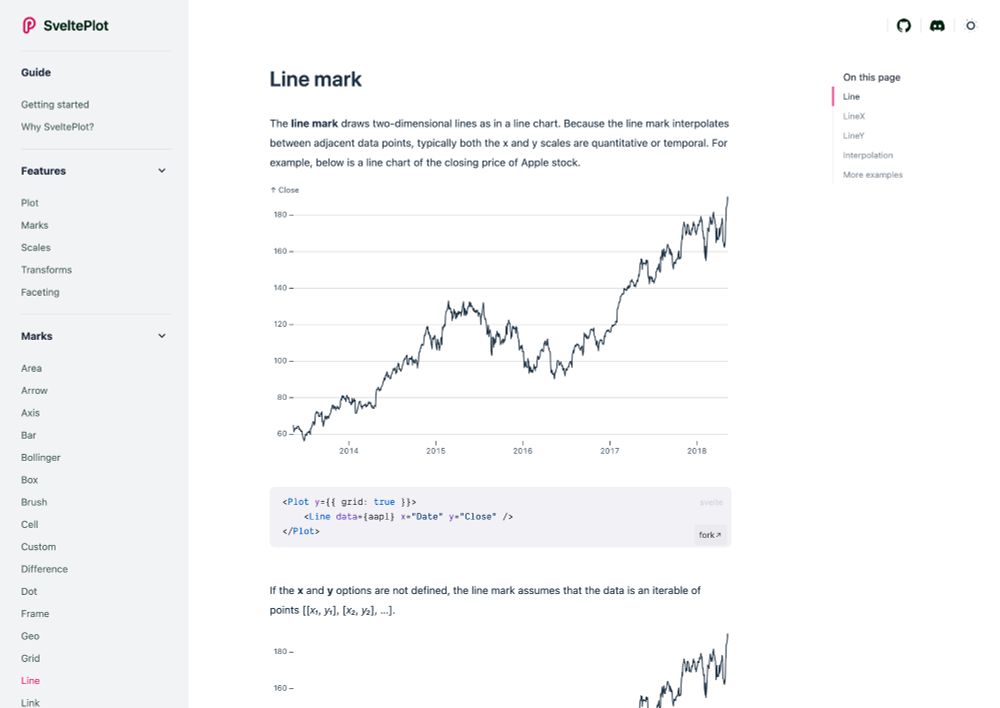
Screenshot of the SveltePlot homepage at https://svelteplot.dev
I made a website that documents all the features and shows a lot of examples that you can fork and edit on the Svelte playground. You can help improving this website, too! svelteplot.dev
13.05.2025 11:21 — 👍 11 🔁 1 💬 1 📌 0
Join the SveltePlot Discord Server!
Check out the SveltePlot community on Discord - hang out with 18 other members and enjoy free voice and text chat.
SveltePlot is not backed by any company, so if we want to make it work, we need to work together! It's not officially production ready, yet. There are bugs you can help to find, document and fix, and a lot of tests need to be added. Join discord.gg/pp2wRJqtHV if you want to help!
13.05.2025 11:21 — 👍 26 🔁 3 💬 1 📌 0
SveltePlot is not a component library but a grammar of graphics. Think of it as a language for describing a huge range of different graphics.
13.05.2025 11:21 — 👍 10 🔁 0 💬 1 📌 0
It's not the best pick if you're looking for high performant data-dense displays. It also adds a lot more kB to your bundle size than if you'd just write clean Svelte + D3.js code. Perhaps that's something we can improve in the future with the coming async Svelte features!
13.05.2025 11:21 — 👍 7 🔁 0 💬 1 📌 0
SveltePlots emphasize on developer experience makes it a great pick in scenarios where you need to rapidly iterate over visualization ideas in code and then want to turn your prototypes into publishable graphics without switching languages or re-implementing them in a different framework.
13.05.2025 11:21 — 👍 8 🔁 0 💬 1 📌 0
Unlike LayerChart, SveltePlot is not built on top of a CSS framework like TailwindCSS. All styles are applied inline or (optionally) via emotion/css managed css classes. SveltePlot also follows the grammar of graphics principles more strictly, offering no "scatterplot" or "histogram" components.
13.05.2025 11:21 — 👍 8 🔁 0 💬 1 📌 0
Unlike LayerCake, SveltePlot comes with "all batteries included", featuring a rich set of data transforms and marks to shape and display your data. Helper components make it easier to add interactivity to your plot, such as tooltips or brushing.
13.05.2025 11:21 — 👍 9 🔁 0 💬 1 📌 0
(data)Journaliste à la Nouvelle République.
📧 leo.berry@nrco.fr
https://www.lanouvellerepublique.fr/contributeur?userprofile=62bab2fb2cd3e61a208b459f&name=Berry-L%C3%A9o
Graphics, data visualization, and web technologies. CARTO. Previously NYTimes R&D and Google. Contributor to glTF, three.js, and A-Frame VR. he/him.
Brooklyn, NY.
https://www.donmccurdy.com/
https://hachyderm.io/@donmccurdy
Washington Post graphics assignment editor, politics
How the administration is breaking the government, and what that means for all of us. All of our content is free to republish and remix. https://unbreaking.org/
A legacy of discovery. A future of innovation.
Postdoc University of Oslo |
Author of Road to October 7: A Brief History of Palestinian Islamism (Verso) & A History of Palestinian Islamic Jihad (Cambridge UP) |
Linux and digital methods enthusiast
Offizieller Account von kachelmannwetter.com
Es posten: Clemens Grohs /CG, Peter Hinteregger /PH, Fabian Ruhnau /FR, Lars Dahlstrom /LD, Frank Abel /FA
Journalist | Volontär bei @capital.de
Best- und Letztsellerautorin; taz Autorin für Zukunft
Schreibt dicke Bücher, damit man sie auch werfen kann - zu Hirn, Hormonen & Politik (wenn sie mich aufregt)
torial.com/franca.dr-parianen
Eloped Neuroscientist turned Science Communicator
Sie/she/PhD
Data journalist for BBC (Indian languages)
Previously with The Hindu
Maps, dataviz, renewables, climate, oceans, forests ❈ Dataviz engineer @ Octopus Energy
❈ Founder http://satellitestud.io
Data Visualization & Biomedical Science. PhD in biology, trained in art, Associate Prof
Writes here: https://helenajamborwrites.netlify.app/
Where weather comes to life - your ultimate source for breaking stories, expert insights, and natural wonders.
Portuguese data journalist publico.pt. | #ddj #svelte #rstats
📍 Braga
📸 @photons.ruibarros.me
💻 ruibarros.me
📮 rui.barros@publico.pt
🤖 @manchetes.pt
writes, bikes, makes val.town, writes macwright.com, open source, geo, music and other stuff. posiwid
twitter archive: https://bsky.app/profile/archive.macwright.com
data driven design engineer.
previously: web, design, video @graphext.bsky.social; animation engineering @ Prisms of Reality
🛠️ Creator of LayerChart and Svelte UX
👨💻 Fullstack dev w/ Frontend & DataViz specialties
💾 Network/Systems engineer in a prior life
News Apps at ProPublica, based in D.C.
Remote sensing, FOIA, other nonsense. Hit me with your climate/ag/H2O/H5N1-related thoughts & tips.