

Thwaites Eastern Ice Shelf heading for collapse. Monthly average velocities Jan 2025 to Feb 2026 derived from EU Copernicus Programme Sentinel-1 SAR data. Grounding lines in black and yellow from NASA MEaSUREs
02.03.2026 16:06 — 👍 14 🔁 6 💬 3 📌 2Thwaites Eastern Ice Shelf heading for collapse. Monthly average velocities Jan 2025 to Feb 2026 derived from EU Copernicus Programme Sentinel-1 SAR data. Grounding lines in black and yellow from NASA MEaSUREs
02.03.2026 16:06 — 👍 14 🔁 6 💬 3 📌 2
Iceberg A23a, 17 Feb 2026, Aqua/Modis
Iceberg A23a today (17 Feb). A totally clear sky. Utterly stunning. Still refusing to die. Still 500 sq km in area. Image from the Modis instrument on the venerable Aqua satellite, another oldie that's still plugging away.
17.02.2026 23:31 — 👍 7 🔁 1 💬 0 📌 0
NASA Aqua Modis 11 January
💥 Boom! And it's just happened. The huge volumes of meltwater that had collected on the surface of iceberg A23a have triggered a massive and catastrophic hydrofracture event. Much of the berg has turned to mush. Three major segments remain, the largest about 500 sq km.
12.01.2026 19:13 — 👍 16 🔁 4 💬 0 📌 4
NASA Modis
One big paddling pool becomes three. Today's view of iceberg A23a (left) and a view from the end of December (right). Notice how the raised rim effect, holding in surface meltwater, has re-established on all three main segments of the broken berg. A23a is turning to slush puppie.
13.01.2026 22:40 — 👍 6 🔁 3 💬 0 📌 0
Iceberg A-23A first broke off the Filchner Ice Shelf in 1986. NASA EO recently shared what's left, "waterlogged berg on December 26, 2025, extensive pools of blue meltwater were visible on its surface" and still one of the largest in the ocean. More at science.nasa.gov/earth/earth-...
14.01.2026 13:35 — 👍 11 🔁 6 💬 0 📌 0
Sentinel-1's decade of essential data over shifting ice sheets - @esa.int
www.esa.int/Applications...
Hi Callan. Yes, no problem. Search for my address and send me an email. But be patient as I'm going to be away for a week or so.
02.12.2025 17:38 — 👍 1 🔁 0 💬 0 📌 0Huge fractures opening at the Thwaites Glacier Eastern Ice Shelf grounding line
02.12.2025 07:58 — 👍 34 🔁 19 💬 4 📌 4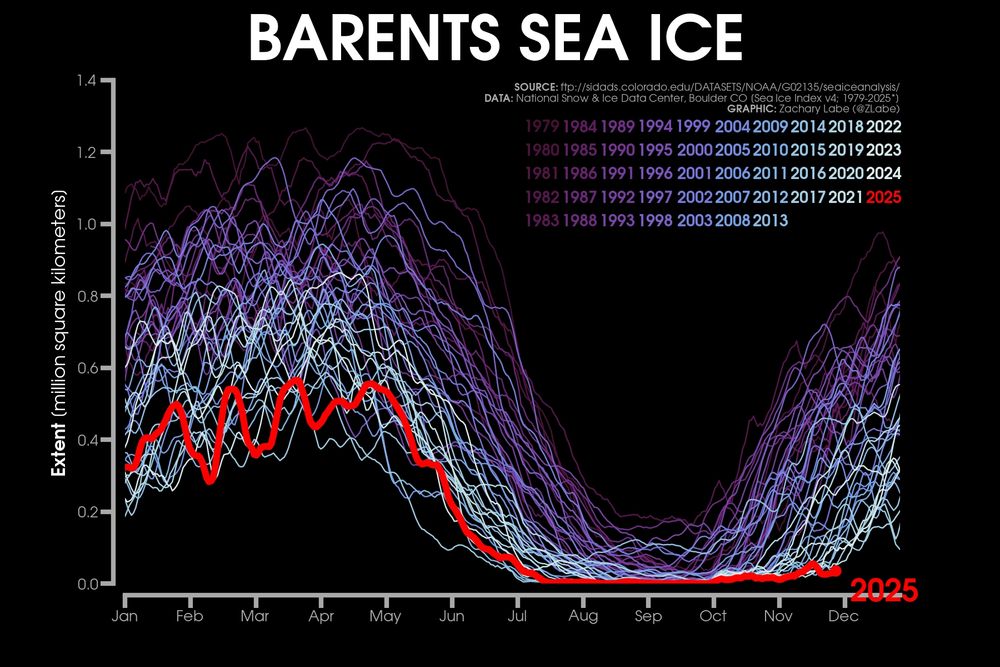
Line graph time series of 2025's daily Arctic sea ice extent compared to each year from 1979 to 2024 as shown with thin lines in colors from purple to white. There is large daily variability, but a long-term decreasing trend during all months of the year. A seasonal cycle is also visible in this region.
Astonishingly, sea ice still hasn't started to reform over the Barents Sea area yet of the #Arctic. This includes record low conditions around Svalbard as well. It's been a very bad few months across the region.
Check out more graphics here: zacklabe.com/arctic-sea-i...
⚒️ Article: Record grounded glacier retreat caused by an ice plain calving process
@adrianluckman.bsky.social @etienneberthier.bsky.social @drnaomio.bsky.social
www.nature.com/articles/s41...
Swansea Uni co-author @adrianluckman.bsky.social put this Sentinel-1 movie together. "Although the paleo record indicates some very rapid retreats in the past, the pace of retreat of Hektoria Glacier and its neighbours is unprecedented in the observational record," Adrian says.
03.11.2025 16:59 — 👍 8 🔁 3 💬 2 📌 0Iceberg A23a continues to break apart in the southern Atlantic Ocean, near the island of South Georgia.
16.09.2025 20:39 — 👍 27 🔁 9 💬 2 📌 0
We have a new preprint out reviewing the monitoring & detection of Svalbard surging glaciers: eartharxiv.org/repository/v...
We also compiled a new database of Svalbard's surge-type glaciers: zenodo.org/records/1524...
@dannipearce.bsky.social @hazlovell.bsky.social @adrianluckman.bsky.social
Check out this time-lapse video of waves eroding an ice front from an experiment conducted in our cryogenic wave tank at the University of Wisconsin-Madison. The tank is housed in a walk-in freezer, and the waves are precisely controlled. This video captures about an hour of wave erosion.
16.07.2025 14:17 — 👍 59 🔁 11 💬 5 📌 0
Iceberg A23a on 7/7/25 Eumetsat/Meteosat 12
In case you were wondering... Iceberg A23a seen cruising around South Georgia today by Meteosat 12. The old berg still has an area of 2,846 sq km.
07.07.2025 15:43 — 👍 6 🔁 2 💬 0 📌 0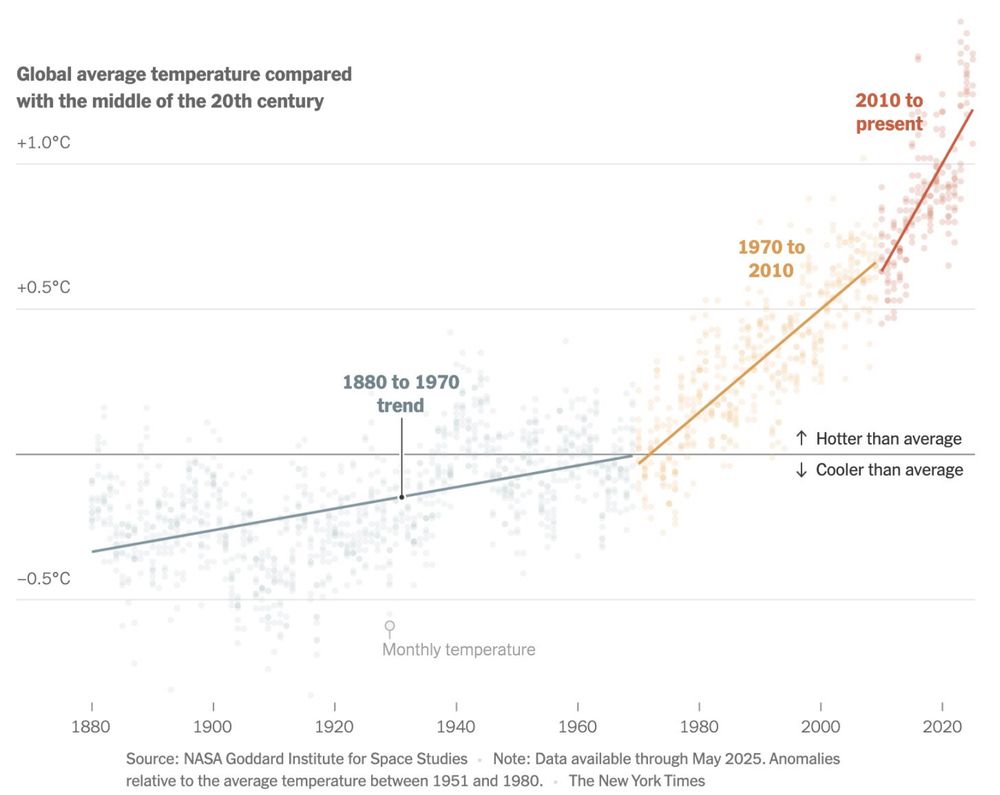
Global average temperature compared with the middle of the 20th century +1.0°C 2010 to present +0.5°C 1970 to 2010 Cooler than average -0.5°C 1880 to 1970 • Note: Data available through May 2025. Anomalies relative to the average temperature between 1951 and 1980. • The New York Times 2020
I hope everyone on this website thinks very carefully about this graph and then considers whether or not they need to reorder their priorities at all.
26.06.2025 19:41 — 👍 134 🔁 65 💬 9 📌 10Jakobshavn Isbrae (Ilulisat Glacier) produces 10% of Greenland's icebergs (Wikipedia). Ten years of @esa.int Copernicus #Sentinel-1 SAR data shows ice pouring into Baffin Bay. Winter advance and summer retreat of the ice front show how calving is controlled by seasonal freeze-up of fjord ice melange
26.06.2025 10:41 — 👍 3 🔁 3 💬 0 📌 0
PolarView 13/5/25
Sentinel-1 has finally got a clear view of iceberg A23a (13/6/25). The berg is much diminished as it skirts around South Georgia. And the US National Ice Center has updated its stats: A23a is now only the world's second biggest berg at 829.79 sqNM, or 2846,11 sqKM.
15.06.2025 07:57 — 👍 4 🔁 2 💬 1 📌 1
📣 PhD position on #WorldSaltmarshDay! 🌱
👉Develop and deploy open-source sensors to measure #biophysical properties to predict #coastal #wetland #restoration success @ Swansea Uni + 3-month placement with Welsh Gov. Plz share! 🙏
www.swansea.ac.uk/postgraduate...
Nested glacier surges! This is Liestolbreen in Svalbard, surging into Nathorstbreen (which itself surged from 2008), and then being surged into by Doktorbreen. All brought to you by the magic of Sentinel-1 SAR
10.06.2025 10:02 — 👍 19 🔁 7 💬 1 📌 1The movement of iceberg A23a over the past seven days. It's moved about 80km to the southeast of the position where it grounded off the coast of South Georgia in early March. Zoomed in animation from Meteosat-12.
04.06.2025 14:41 — 👍 4 🔁 1 💬 1 📌 0
Meteosat view of South Georgia and iceberg A23a. 30/5/25
With days shortening at South Georgia (it's about 8 hours from sunrise to sunset), optical satellite coverage in the region is getting more restricted. Not so for Meteosat, which images the Europe/Africa hemisphere regardless of season. Hence we get a few views of iceberg A23a. Still grounded.
30.05.2025 14:47 — 👍 4 🔁 2 💬 1 📌 0
Iceberg A23a on 3 May. Copernicus / Sentinel-3
There was a spectacular view of iceberg A23a on 3 May. Clear skies over the berg and South Georgia. By my measurement, A23a is no longer the world's biggest iceberg. At ~2850 sq km, it's now bested by D15a - but only just. The US National Ice Center will be the final judge on the matter.
06.05.2025 09:49 — 👍 4 🔁 1 💬 0 📌 0The journey of Iceberg A23a (largest, oldest, 'living' berg) since the beginning of 2024, as seen by NASA MODIS, including its five-month pirouette on the Taylor Column, short embrace by the pack ice in August, grounding on South Georgia's shelf in April, and baby calf. Watch this space for updates!
02.05.2025 14:54 — 👍 5 🔁 1 💬 0 📌 0Large fractures continue to open up at the grounding line of Thwaites Glacier Eastern Ice Shelf. Animation contains @copernicusland.bsky.social #Sentinel-1C data alongside 1A and 1B
01.05.2025 13:08 — 👍 26 🔁 8 💬 3 📌 2
A23a and A23c pictured off South Georgia on 22/4/25 Nasa Worldview Modis
US National Ice Center formally catalogues A23c, the big off-cut from grounded behemoth A23a. Daughter berg is ~130km² - or 2x Manhattan Island. A23a (~3,100km²) only needs to lose another ~30km² to hand "World's Biggest Iceberg" title to D15a (~3,070km²) in Amery Sea.
22.04.2025 12:41 — 👍 4 🔁 1 💬 0 📌 0
Sentinel-3 Copernicus Data.
A big chunk has broken away from iceberg A23a, currently grounded at South Georgia. I calculate ~110 sq km. Looks to have fractured sometime on 11/12 April. It will get a US National Ice Center designation. It should be A23c, unless I'm mistaken.
16.04.2025 09:12 — 👍 7 🔁 1 💬 0 📌 0Kronebreen is one of the fastest flowing glaciers in Svalbard. Ten years of @esa.int #Sentinel-1 data shows us both the annual advance/retreat cycle characteristic of melt-undercut calving in a seasonally warmed fjord, and the long-term retreat caused by climate warming. Email me for hi-res version
07.04.2025 12:49 — 👍 7 🔁 2 💬 0 📌 0So sorry for the typo Noel Gourmelen!
03.04.2025 15:51 — 👍 0 🔁 0 💬 0 📌 0
Fantastic new animation from ESA featuring CryoSat-2 & Sentinel-1 animations, highlighting our Nature-Comms paper "The influence of subglacial lake discharge on Thwaites Glacier ice-shelf melting and grounding-line retreat" www.nature.com/articles/s41... led by Noel Gourmelan: youtu.be/vRMeiMsQkBE
03.04.2025 14:11 — 👍 1 🔁 0 💬 1 📌 0


