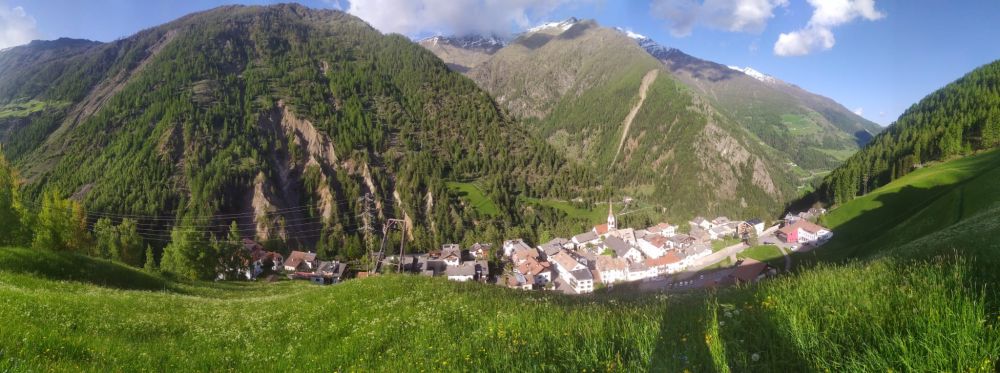
Picture of the Italian town of Karthaus
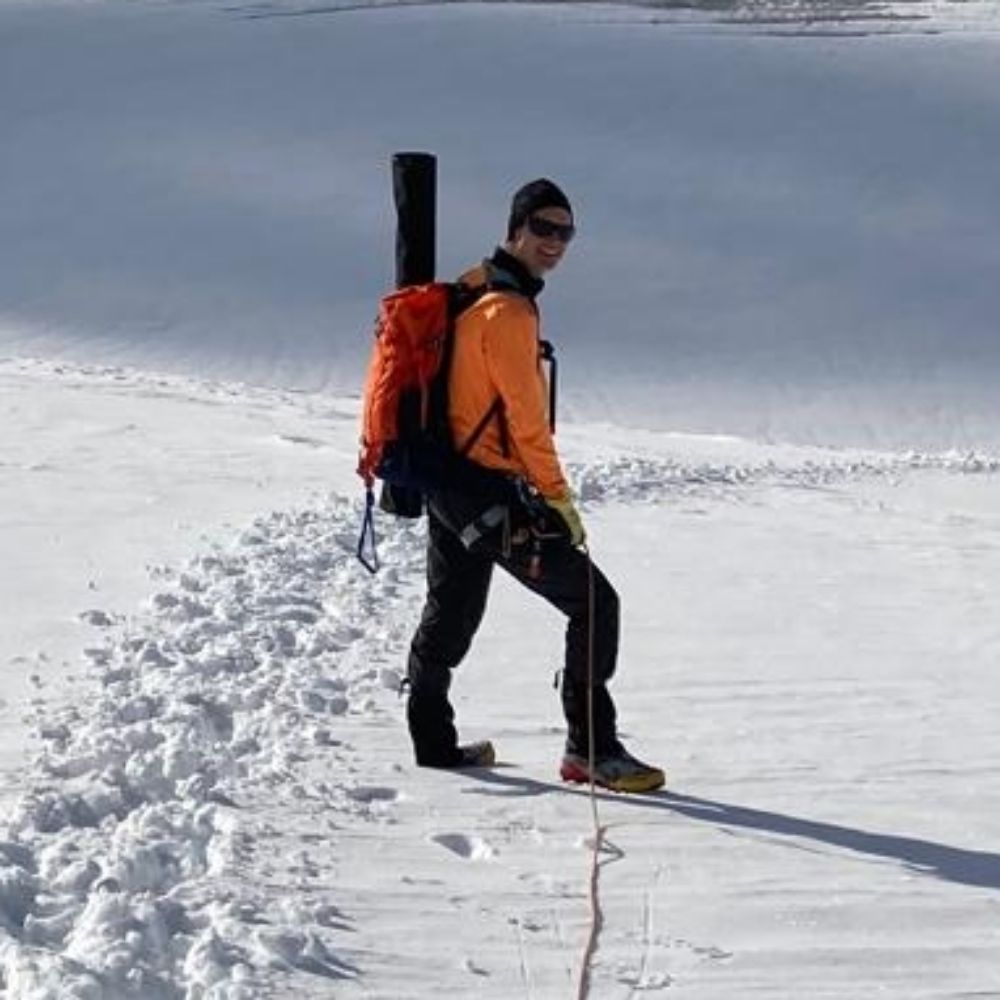
📣 New paper: Where do we want the glaciological
community to be in 2073?
Some context: The Karthaus summer school is an occasion where parts of our research community comes together — In 2023, I was lucky to participate myself and it was the year in which a new workshop was included in the program.
26.06.2025 07:37 — 👍 17 🔁 10 💬 1 📌 1
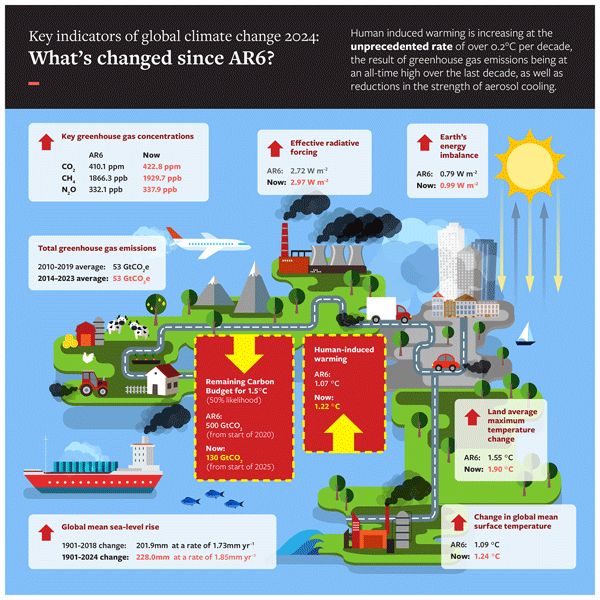
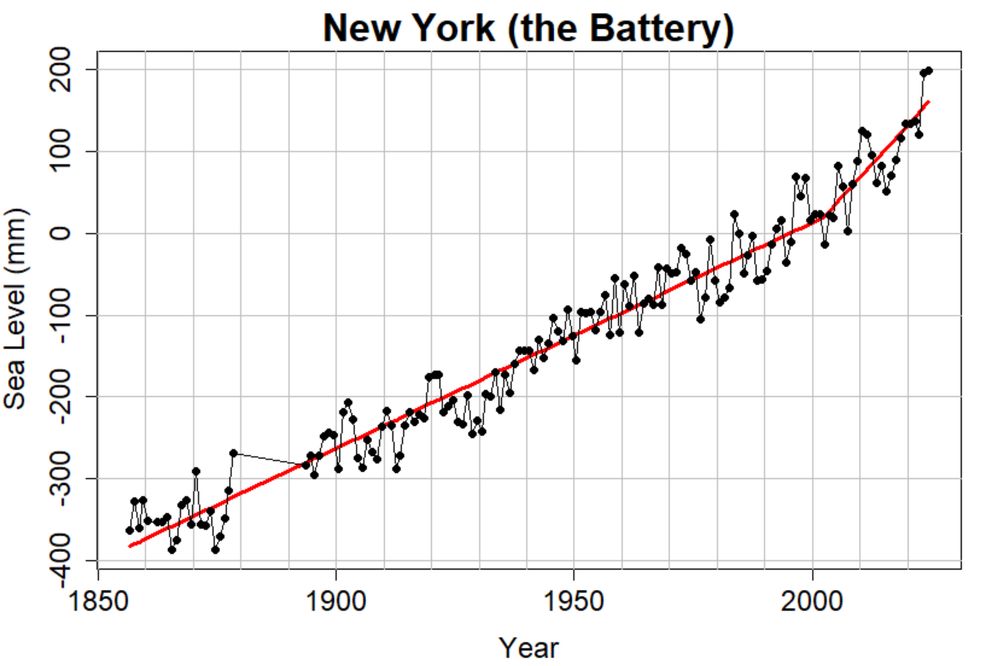
Indicators of Global Climate Change 2024: annual update of key indicators of the state of the climate system and human influence
Abstract. In a rapidly changing climate, evidence-based decision-making benefits from up-to-date and timely information. Here we compile monitoring datasets (published at https://doi.org/10.5281/zenodo.15639576; Smith et al., 2025a) to produce updated estimates for key indicators of the state of the climate system: net emissions of greenhouse gases and short-lived climate forcers, greenhouse gas concentrations, radiative forcing, the Earth's energy imbalance, surface temperature changes, warming attributed to human activities, the remaining carbon budget, and estimates of global temperature extremes. This year, we additionally include indicators for sea-level rise and land precipitation change. We follow methods as closely as possible to those used in the IPCC Sixth Assessment Report (AR6) Working Group One report. The indicators show that human activities are increasing the Earth's energy imbalance and driving faster sea-level rise compared to the AR6 assessment. For the 2015–2024 decade average, observed warming relative to 1850–1900 was 1.24 [1.11 to 1.35] °C, of which 1.22 [1.0 to 1.5] °C was human-induced. The 2024-observed best estimate of global surface temperature (1.52 °C) is well above the best estimate of human-caused warming (1.36 °C). However, the 2024 observed warming can still be regarded as a typical year, considering the human-induced warming level and the state of internal variability associated with the phase of El Niño and Atlantic variability. Human-induced warming has been increasing at a rate that is unprecedented in the instrumental record, reaching 0.27 [0.2–0.4] °C per decade over 2015–2024. This high rate of warming is caused by a combination of greenhouse gas emissions being at an all-time high of 53.6±5.2 Gt CO2e yr−1 over the last decade (2014–2023), as well as reductions in the strength of aerosol cooling. Despite this, there is evidence that the rate of increase in CO2 emissions over the last decade has slowed compared to the 2000s, and depending on societal choices, a continued series of these annual updates over the critical 2020s decade could track decreases or increases in the rate of the climatic changes presented here.
Our new paper updating key metrics in the IPCC is now out, and the news is grim:
⬆️ Human induced warming now at 1.36C
⬆️ Rate of warming now 0.27C / decade
⬆️ Sharp increase in Earth's energy imbalance
⬇️ Remaining 1.5C carbon budget only 130 GtCO2
essd.copernicus.org/...
18.06.2025 23:10 — 👍 659 🔁 482 💬 24 📌 67


#Art-science | @fpattyn.bsky.social presents "The sound of ice: using radar data and sonification in music composition" at #EGU today
🎵Amazing and inspiring work - check it out!
30.04.2025 08:51 — 👍 6 🔁 1 💬 0 📌 0
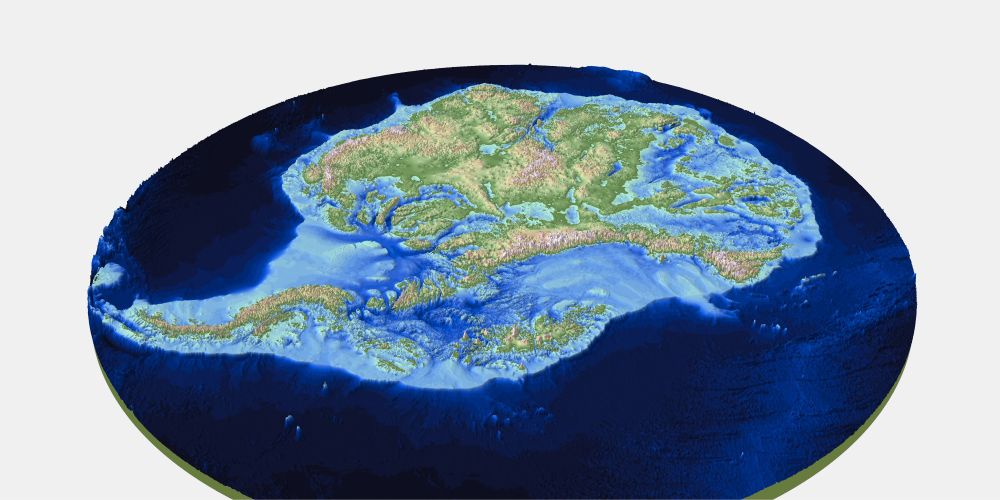
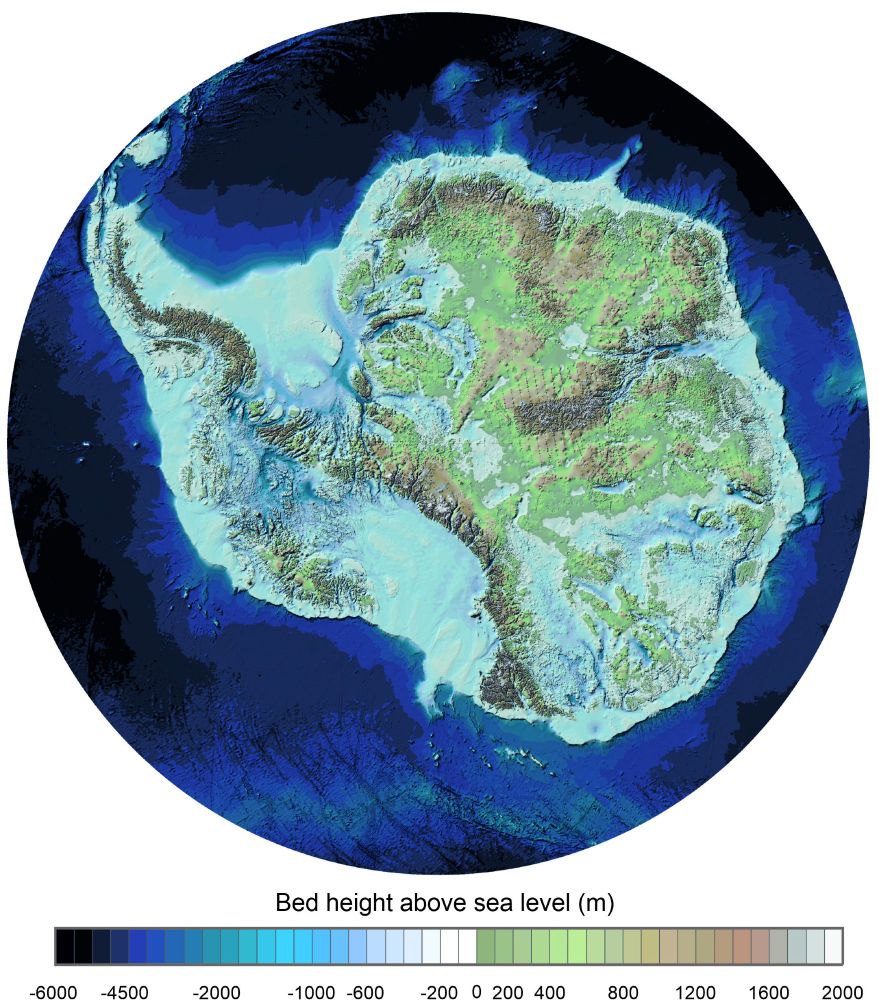
A map showing the topography of Antarctica, without ice
We’ve just published the most detailed map yet of the landscape beneath Antarctica’s ice sheet (called Bedmap3), and we learnt some pretty cool facts about Antarctica that you can use to impress your pals. Ready?
Graphic: Hamish Pritchard et al
14.03.2025 15:17 — 👍 382 🔁 136 💬 11 📌 17
Bedmap3 is now out
rdcu.be/ecTmO
10.03.2025 14:42 — 👍 200 🔁 75 💬 7 📌 14


🌊Submersion: a collaboration between art and science
Submersion, created by @h2020protect.bsky.social and featuring art and science, delves into the impact of melting glaciers and rising seas
🗓️Feb 1–Mar 1, 2025
📍Saint-Martin d'Hères, France
🔗 Learn more: protect-slr.eu/2025/01/15/s...
20.01.2025 11:21 — 👍 8 🔁 5 💬 1 📌 1

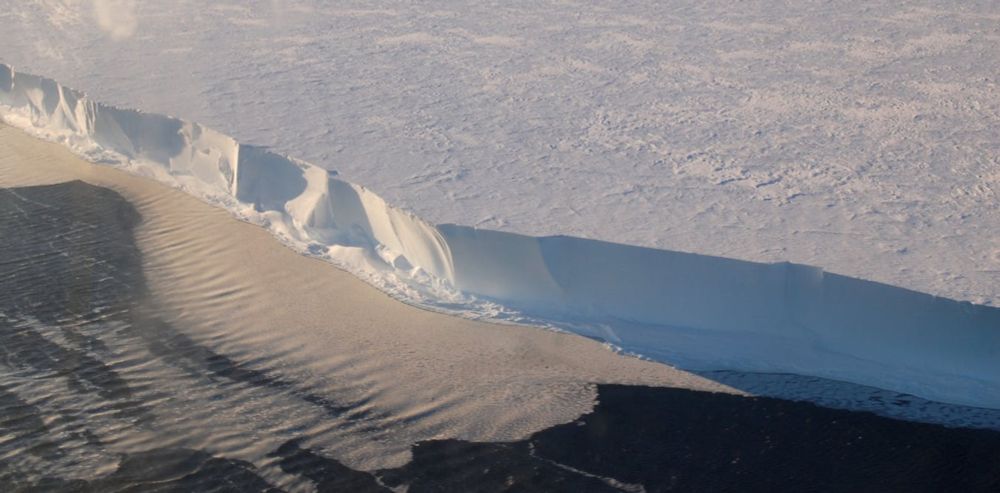
#Publication | #Antarctica ’s long-term sea-level impact 🌊
👉Even low emissions could lock in meters of #SeaLevelRise from Antarctica, while high emissions could trigger up to +40m over millennia
👉We must consider long-term sea-level commitment in coastal planning
🔗 protect-slr.eu/2025/01/15/n...
16.01.2025 13:37 — 👍 10 🔁 4 💬 1 📌 0
Check the entire policy-brief here!
view.genially.com/677e7c942787...
28.01.2025 13:14 — 👍 6 🔁 5 💬 0 📌 0

#FinalMeeting I Ann Kristin Klose investigates the long term evolution of the Antarctic Ice Sheet
29.01.2025 09:35 — 👍 2 🔁 1 💬 0 📌 0

Le président Donald Trump quitte l’accord de Paris : est-ce foutu pour la planète ?
Parmi la pluie de décrets que Donald Trump a signée dès le premier jour de son investiture comme 47e président des...
This article sums up quite well what I think (as well as my colleague Prof. Jean-Pascal van Ypersele) about President Trump's recent decision to withdraw from the Paris Agreement. For me, the biggest risk in the medium term is mainly his Minister of Efficiency...
www.rtbf.be/article/le-p...
21.01.2025 20:27 — 👍 10 🔁 4 💬 0 📌 0
🌊❄️ Ocean–ice–climate physicist. 🇦🇶 Antarctic modelling. Fulbright scholar. 🏃Ultra runner. ⚔️Anglo-Saxon & Viking history nerd. 🇦🇺 wish I had more 🏴.
PhD candidate studying crevasses on the Greenland Ice Sheet @UBuffalo
42 😊
(Neither my age nor my year of birth...)
https://linktr.ee/ralfgreve
Climate scientist at DMI, modelling all kind cool stuff over the Antarctic and Greenlandic domain.
CNRS researcher at IGE, Grenoble, France, working on the Antarctic Ice Sheet and its interactions with the climate system, sea level rise.
Université libre de Bruxelles (ULB) - Suivez-nous et restez informé·es de toutes nos activités et événements!
#ULB
Glaciologist and Lecturer at University of Innsbruck, Research Affiliate at CIRES, University of Colorado, Boulder. From Antarctica to Alaska via remote sensing and fieldwork.
Antarctic climate scientist, python programmer, ocean modeler, runner, hiker, gardener, pescatarian cooking enthusiast
Climate science, sustainability and climate solutions - International relations and humanitarianism - Tasmania and Japan - Order of the Rising Sun (Japan) - Optimist, problem solver
Location: Hobart, Tasmania, Australia
Website: stevenphipps.com
Scientist at BRGM - Coastal impacts of sea-level rise and adaptation.
IPCC AR6 lead author, French Climate Change Commitee, editor for Earth's Future.
Cycling in Orléans, Paris and other places.
Posts = My own viens.
glaciologist @ethzurich and @wslresearch.bsky.social, head of GLAMOS, passionate about mountains
6-year Novo Nordisk funded project. We develop and improve models for how ice sheets of Greenland and Antarctica contribute to raising the sea level in the world’s oceans. We aim to reduce uncertainties in future sea-level rise projections.
A team of scientists taking what we know about the global climate risks from polar change to the most powerful audiences.
linkin.bio/arcticbasecamp
Journaliste sciences et ex-rédaction internationale de @RTBFinfo Passé par @NotreAfrik @24h01revue Amoureux des Grands Lacs, du #Burundi en particulier
Researcher glacier-fjord interaction in Greenland 🇬🇱🧊🌊
PhD Candidate at @niozsearesearch.bsky.social and @utrechtuniversity.bsky.social 🇳🇱
A Scientific Standing Group of the International Association of Cryospheric Sciences (IACS) and the International Permafrost Association (IPA). Here for networking, collaboration, exchange.
Find us at gaphaz.org!
Journaliste
J'écris dans L'Echo : https://tinyurl.com/53ps948d
Glaciology research at Durham University on the past, present and future of our mountain glacier and ice sheet environments ❄️
https://durhamglaciology.wordpress.com/
Universitaire à Grenoble
Chimiste de l'atmosphère, qui s'intéresse à la zone critique de montagne, et à la circulation des nutriments dans les paysages enneigés
Aussi, je mesure des trucs