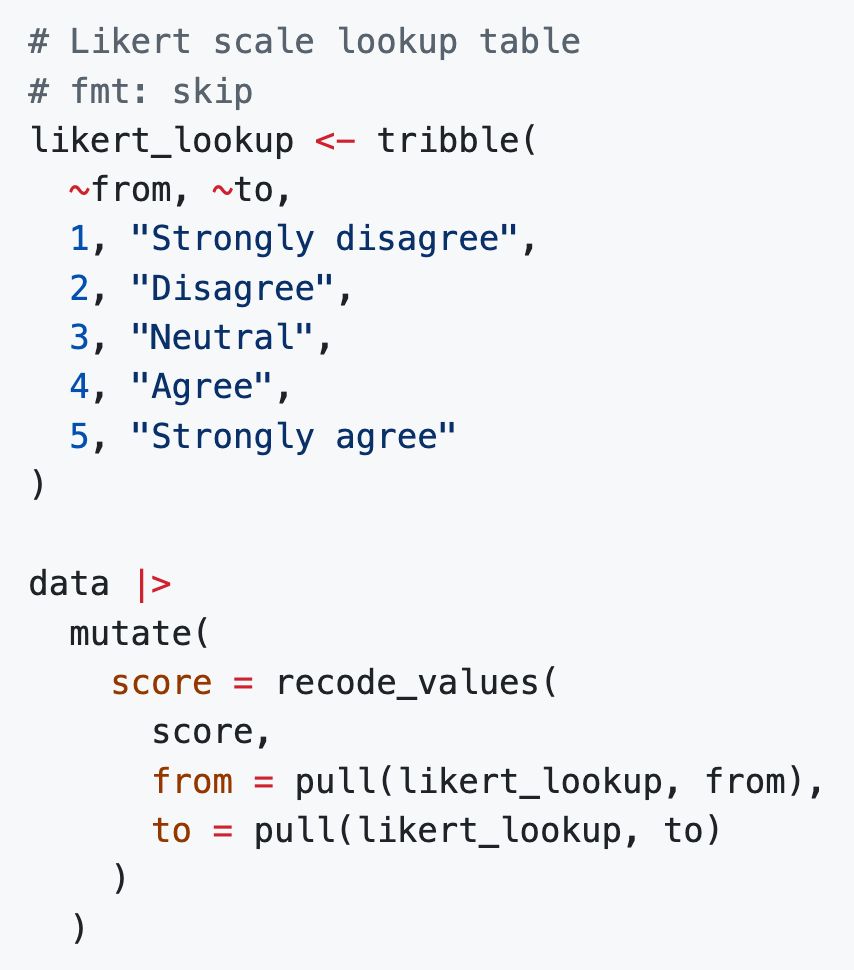
Recoding a `score` column using a Likert scale lookup table and a new `recode_values()` function in dplyr
If you find yourself still reaching for `dplyr::recode(x, !!!values)` or `plyr::mapvalues()`, then I think you'll like `recode_values()`!
04.08.2025 21:44 — 👍 26 🔁 8 💬 3 📌 1
We are looking for some community feedback on 3 new dplyr functions!
- replace_when()
- recode_values()
- replace_values()
New tools for recoding (think, lookup tables!) and replacing (think, replace `-99` with `NA` in `col`) in the tidyverse - I'm pretty excited about these!
04.08.2025 21:38 — 👍 85 🔁 26 💬 7 📌 0
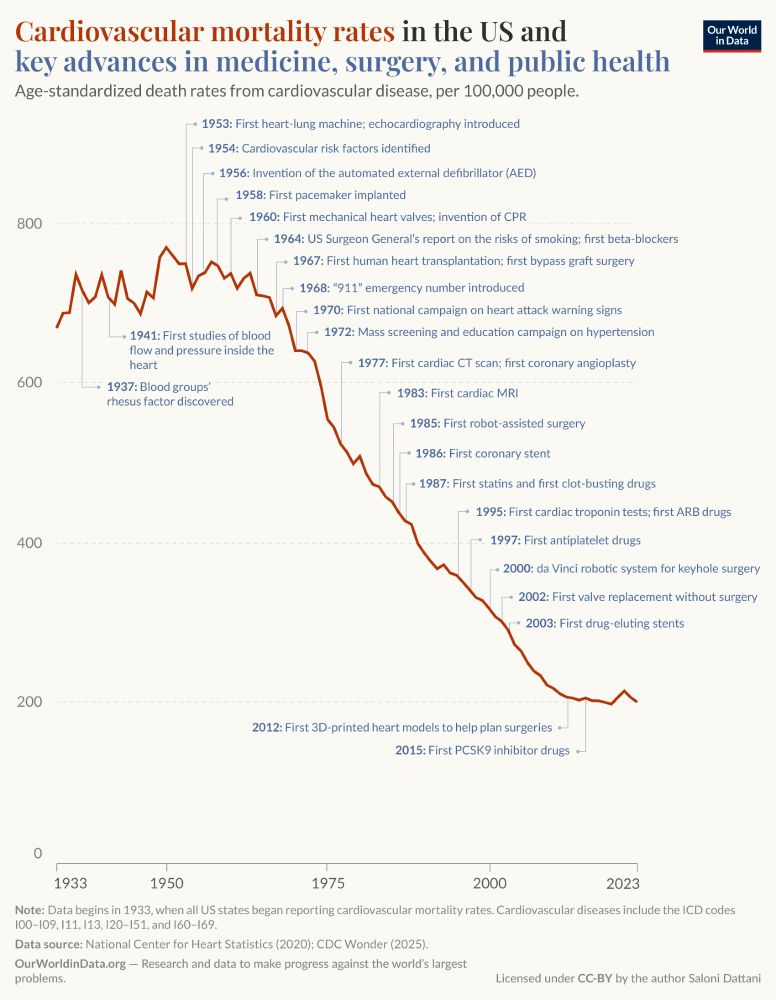
This image depicts a line graph showing cardiovascular mortality rates in the United States from 1933 to 2023, alongside key advancements in medicine, surgery, and public health. The y-axis represents age-standardized death rates from cardiovascular disease, ranging from 0 to 600. The x-axis represents years from 1933 to 2023.
The graph starts at around 600 deaths per 100,000 people in 1933 and trends downward sharply over the decades, indicating a significant decline in mortality rates. Key advancements are marked along the timeline, including the introduction of the first heart-lung machine in 1953, the first cardiac CT scan in 1977, and the first 3D-printed heart models in 2012.
Footnote information states that data begins in 1933 when all U.S. states started reporting cardiovascular mortality rates, sourced from the National Center for Heart Statistics in 2020 and the CDC Wonder in 2025. The chart is published by Saloni Dattani at Our World in Data.
New article by me!
Cardiovascular disease mortality rates have declined by around three-quarters since 1950, but we rarely hear about it.
I explore some of the reasons behind the decline.
ourworldindata.org/cardiovascul...
04.08.2025 12:52 — 👍 234 🔁 78 💬 11 📌 10
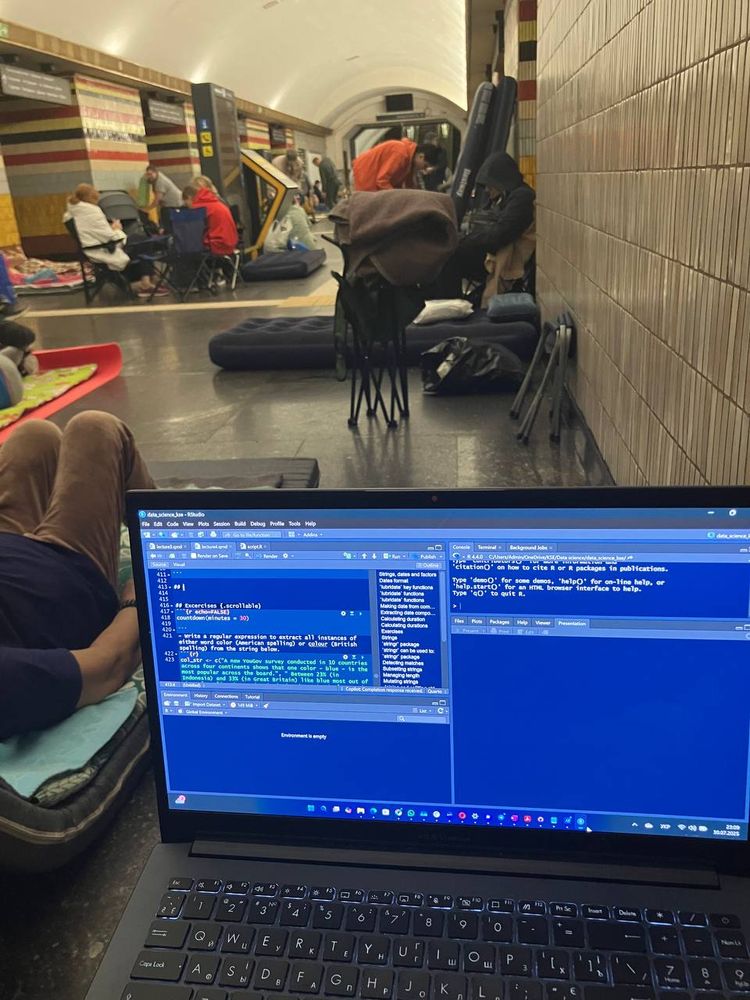
Writing lecture notes in Quarto during missile attack in Kyiv underground
#AcademicLife in Ukraine: preparing for lectures at night during a massive missile attack on Kyiv in an overcrowded underground station
#EconSky #UkrainianView #RStats
30.07.2025 21:33 — 👍 408 🔁 91 💬 13 📌 2
If you haven’t gotten into marginaleffects yet, this may be your chance. Learning about it has been quite transformative for how I think about statistical modeling 🪄
02.08.2025 13:36 — 👍 34 🔁 7 💬 3 📌 0
❗️Our next workshop will be on August 14, 6 pm CEST, on marginaleffects package by
@vincentab.bsky.social !
Register or sponsor a student by donating to support Ukraine!
Details: bit.ly/3wBeY4S
Please share! #AcademicSky #EconSky #RStats
02.08.2025 12:08 — 👍 30 🔁 14 💬 0 📌 2
Firing the BLS Commissioner — the wonk in charge of the statisticians who track economic reality — is an authoritarian four alarm fire.
It will also backfire: You can't bend economic reality, but you can break the trust of markets. And biased data yields worse policy.
01.08.2025 20:54 — 👍 10281 🔁 3300 💬 300 📌 159
The good news is, now that we've gotten rid of "data" the analytical value of vibes has skyrocketed
01.08.2025 18:29 — 👍 1527 🔁 191 💬 22 📌 7
That’s it I’m firing R because my results weren’t significant
02.08.2025 00:28 — 👍 124 🔁 18 💬 7 📌 3
Title slide for our talk at useR entitled "Plot Tiwst:Adding interactivity to the elegance of ggplot2 with ggiraph"
The virtual #user2025 event takes place today — and our talk "Plot Twist: Adding Interactivity to the Elegance of ggplot2 with ggiraph" airs is lined up next! 🎥
#rstats #ggiraph #ggplot2 #dataviz
01.08.2025 15:49 — 👍 52 🔁 12 💬 3 📌 0
"WASHINGTON, D.C. (August 1, 2025) – The Corporation for Public Broadcasting (CPB) announced today that it will begin an orderly wind-down of its operations"
cpb.org/pressroom/Co...
01.08.2025 16:59 — 👍 3906 🔁 2025 💬 465 📌 1234
That’s what I’m thinking. Personally, I had a wooden bat with nails in it so same vibe
01.08.2025 14:05 — 👍 2 🔁 1 💬 0 📌 0
Also I thought you were holding a metal baseball bat and I thought that’s a pretty cool way to take a defense picture
01.08.2025 14:01 — 👍 13 🔁 2 💬 4 📌 0
Congrats, Dr. Carr!
01.08.2025 14:00 — 👍 4 🔁 0 💬 1 📌 0
YouTube video by useR! Conference
A first look at Positron - Julia Silge
My @user-conf.bsky.social virtual talk, a first look at Positron for #rstats folks, posted while I was asleep 😴 but you can catch it here:
youtu.be/aKSrptGegeo?...
01.08.2025 13:44 — 👍 19 🔁 6 💬 1 📌 0
YouTube video by useR! Conference
A first look at Positron - Julia Silge
It's the virtual day for useR! Some of the talks are already available, including this one: I always enjoy @juliasilge.com explaining things so if you are curious about the Positron IDE (it's out of beta now!), this is for you:
www.youtube.com/watch?v=aKSr... #rstats
01.08.2025 11:12 — 👍 24 🔁 8 💬 0 📌 0
Hello #dataBS! I'm facilitating a new free @dslc.io Advanced #RStats adv-r.hadley.nz cohort soon! It's been 5+ years since I read this excellent book by @hadley.nz, so I'm giving it a re-read. Let's learn to embrace {{ tidy evaluation }}, purrr::reduce() repetition, and count S/R #OOP systems!
30.07.2025 12:10 — 👍 30 🔁 9 💬 2 📌 1
A promotional image for "Introduction to Machine Learning in R with tidymodels" at posit conf (2025). The image features Simon Couch, from Posit, smiling outdoors in a headshot. The text "Atlanta" and "Sept. 16-18" are also visible, alongside abstract cubes in orange, green, and blue.
A promotional image for "Causal Inference in R" at posit conf (2025). The image features two individuals: Malcolm Barrett from Stanford and Lucy D'Agostino McGowan from Wake Forest University. Malcolm Barrett is shown in a headshot with a blurred background, and Lucy D'Agostino McGowan is shown smiling with a blackboard in the background. The text "Atlanta" and "Sept. 16-18" are also visible, along with abstract cubes in orange, green, and blue.
A promotional image for "Getting More Out of Feature Engineering and Tuning for Machine Learning" at posit conf (2025). The image features Max Kuhn and Emil Hvitfeldt, both from Posit. Max Kuhn is shown in a headshot with a blurred background, and Emil Hvitfeldt is shown smiling with plants in the background. The text "Atlanta" and "Sept. 16-18" are also visible, along with abstract cubes in orange, green, and blue.
Check out our Modeling & ML with #RStats workshops at posit::conf!
🔢 Intro to ML w/ tidymodels @simonpcouch.com
🏗️ Feature Engineering & Tuning @topepo.bsky.social @emilhvitfeldt.bsky.social
↔️ Causal Inference @malcolmbarrett.malco.io @lucystats.bsky.social
Learn more: pos.it/conf-2025-workshops
29.07.2025 20:17 — 👍 20 🔁 9 💬 0 📌 1
“We used ANOVA, where our research question went through dimension reduction”
29.07.2025 14:30 — 👍 3 🔁 0 💬 0 📌 0
The big show
27.07.2025 09:38 — 👍 1 🔁 0 💬 0 📌 0
Going outside but shaking my head the whole time so people know I don’t agree with what’s going on
06.11.2024 08:07 — 👍 1790 🔁 313 💬 10 📌 3
Part 3 is Finished, Part 4 Started – Applied Predictive Modeling Blog
We've released 4 new chapters of Applied Machine Learning for Tabular Data.
Includes: Bayesian optimization, feature selection, model comparisons, classification metrics, calibration, #rstats computing sections, and more
blog.aml4td.org/posts/2025-0...
25.07.2025 16:53 — 👍 49 🔁 10 💬 2 📌 0
i need someone to do this to my brain
25.07.2025 06:13 — 👍 307 🔁 35 💬 33 📌 7
A @sherrirose.bsky.social classic!
24.07.2025 16:02 — 👍 2 🔁 0 💬 1 📌 0
Yeah but a common support group sounds very positive
24.07.2025 16:00 — 👍 1 🔁 1 💬 0 📌 0
Shhh don’t scare them away Paul!!!!
24.07.2025 15:00 — 👍 2 🔁 0 💬 0 📌 0
There should probably be a support group for comforting and being comforted that the theory behind TMLE is legitimately hard. It is!
24.07.2025 14:53 — 👍 4 🔁 0 💬 1 📌 0
Throw in “something something clever covariate” and you’re there
24.07.2025 14:48 — 👍 7 🔁 0 💬 2 📌 0
Data scientist, #rstats developer, and educator.
Passionate about permaculture, automated systems and design (🐝🥚🍅🌻🍄🤖).
Infectious disease epidemiologist - RAND global health security policy & UMB Asst Professor working in pandemic prep, biosurveillance, One Health, AMR, BW & biosecurity. ELBI & CFR ☣️
Biopreparedness & biothreat guru - movie aficionado. Views=my own
Labor economist, personal account, all opinions my own
meta-research on measurement (standardisation), online data quality, and reproducibility.
Epidemiological investigator of diet and disease. Also pizza expert and parent.
@au.dk
Wannabe Rstats-fu in the Far East.
Chilean, Assistant Prof. of Res. at @utah.edu Trained at @usc.edu, @caltech.edu, and UAI School of Government. #sna #complexsystems #rstats #netsci (he/him/él). 👨💻🕸️🎸
https://ggvy.cl
Bot postings at @ggvy.cl 🤖
Sociologist/demographer specializing in mortality, racial inequity, Covid-19. Avid theater-goer, inconsistent powerlifter, and erstwhile operator of an all-volunteer bookstore. Toddler parent. Living not-quite-car-free in Minneapolis. she/her
Lurking for #RStats and #Python content
Devoted to development & use of evidence to improve educational policy, practice, & outcomes. Evidence Use in Education, LLC. Past president https://aefpweb.org/. Co-editor: http://rb.gy/ipo4d5 & https://eric.ed.gov/?id=ED603550
researchpractice.org
Psychology prof & behavior geneticist. Author of THE GENETIC LOTTERY (2021) and ORIGINAL SIN (coming 2026).
Surgeon, Writer ("Being Mortal," "Checklist Manifesto"), and formerly led Global Health @USAID.
Python library for creating static, animated, & interactive visualizations. Chat w/ us @ https://discourse.matplotlib.org/
Sponsored by NumFocus
Berlin-themed history, culture and travel website. We are community funded—the only thing we sell is memberships: https://steadyhq.com/en/slowtravelberlin
asst. prof. of (bio)statistics at harvard—causal inference, semi-parametric estimation, machine learning, open-source software for statistics.
research webpage: https://nimahejazi.org
avid runner, concertgoer, timezone hopper
Get ready for a new era in astronomy and astrophysics with Rubin Observatory!
Para español siga a Instagram: http://instagram.com/rubin_observatory
phd student @ yale school of public health | nsf graduate research fellow | viruses 🦠, vectors 🦟, and climate change 🌎 | usc alum ✌🏻| kansan 🌻 | (she/her)
PhD candidate @ UC Santa Barbara Comm | I study how people detect, perceive & respond to AI/algorithmic bias | On the market!
https://www.hannahoverbye.com/
Python 3.14 & 3.15 release manager, core developer, Sovereign Tech Fellow, PSF Fellow, open-source maintainer, PEP editor, NaNoGenMo organiser, winter bicycler