This is true today and as the grid gets cleaner and the manufacturing of EVs gets cleaner the gap will only widen. More and more, cleaner also means cheaper.
09.12.2025 15:51 — 👍 4 🔁 1 💬 0 📌 0

Many Fighting Climate Change Worry They Are Losing the Information War
Of course climate denial is also deeply misogynistic.
>Climate skeptics present their position as “projecting rationality, authority, and masculine self-control” while those who acknowledge global warming “are depicted through emotionally charged, feminized, and irrational imagery…”<
30.11.2025 18:52 — 👍 31 🔁 10 💬 3 📌 1

Climate Viz of the Month
October 2025 Hi everyone! Instead of designing a new special feature visualization, this next ‘climate viz of the month’ blog will focus on briefly summarizing the recent extremes in th…
October 2025 was the warmest October on record for the #Arctic. Arctic sea-ice extent is currently the lowest on record for late November. My newest 'climate viz of the month' summarizes some of this latest data: zacklabe.com/climate-viz-...
#ClimateChange #SciComm #OpenScience #OpenData #DataViz
29.11.2025 20:42 — 👍 316 🔁 179 💬 7 📌 31

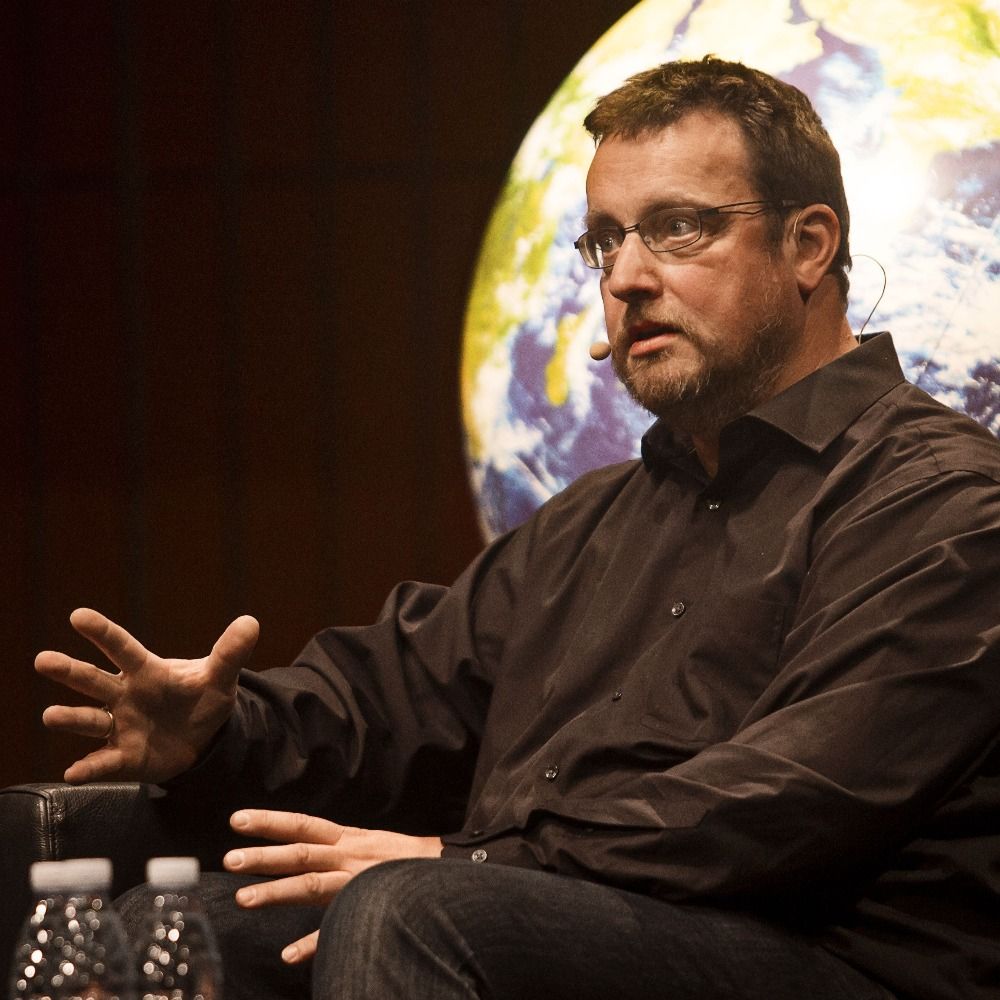
Clean electrification is inevitable
Podcast Episode · Volts · 11/21/2025 · 1h 23m
Perhaps the most obvious reason why the energy transition is inevitable is that 3/4 of the world’s people live in countries that import fossil fuels and the sun shines everywhere.
22.11.2025 05:06 — 👍 10 🔁 1 💬 0 📌 0
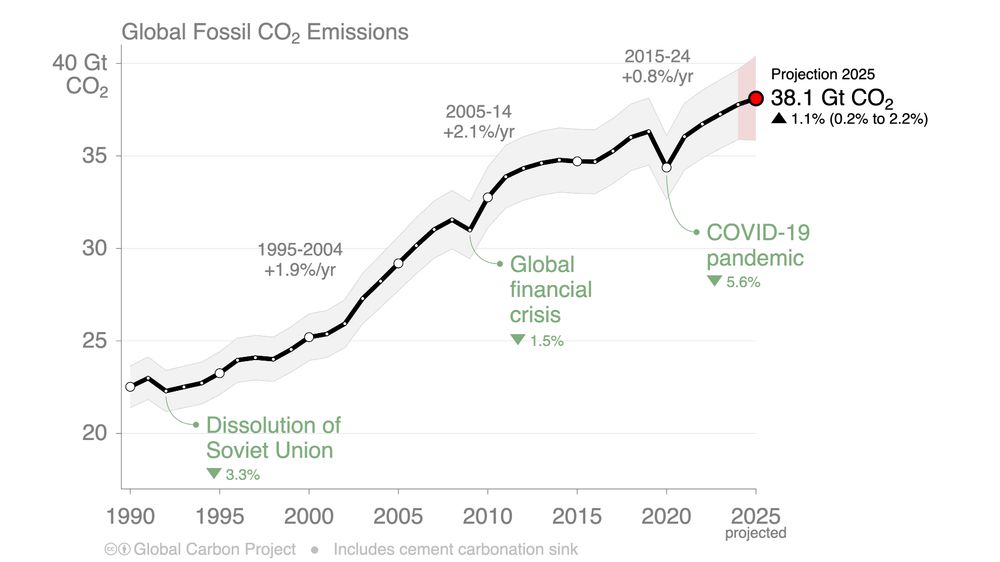
Line graph time series of global fossil CO2 emissions since the late 1950s to 2025. 2025 is at record high levels of 38.1 Gt CO2, which is an increase of 1.1%. Historical events, such as the first oil crisis and COVID-19 are annotated.
I wish there was better news than this headline ⚒️🧪
"Global carbon emissions from fossil fuels are projected to rise by 1.1% in 2025 - reaching a record high" (globalcarbonbudget.org/fossil-fuel-...)
+ Global Carbon Budget 2025 is out globalcarbonbudget.org/gcb-2025/
+ Paper doi.org/10.5194/essd...
19.11.2025 13:07 — 👍 109 🔁 62 💬 4 📌 9

Jobs - The Restart Project
Work with us! We list vacancies here but speculative applications are always welcome. And we're always looking out for London-based volunteers.
🫵 Passionate about #repair? Mad at products designed to break? Looking for a fun and meaningful job?
Our friends at @r2reurope.bsky.social are hiring a new Campaign Manager.
Apply or spread the word - all info here👇
therestartproject.org/about/jobs/ @therestartproject.org #EUJobs #GreenJobs
12.11.2025 09:31 — 👍 8 🔁 5 💬 0 📌 0

Line graph time series of 2-m air temperature anomalies for the Arctic in every October from 1979 to 2025. There is a long-term warming trend, and 2025 is the warmest on record in this time series. Data is from ERA5 with a 1981-2010 climate baseline used for calculating the anomalies.
It's not every day that both poles set new monthly temperature records (see my earlier post). Last month also observed the warmest October on record for the #Arctic Circle. Not great!!
Data provided by doi.org/10.24381/cds....
08.11.2025 14:07 — 👍 144 🔁 78 💬 3 📌 1

Webpage for Climate Central where you can sign up for Newsletters and Alerts
🌡Every month, Climate Central breaks down the latest on climate change, so you don’t have to.
Our free monthly newsletter delivers:
▶️Localized climate impact insights
▶️Science-backed updates
▶️User-friendly tools/visualizations
Subscribe today!
bit.ly/3JB64Pe
04.11.2025 16:03 — 👍 29 🔁 12 💬 0 📌 0
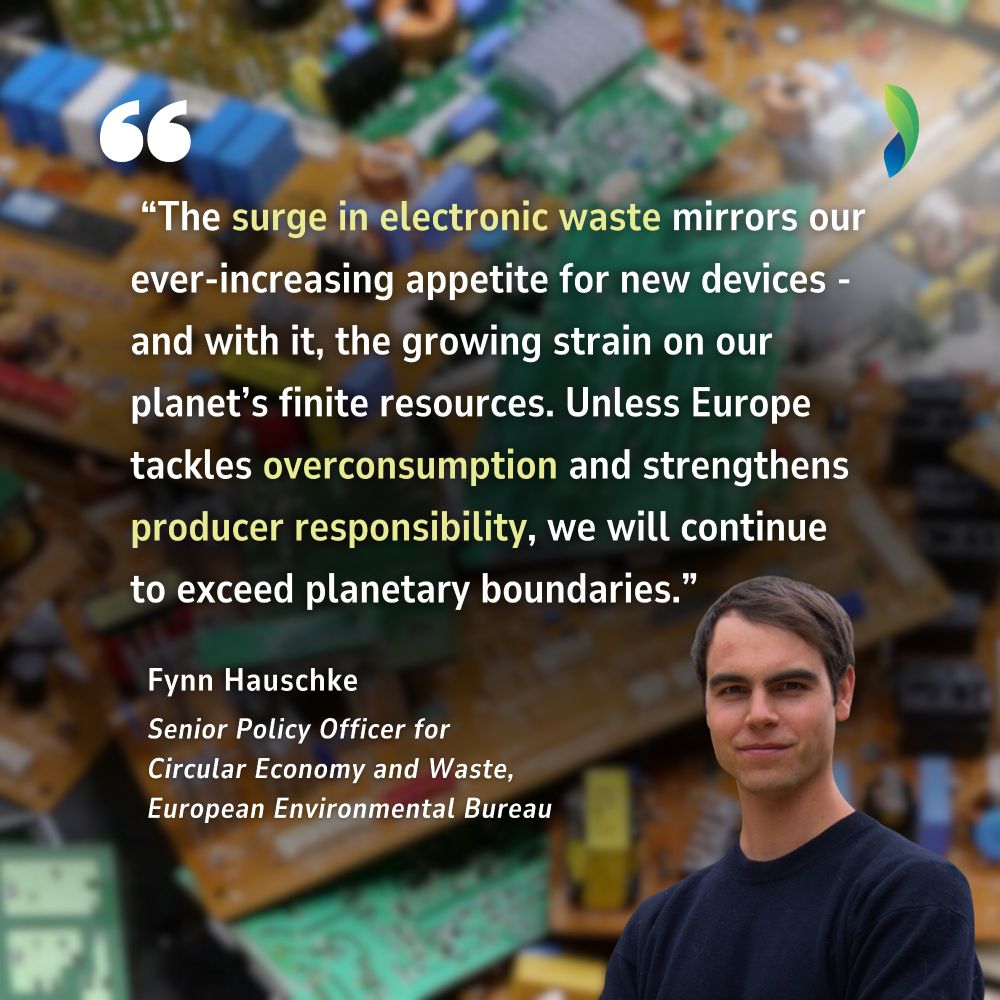
New #Eurostat figures reveal a troubling trend:
Europe’s appetite for ever more #electronics keeps growing, while collection and recycling lag far behind -fuelling mountains of #Ewaste across the EU.
Read our press release with @umwelthilfe.bsky.social & @ecos.ngo: eeb.org/new-data-rev... #weee
30.10.2025 15:15 — 👍 14 🔁 9 💬 1 📌 0

Screenshot that says "Melissa has passed over waters made 1.4°C warmer, on average, by climate change." and "Climate change made the ocean temperatures along Melissa's path 500 to 900 times more likely." along with a map of Hurricane Melissa's path.
To understand the climate connection to Hurricane Melissa, check out our real-time attribution page at @climatecentral.org: www.climatecentral.org/tropical-cyc...
"Climate change made the ocean temperatures along Melissa's path 500 to 900 times more likely."
28.10.2025 15:25 — 👍 354 🔁 185 💬 6 📌 11
I ♥️ #privacy #freedom
so do a lot of #GameDev
10.10.2025 23:40 — 👍 11 🔁 3 💬 1 📌 1

Orthographic map showing 2-m air temperature anomalies in September 2025 relative to a 1981-2010 baseline. This visualization shows North and South America. Most areas are warmer than average.
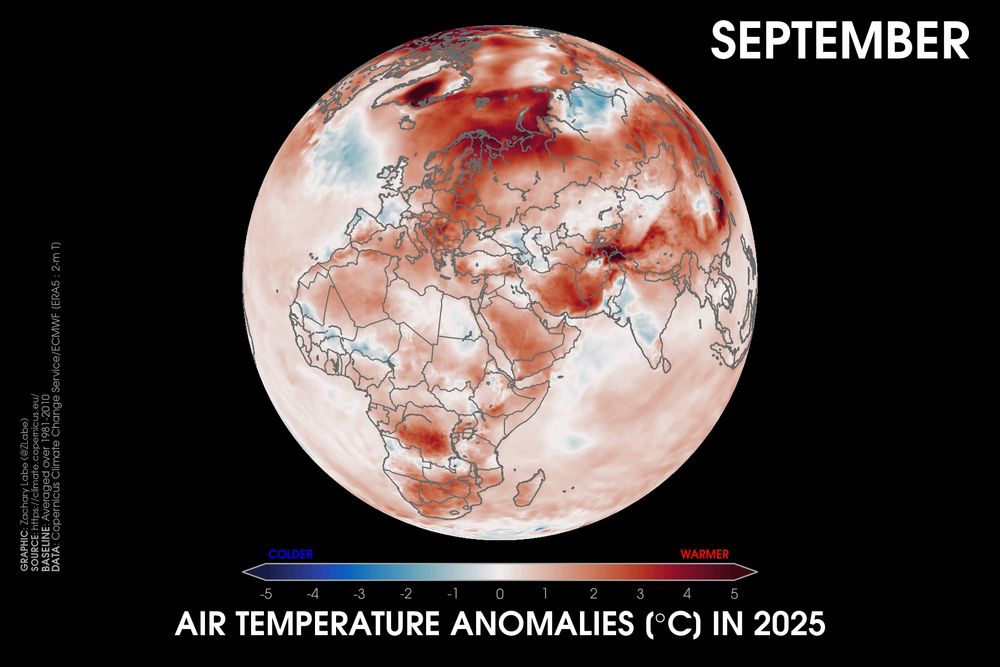
Orthographic map showing 2-m air temperature anomalies in September 2025 relative to a 1981-2010 baseline using ERA5 data. This visualization shows Africa, Europe, and western Asia. Most areas are warmer than average.

Orthographic map showing 2-m air temperature anomalies in September 2025 relative to a 1981-2010 baseline using ERA5 data. This visualization shows Australia, Antarctica, and Asia. Most areas are warmer than average, except for parts of Australia and Antarctica.
September 2025 was the 3rd warmest September on record for our planet, following 2023 (1st place) and 2024 (2nd place). The last 12-months have been about 1.51°C above the 1850-1900 pre-industrial average.
Summary of month: climate.copernicus.eu/surface-air-... via @copernicusecmwf.bsky.social data
09.10.2025 12:27 — 👍 84 🔁 34 💬 5 📌 3
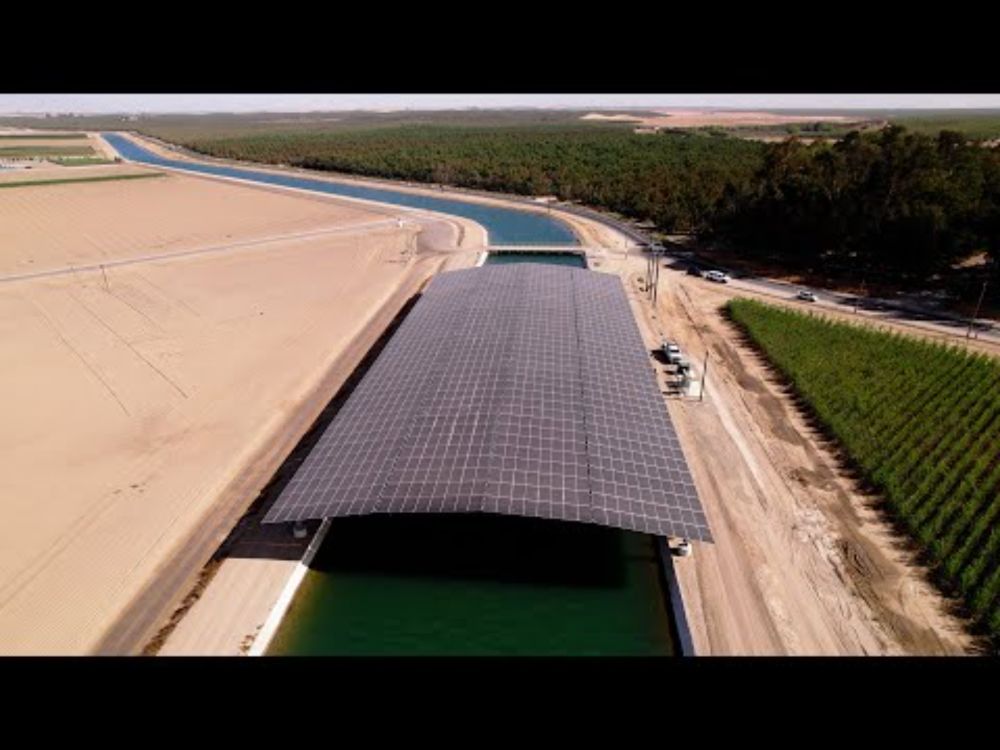
YouTube video by climatecentral
Solar Canals: Creating Clean Energy Corridors
California has just switched on its first canal solar project, transforming two Central Valley irrigation canals into power sources.
As Ben Tracy reports, research suggests this approach could help California save more than 60 billion gallons of water every year.
www.youtube.com/watch?v=He1l...
08.10.2025 19:56 — 👍 38 🔁 17 💬 1 📌 1

Around 78% of the world has seen all-time maximum monthly temperature records set since the year 2000, with 38% set in past five years alone. In a new analysis over at The Climate Brink I take a look at where and when records were set: www.theclimatebrink....
06.10.2025 16:26 — 👍 64 🔁 20 💬 2 📌 2

Groundbreaking study shows how solar panels age after 30 years of use: 'It's an important message to the photovoltaic industry'
"Everything that goes into a panel ... has a great influence on performance."
We may find that solar panels are still working well after half a century. Could this have implications on the future of financing?
"A study of six, three-decade-old arrays in Switzerland found them to still be working well, retaining more than 80% of their initial power."
02.10.2025 17:36 — 👍 110 🔁 45 💬 3 📌 3
YouTube video by climatecentral
THE LONGEST HIKE: A Family’s Journey on Disappearing Ice
40 years of documenting vanishing glaciers.
Take a hike with Ben Tracy to witness how one father/daughter team is blending science and art to tell a story of climate change, loss, and legacy.
#ClimateMatters
youtu.be/MS9sTb72eXw
26.09.2025 21:41 — 👍 18 🔁 8 💬 0 📌 0
As the 2025 Atlantic hurricane season kicks off—with forecasters warning of up to five major storms—Ben Tracy goes on assignment with Climate Central to explore homes built to take the hit. Discover…
Built to Survive: Ben Tracy Goes Inside the Next Generation of Hurricane Homes
🌊 Warmer oceans fuel stronger, more intense hurricanes.
🏚️ That can mean more damage—and higher insurance costs.
Ben Tracy shows how homes are taking a hit, and how new designs can better weather the storms. #ClimateMatters
22.09.2025 15:40 — 👍 14 🔁 4 💬 0 📌 0
YouTube video by climatecentral
If summer 2025 felt different, here's how climate change played a role
🌍 940 cities. 240 countries.
June–August 2025 brought relentless extreme heat across the planet.
How much of this was driven by human-caused climate change? Let's dive in⤵️
youtube.com/shorts/rMWiq...
18.09.2025 20:32 — 👍 9 🔁 7 💬 0 📌 0
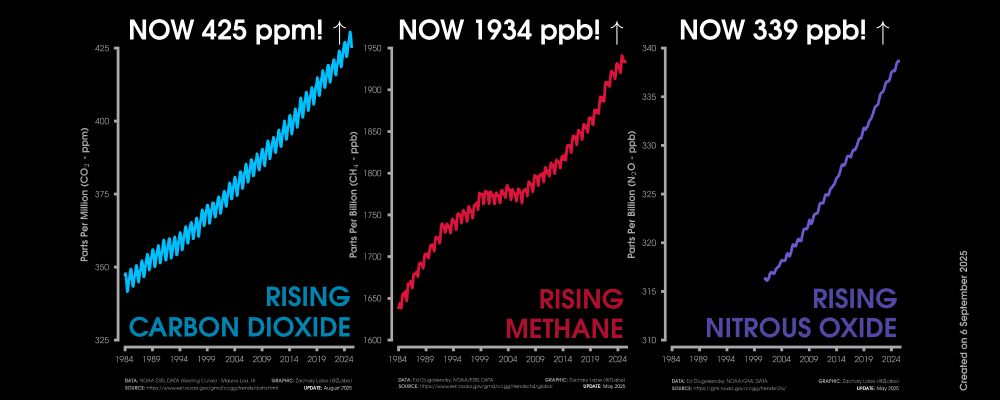
Graphic shows three line graph time series of monthly carbon dioxide abundance in ppm (blue line), monthly methane abundance in ppb (red line), and monthly nitrous oxide in ppb (purple line). Graphs are all shown from January 1984 through May 2025/August 2025. Current levels of CO2 are 425 ppm. Current levels of methane are 1934 ppb. Current levels of nitrous oxide are 339 ppb. All graphs show long-term increasing trends along with some interannual variability and seasonality.
Speaking of greenhouse gases...
🙄 www.axios.com/2025/09/12/e...
12.09.2025 22:12 — 👍 110 🔁 49 💬 5 📌 5

Green line graph time series of average sea surface temperature anomalies for each May-July from 1854 through 2025. There is large interannual variability, but an overall long-term increasing trend. Anomalies are computed relative to a 1981-2010 baseline. 2025 is the 3rd warmest on record.
Our oceans are warming. Here is a look at the globally averaged sea surface temperature over the last three months relative to each May-June-July period since 1854.
Data from NOAA ERSSTv5: www.ncei.noaa.gov/products/ext... 🌊
30.08.2025 15:00 — 👍 105 🔁 59 💬 4 📌 4

Line graph time series of monthly global sea ice volume anomalies from January 1979 to July 2025. There is a long-term decreasing trend. Anomalies are computed relative to the 1981-2010 climatology. There is a lot of interannual variability.
The size of the current global sea-ice volume departure is near record levels, with thinner than average ice found in both the #Arctic and #Antarctic.
Graphic from zacklabe.com/global-sea-i...
30.08.2025 18:14 — 👍 96 🔁 48 💬 1 📌 6
Remember six years ago when the science told us we needed to reduce greenhouse gas emissions by at least 7.6% every year for the next decade?
Anyway, don't give up. We have a lot of catch up to do.
unfccc.int/news/cut-glo...
22.08.2025 13:59 — 👍 3 🔁 1 💬 0 📌 0
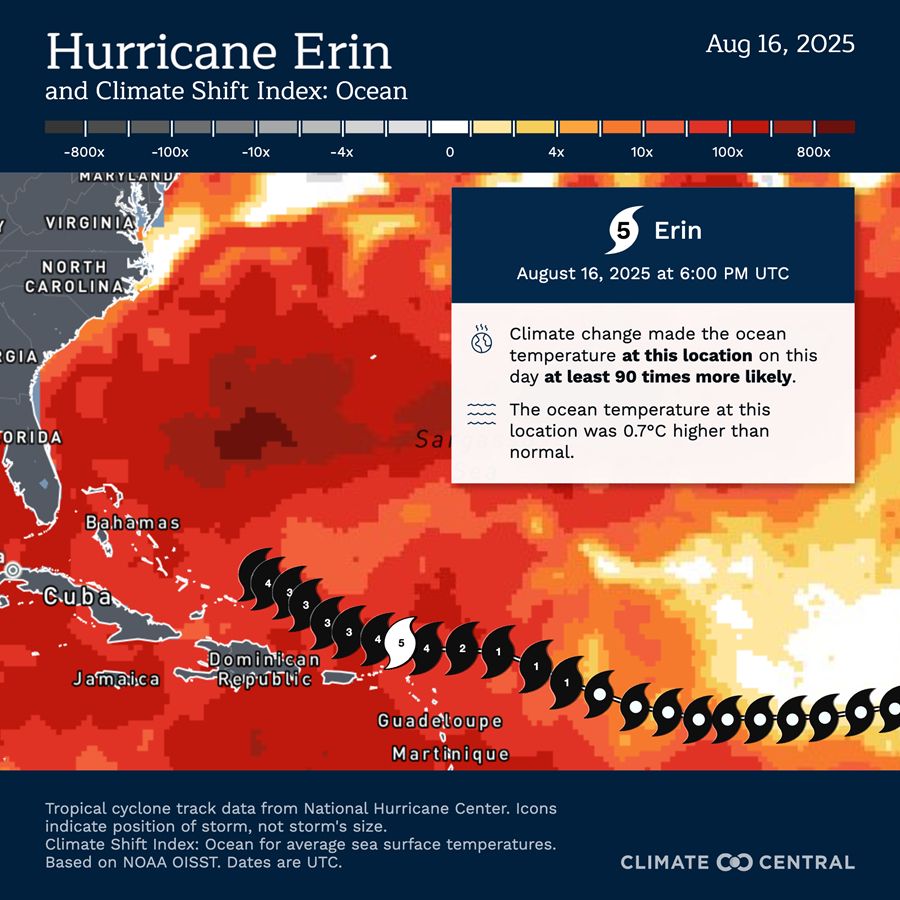
Map of Hurricane Erin’s track across the Caribbean into the Atlantic. Ocean shown in deep red heat. Callout: Climate change made ocean temps here 90x more likely and 0.7°C hotter than normal.
Between Aug 15–16, Hurricane #Erin exploded from Cat 1 to Cat 5 in just over 24 hours.
Winds ramped up 85 mph—topping out at 160 mph—over abnormally hot Atlantic waters amplified by human-caused, heat-trapping pollution.
Here’s what attribution science shows 🧵
18.08.2025 23:26 — 👍 26 🔁 15 💬 2 📌 1
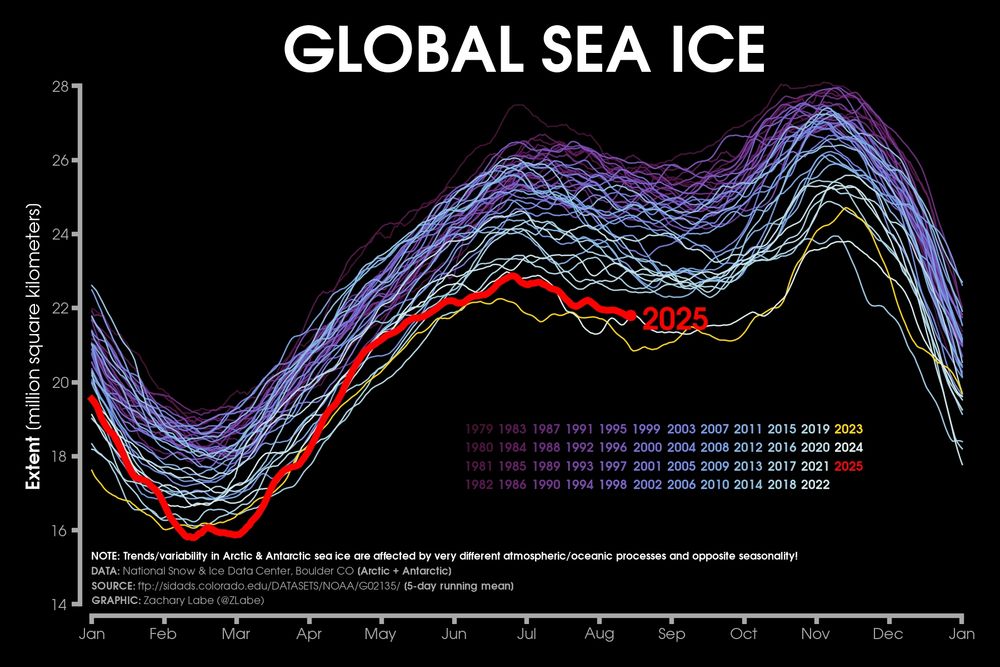
Line graph time series of 2025's daily global sea ice extent in red shading compared to each year from 1979 to 2024 using shades of purple to white for each line. There is substantial interannual and daily variability. Seasonal cycles are visible. A disclaimer is shown, which states: Trends/variability in Arctic and Antarctic sea ice are affected by very different atmospheric/oceanic processes and opposite seasonality!
The extent of global sea ice cover is statistically tied for the 2nd lowest on record for this year time of year, with anomalies coming from both poles.
More sea ice graphics available at zacklabe.com/global-sea-i.... Data from @nsidc.bsky.social at nsidc.org/data/seaice_....
16.08.2025 00:07 — 👍 104 🔁 33 💬 1 📌 1
Aside from the human health and environment harms of micro and nanoplastics pollution, the production and incineration of plastic is also responsible for emissions equivalent to >850 million metric tons of CO2, or roughly 5.3% of global GHG emissions.
04.08.2025 12:18 — 👍 3 🔁 2 💬 1 📌 0
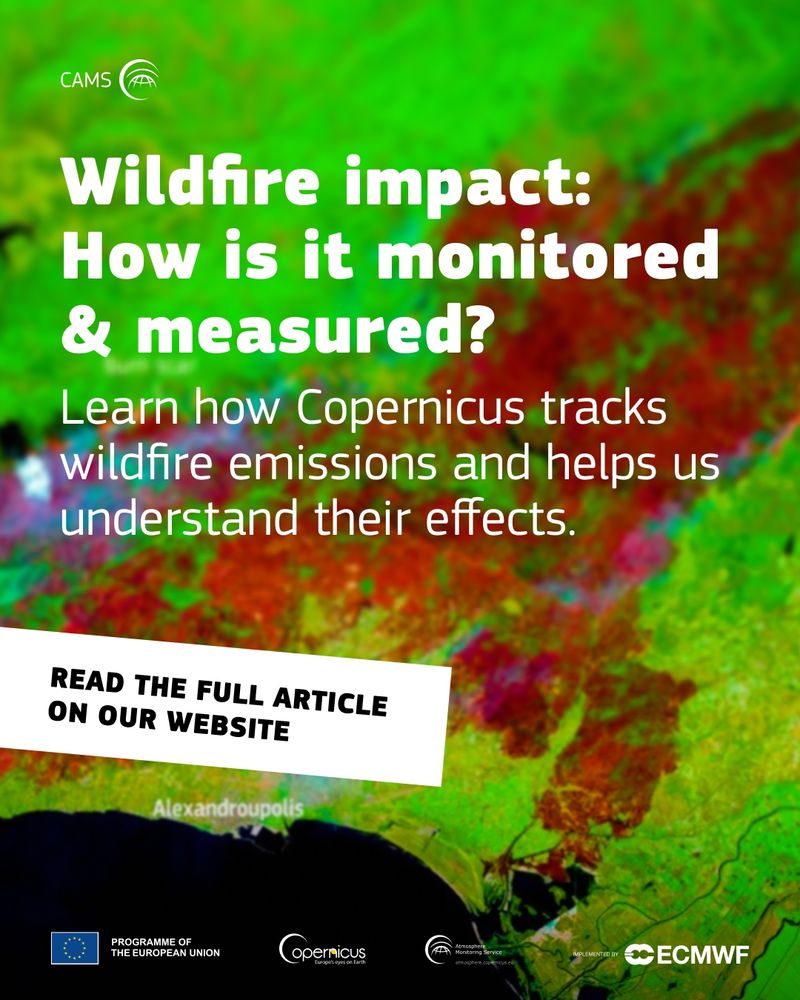
🔥Wildfires are growing more frequent and intense, fuelled by climate change and extreme weather. How do we measure their true impact? With near real-time data, CAMS tracks wildfire emissions, while C3S provides a range of fire-related datasets.
04.08.2025 12:26 — 👍 35 🔁 22 💬 1 📌 1
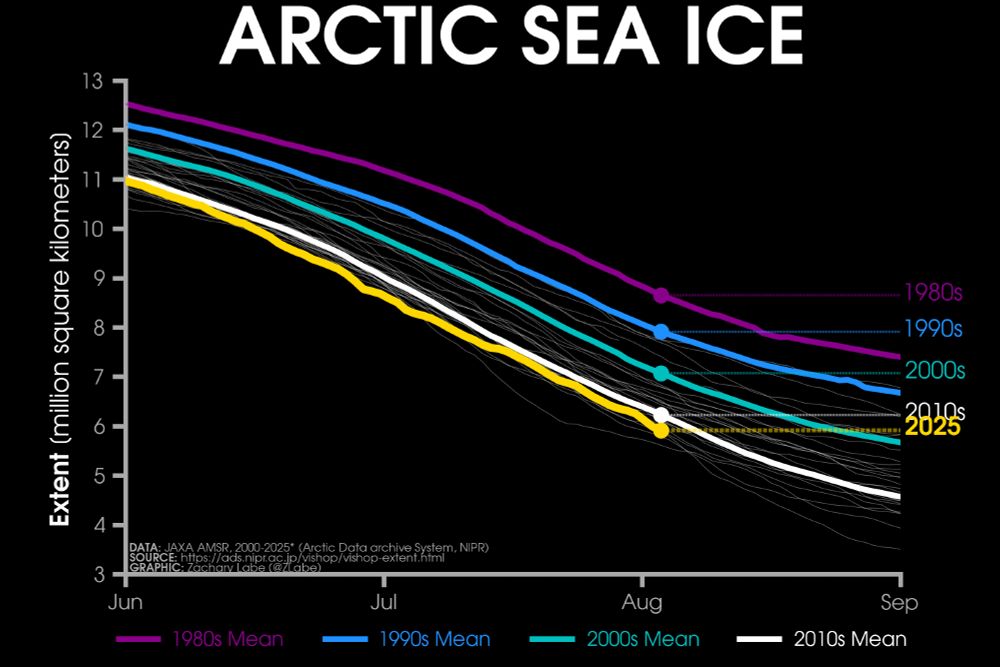
Line graph time series of 2025's daily Arctic sea ice extent compared to decadal averages from the 1980s to the 2010s. The decadal averages are shown with different colored lines with purple for the 1980s, blue for the 1990s, green for the 2000s, and white for the 2010s. Thin white lines are also shown for each year from 2000 to 2024. 2025 is shown with a thick gold line. There is a long-term decreasing trend in ice extent for every day of the year shown on this graph between June and September by looking at the decadal average line positions.
Monday ice update - #Arctic sea ice extent is currently the 5th lowest on record (JAXA data)
• about 310,000 km² below the 2010s mean
• about 1,160,000 km² below the 2000s mean
• about 1,990,000 km² below the 1990s mean
• about 2,740,000 km² below the 1980s mean
More: zacklabe.com/arctic-sea-i...
04.08.2025 13:12 — 👍 53 🔁 20 💬 0 📌 3
We are the European Environmental Bureau's division working for a circular economy, clean industry, renewable energy and climate action in the EU and beyond.
Mothership: @eeb.org
Senior Researcher, Danish Meteorological Institute
Coordinator of PolarPortal (lots of up-to-date Arctic data) and ROPEWALK (huge Danish logbook digitization project)
Conveying science to the public.
Born @317 ppm.
Mastodon @MartinStendel@fediscience.org
Researching and reporting the science and impacts of climate change 🌎
climatecentral.org
PhD Climate Scientist. Alaska. The Earth is warming because of us. Mooseologist. All opinions are my own. Signal: Climatologist.49
The #CopernicusClimate Change Service (#C3S) & #CopernicusAtmosphere Monitoring Service (CAMS), implemented by @ecmwf.int on behalf of the @ec.europa.eu.
Cryptocurrency that is mined by processor ONLY. We are growing #XNV + #NERVA meme coin.
https://coinsforcry.com
https://www.facebook.com/groups/nervaxnv
- - - - - - - - - - -
The goal of this project is to find and preserve Zamrock music.
Here you will find station news such as;
* General Announcements
* Updates to Playlists
* Radio Stats
- - - - - - - - - - -
ᘔᗩᗰᘔᗩᗰ ᖴOᖇ ᒪIᖴE... 🔗 https://zamrock.net
I know nothing. Never did. Might someday.
I swear like a sailor on leave sometimes.
All Enemies, Foreign and Domestic.
I post Memes.
My Venmo.
Coffee is good.
https://venmo.com/code?user_id=4199360837453716083&created=1734665894
Climate policy, society, and the built environment. Architect, LEED AP BD+C. https://landartgenerator.org
Climate Scientist at @climatecentral.org | PhD | Passionate about improving science communication through data-driven stories | Harrisburg, PA | https://zacklabe.com/
Views, thoughts, and opinions expressed here are only my own.
Our 24/7 live giveaway twitch stream: www.twitch.tv/btipzbean
Our website: https://btipz.bot.tips/
Our discord: https://join.btipz.com/
Our token: https://bscscan.com/token/0x939255bf261bb42fe6490db9d95b97b2265653da
TipBot: https://top.gg/bot/4748413499681
official Bluesky account (check username👆)
Bugs, feature requests, feedback: support@bsky.app