A map of Europe titled “High-speed rail plan” showing future high-speed train connections and travel times. Green lines represent future new connections, and magenta lines represent future train travel times. Major cities are marked with circles and connected by these lines. Examples of travel times include: Lisbon–Madrid (3h), Paris–Brussels (1h15), Paris–Rome (6h), Berlin–Warsaw (4h15), Berlin–Prague (2h30), Berlin–Vienna (4h30), Berlin–Budapest (6h15), Berlin–Stockholm (4h), Riga–Tallinn (1h45), Vilnius–Riga (2h), Sofia–Athens (6h). The map includes the EC logo in the bottom right corner.
We’re launching a bold plan to make high-speed rail the fastest, more sustainable way to travel across Europe by 2040.
It’s a concrete timeline to remove bottlenecks, unlock investment, and harmonise rail systems ⬇️
05.11.2025 10:28 — 👍 506 🔁 115 💬 33 📌 57
Eine ukrainische Bekannte hat vor Kurzem ihren Cousin verloren. Er kämpfte an der Front im Osten.
Weil der Ort, wo er fiel, nun praktisch unter russischer Kontrolle ist, hat ihn ein ferngesteuertes Gerät der ukrainischen Armee eingesammelt.
Europa 2025: Roboter, die Leichen einsammeln.
03.10.2025 19:36 — 👍 97 🔁 26 💬 3 📌 0

fjum – forum journalismus und medien
fjum unterstützt Journalismus und Medien in Zeiten des digitalen und strukturellen Umbruchs durch Bildung, Innovation und internationale Vernetzung.
Liebe Freunde in Medien in Österreich 🇦🇹
Es geht in die heiße Phase: Diese Woche kann man sich noch für die FJUM AI Media Academy bewerben! Das Programm ist eine Erforschung von Journalismus im KI-Zeitalter, ein aktives Mitgestalten der Zukunft - und ein riesiger Spaß.
Bewerben Sie sich!
01.10.2025 03:56 — 👍 4 🔁 2 💬 0 📌 0
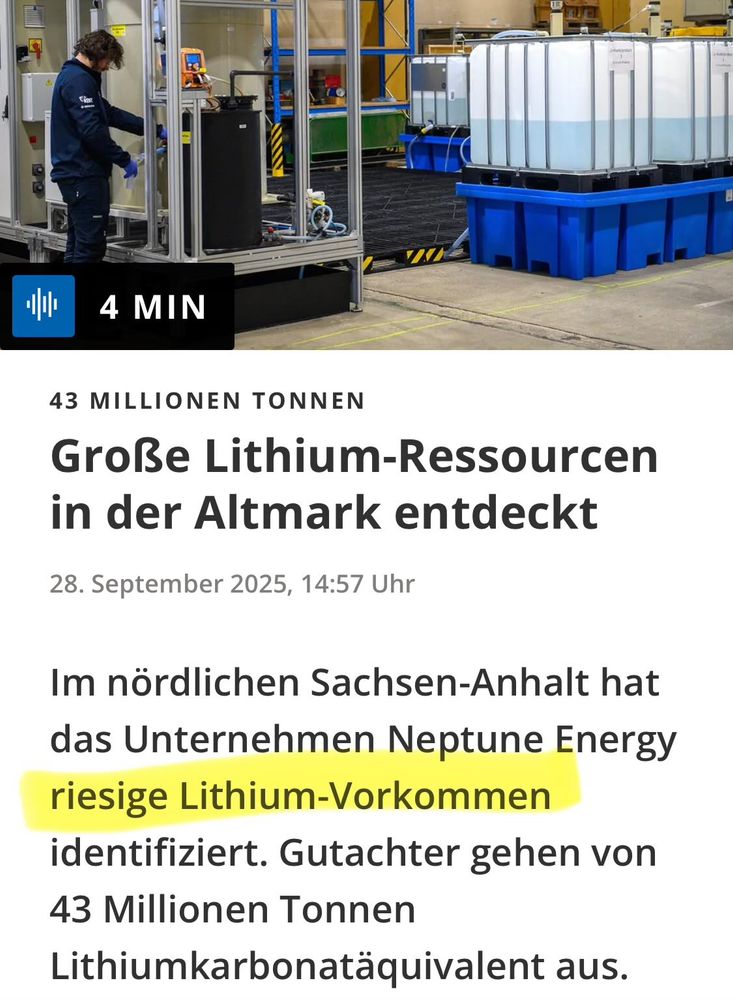
In Sachsen-Anhalt wurden „riesige“ #Lithium-Ressourcen entdeckt. Der Rohstoff ist wichtig für die Produktion von Batterien, er hat damit strategisch hohe Bedeutung.
Vielleicht werden die Deutschen so ja doch noch Freunde der Elektromobilität. 😉
www.mdr.de/nachrichten/...
28.09.2025 17:43 — 👍 51 🔁 11 💬 6 📌 4
Today's violation of Estonia's airspace by Russian military aircraft is an extremely dangerous provocation.
This marks the third such violation of EU airspace in days and further escalates tensions in the region.
The EU stands in full solidarity with Estonia (1/2)
19.09.2025 14:53 — 👍 3185 🔁 990 💬 191 📌 74

A visual featuring a blue background with a yellow stripe in the lower left corner, resembling the Ukrainian flag, and the text "New package of EU sanctions on Russia" in white and yellow. The hashtags "#StandWithUkraine" and the EU flag are also visible in the corners.
Over the past month, Russia has escalated its aggression, striking civilian and EU sites in Ukraine and violating EU airspace.
It’s time to give peace a real chance.
In response, we are increasing pressure with our 19th package of sanctions ↓
link.europa.eu/WYYwh3
#StandWithUkraine
19.09.2025 15:51 — 👍 136 🔁 47 💬 10 📌 6

A median of 61% across the 35 countries surveyed say it is very important that the media are able to report the news without state or government censorship in their country. A median of 23% say this is somewhat important; 11% say it’s not too or not at all important.
Majorities of adults in Canada (77%) and the U.S. (67%) believe having freedom of the press is very important in their country.
In Europe, the shares saying freedom of the press is very important range from 56% in Poland to 89% in Greece. Majorities across all countries in the region hold this view.
In the Asia-Pacific region, varying shares say it’s very important that the media can report the news without censorship. About four-in-ten hold this view in Bangladesh, India and Singapore, compared with about six-in-ten in Australia. Shares in other Asia-Pacific countries fall in between.
Is it important that the media can report the news without government censorship?
In the United States, 92% say it is important.
www.pewresearch.org/global/2025/...
18.09.2025 00:53 — 👍 486 🔁 203 💬 23 📌 18

Asking only once
A simple but radical rule to transform government
Man müsste viele Systeme eigentlich komplett von null weg neu aufbauen: joshuagans.substack.com/p/asking-onl...
13.09.2025 18:46 — 👍 5 🔁 1 💬 0 📌 0
Zu viel negative Nachrichten gleichzeitig: Wie damit umgehen?
Am 24.9. sprech ich darüber in der Wiener Kulisse - freu mich über alle, die an diesem Abend wieder dabei sind!
👉 Hier gibt’s Tickets: www.kulisse.at/programm/?e=...
10.09.2025 17:32 — 👍 170 🔁 43 💬 2 📌 2
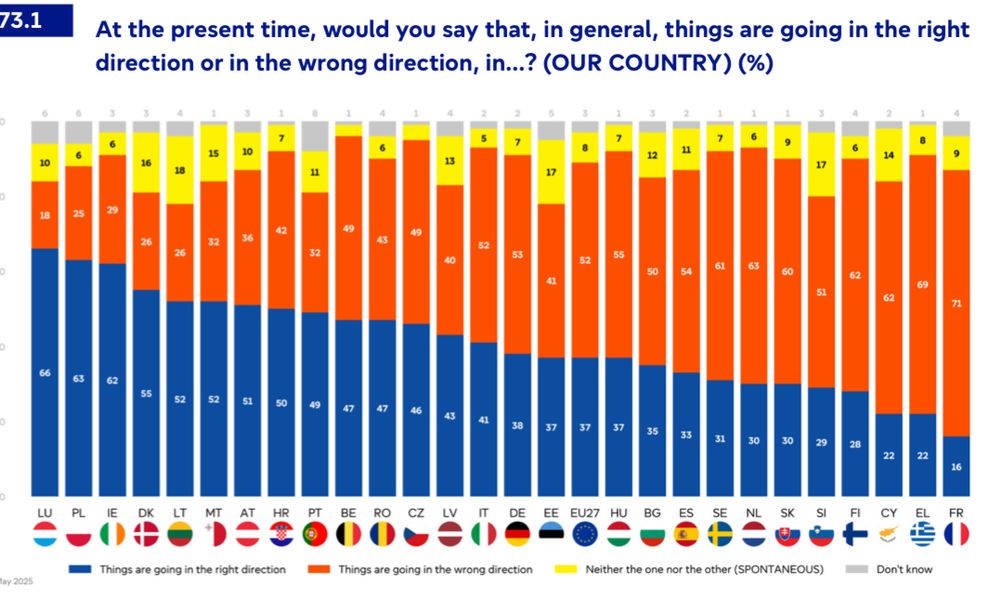
Dass es in Frankreich schon seit einer Weile gesellschaftlich brodelt, lässt sich besonders deutlich an der Eurobarometer Umfrage aus dem Frühjahr 2025 ablesen. Nur 16% sahen das Land auf dem richtigen Weg. Mit Abstand der schwächste Wert in der gesamten EU…
08.09.2025 19:31 — 👍 1 🔁 0 💬 1 📌 0


Ich hab ein neues Plakat gemacht, mit dem ich die Entwicklung des politischen Systems zwischen 1918 und 1934 nachzeichne.
moritz-moser.myshopify.com/products/die...
04.09.2025 15:19 — 👍 20 🔁 5 💬 2 📌 0

Bei NATO-Betritt: Dmitri Medwedew droht Österreich mit Militärgewalt
Dmitri Medwedew droht Österreich bei einem NATO-Betritt mit Militärgewalt. Er betont das Risiko einer Verletzung internationaler Verträge.
Medwedew baut anscheinend auf die schlechte außenpolitische und staatsrechtliche Bildung in der Bevölkerung. Es gibt keinen einzigen internationalen Vertrag, der Österreich zur Neutralität verpflichtet. Keinen. Auch der Staatsvertrag von 1955 nicht.
www.kleinezeitung.at/politik/auss...
30.08.2025 00:28 — 👍 107 🔁 38 💬 9 📌 3

Screenshot via orf.at - Daniel Huppmann im ZIB2-Interview, im Hintergrund die Stadt Salzburg bei Nacht. Text "Klimaziele - Es liegt jetzt an der Politik
Es liegt an der Politik, mit dem #Klimagesetz die Rahmenbedingungen für die Transformation zur #Klimaneutralität zu setzen. Und der Zweite Österreichische 🇦🇹 Sachstandsbericht zum Klimawandel #AAR2 zeigt die Handlungsoptionen und Vorteile für Wohlstand & Lebensqualität.
#ZIB2
🎥 orf.at/av/video/onD...
30.08.2025 07:11 — 👍 70 🔁 26 💬 3 📌 2

Ort: Otto-Mauer-Zentrum: Währinger Str. 2-4, 1090 Wien
Ausstellung ab 13:00, Diskussion ab 18:00
13.08.2025 18:02 — 👍 10 🔁 5 💬 1 📌 0

Save the date! Erstpräsentation meines neuen Buchs "Migrationspanik" am 25.9. ab 18:30 Uhr im Wien Museum, moderiert von @mattibunzl.bsky.social
08.08.2025 09:23 — 👍 35 🔁 14 💬 0 📌 0
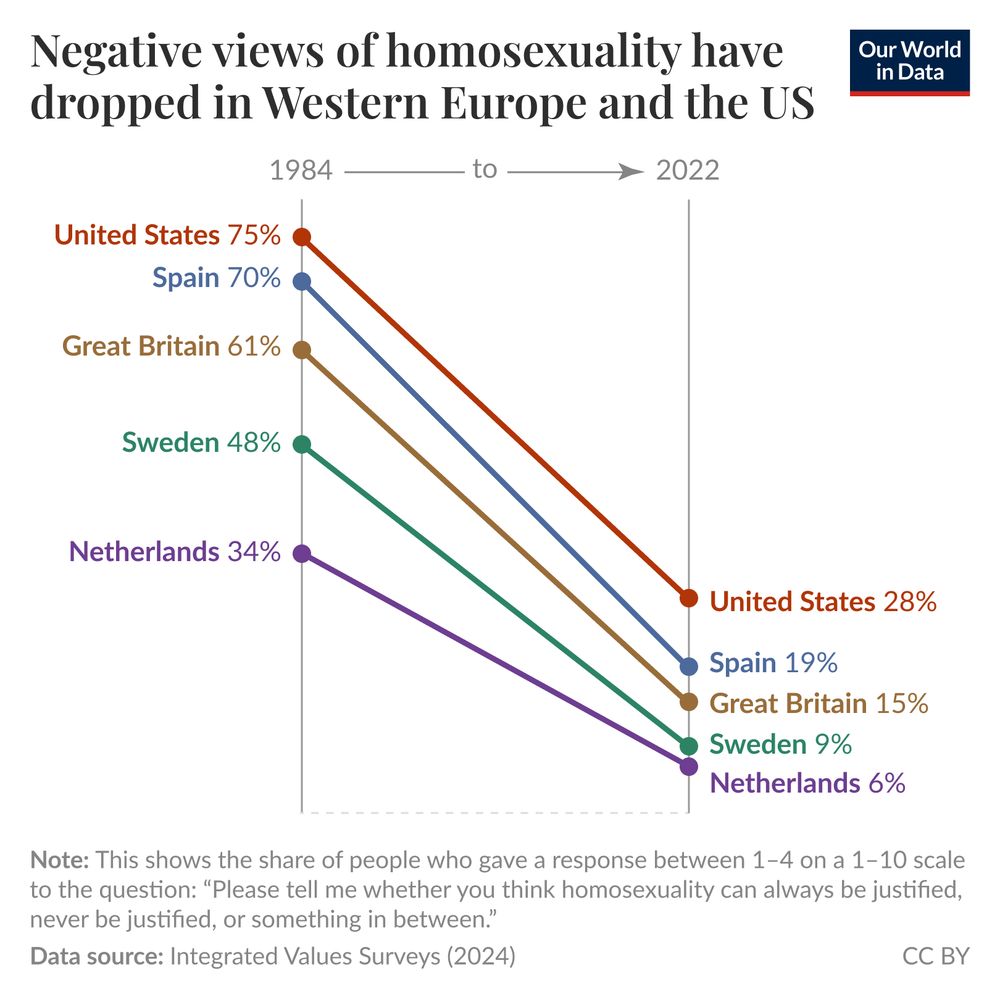
A graph illustrating the decline in negative views of homosexuality across several wealthy countries from 1984 to 2022. The title states that “Negative views of homosexuality have dropped in Western Europe and the US”
The countries are the United States, Spain, Great Britain, Sweden, and the Netherlands. Each line shows the percentage of respondents in each country who believe that homosexuality is rarely or never justifiable, represented by scores of 1 to 4 on a scale from 1 to 10.
In 1984, the United States had the highest percentage at 75%, followed by Spain at 70%, Great Britain at 61%, Sweden at 48%, and the Netherlands at 34%. By 2022, the percentages had decreased significantly: the United States to 28%, Spain to 19%, Great Britain to 15%, Sweden to 9%, and the Netherlands to 6%.
The data source is listed as Integrated Values Surveys (2024). The chart is CC BY Our World in Data.
Homophobic attitudes have fallen in Western Europe and the United States
06.08.2025 15:10 — 👍 144 🔁 48 💬 7 📌 15
Sagen wir es so: wenn man im ORF dieselben Bilder der verbrecherischen russischen Angriffe auf die ukrainische Zivilbevölkerung zeigte, und zwar täglich, wie das in den polnischen Abendnachrichten der Fall ist, sähe die Haltung der Österreicher hinsichtlich dieses Krieges vielleicht anders aus.
31.07.2025 17:36 — 👍 157 🔁 32 💬 5 📌 0
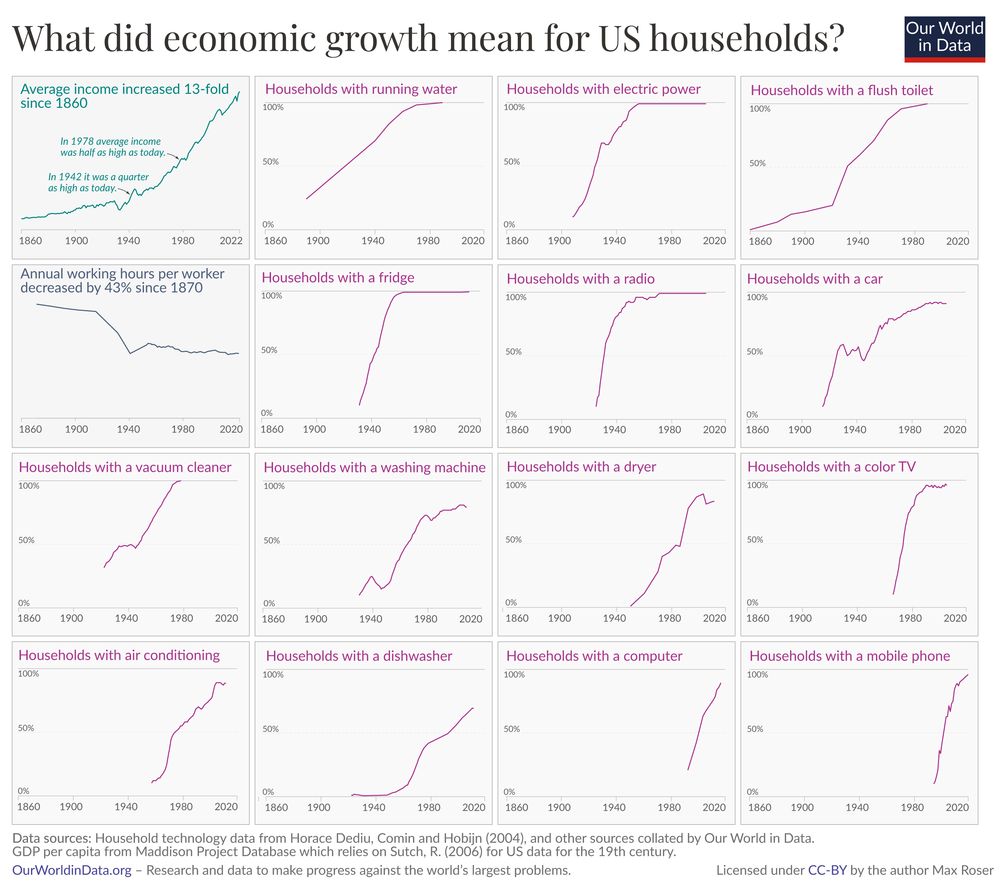
A grid of line graphs displaying the increase in household access to various amenities in the United States from 1860 to 2020. The title at the top states, "What did economic growth mean for US households?"
In the top left panel, the data on average income, here measured by GDP per capita, tells us that the average American was 13 times poorer in 1860.
The purple lines represent a very straightforward approach to measuring growth: each line tracks the share of households that have access to one specific good or service: from basic infrastructure like running water and flush toilets; to communication technology such as radio, TV, and mobile phones; to vacuum cleaners, washing machines, dryers, and dishwashers.
Footnotes at the bottom provide data sources, including research by Horace Dediu, Comin, Hobijn, and GDP data from the Maddison Project Database. Chart CC BY Our World in Data.
Two ways of measuring 160 years of economic growth in the United States
28.07.2025 11:13 — 👍 33 🔁 8 💬 4 📌 0
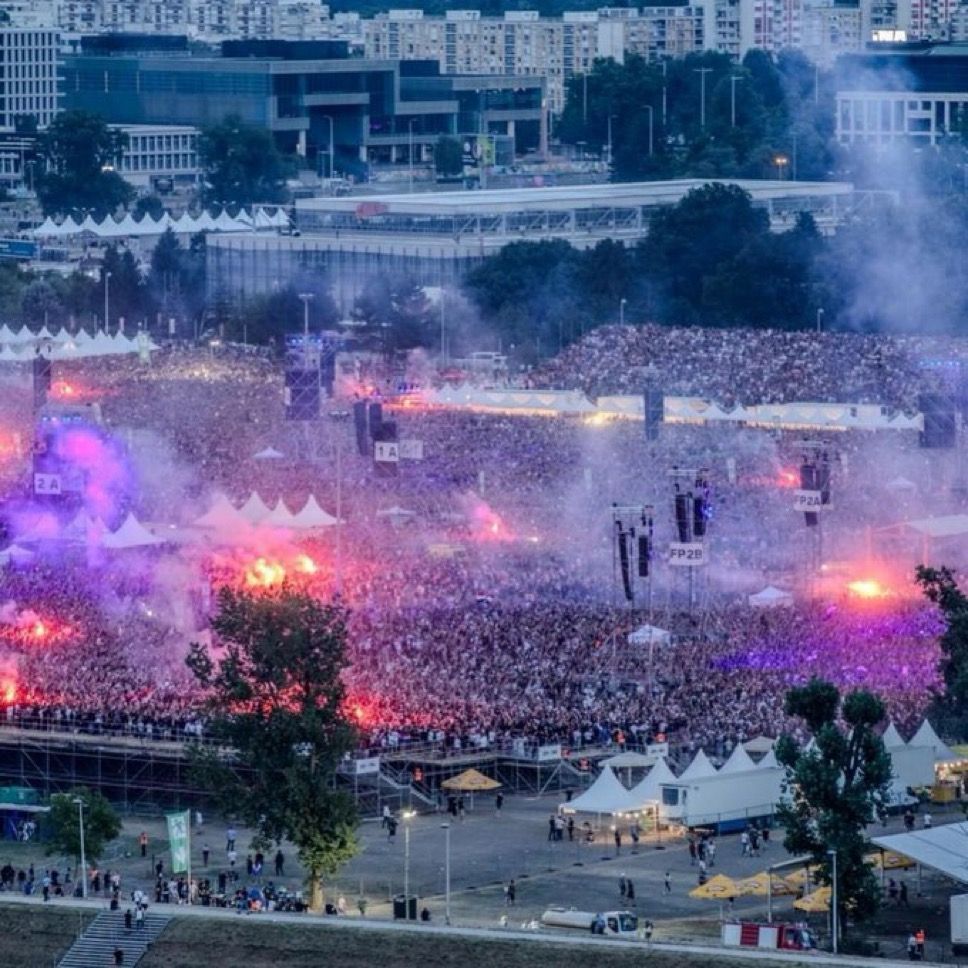
Gestriges Konzert des rechtsextremen Sängers #Tompson in Zagreb besuchten 504.000 Menschen. Er rief Menschen „Za dom“, es schallte ihm „spremni“ entgegen. (Für Heimat bereit) Mit diesem faschistischen Ustasa-Spruch & dem Gesamtkolorit wird das Konzert zu einem Schandfleck des modernen #Kroatien.
06.07.2025 17:23 — 👍 412 🔁 113 💬 10 📌 13
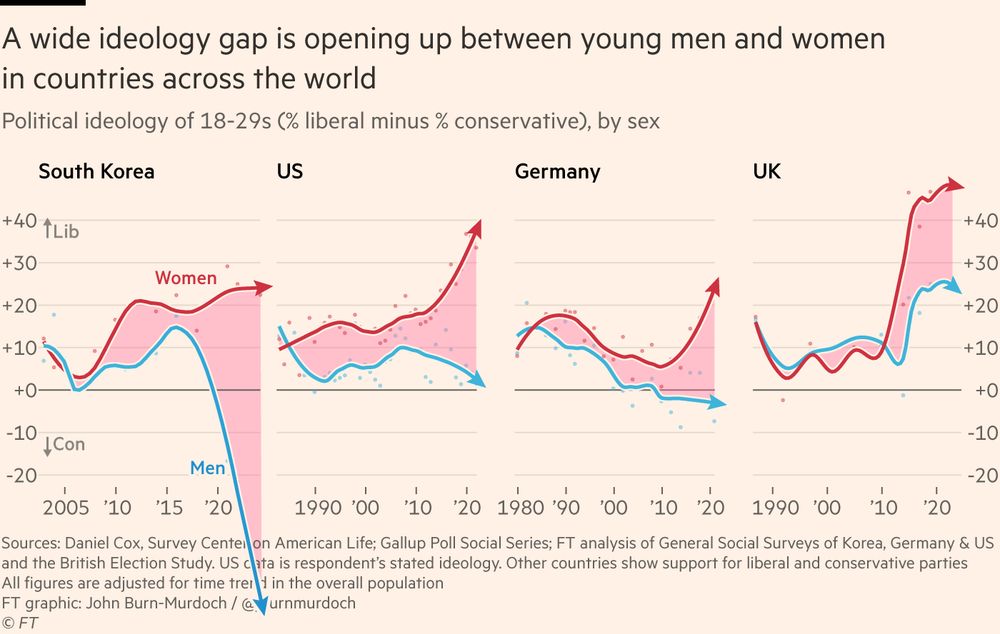
South Korea gender divide update 😲
Young men lean right by 50 points
(74% conservative vs 24% centre-left)
Young women lean left by 22 points
(58% centre-left vs 36% cons)
04.06.2025 10:01 — 👍 1125 🔁 372 💬 51 📌 182
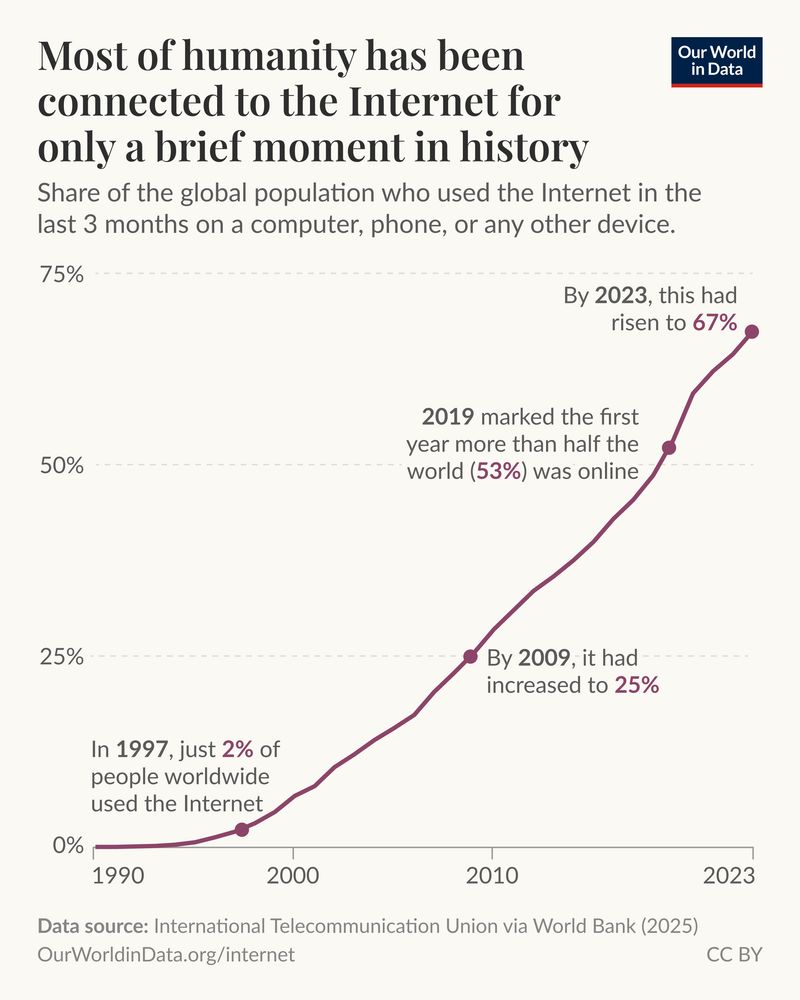
A line chart titled "Most of humanity has been connected to the Internet for only a brief moment in history" displays the percentage of the global population that used the Internet in the last three months. The vertical axis ranges from 0% to 75%, with key data points indicated.
In 1997, only 2% of the world’s population used the Internet. By 2009, one in four people used the Internet. The year 2019 is highlighted as the first year that half of the global population (53%) was online, and by the most recent data in 2023, the percentage of Internet users rose to 67%.
Data source is credited to the International Telecommunication Union, referenced via the World Bank, with a Creative Commons Attribution license.
Internet use became the norm for humanity only very recently
25.04.2025 10:41 — 👍 72 🔁 21 💬 5 📌 16
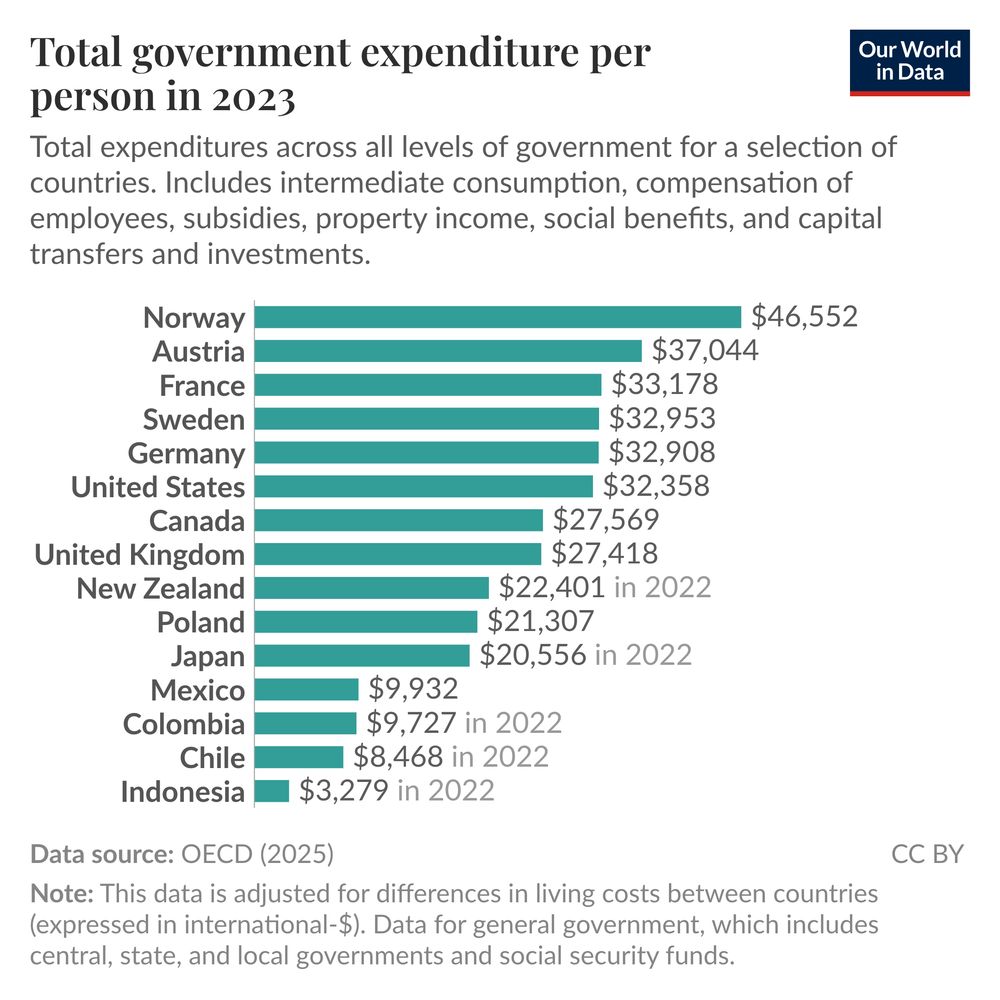
A bar chart showing the total government expenditure — across all levels of government — for a selection of countries in 2023. At the top, Norway spent over $46,000 per person; the US spent about $32,000 per person; and Indonesia spent just over $3,000 per person. The data is adjusted for cost of living differences between countries. It comes from the OECD Government at a Glance dataset (2025 edition).
What do governments spend their financial resources on?
📊 We recently updated the data we show from the OECD Government at a Glance dataset to the 2025 edition!
@parriagadap.bsky.social, data scientist on our team, led this update for us.
15.04.2025 11:52 — 👍 51 🔁 11 💬 2 📌 4
For my international followers: The Russian disinformation campaign organized by a cell in Austria, uncovered by the Austrian intelligence service DSN, is a big deal for several reasons.Firstly, it highlights that influence campaigns—not just espionage—are a serious threat.🧵
24.03.2025 13:53 — 👍 315 🔁 171 💬 3 📌 11
Toi toi toi! Hoffe, es wird nicht allzu mühsam.
05.03.2025 08:54 — 👍 2 🔁 0 💬 1 📌 0
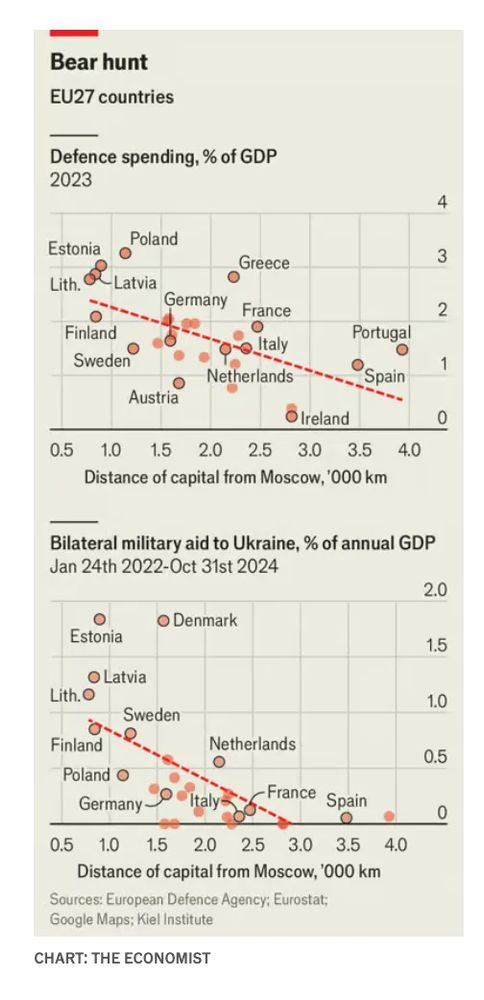
Increasingly the distance to Moscow defines defense and security policy. Subscribe for more from Chartbook: tinyurl.com/mpeffaxe.
27.02.2025 20:45 — 👍 22 🔁 6 💬 1 📌 1
Mayor-Elect of New York City
Historian - Refugee Studies | Cold War | History of Austria | International organizations https://linktr.ee/SarahMKnoll
🇦🇹 Bundesminister für Finanzen
Impressum: https://www.bmf.gv.at/public/impressum.html
Geschäftsführerin @ Umweltbundesamt.
Für Umwelt, Wissenschaft & klare Worte.
Transformation ist Teamsport.
Berater und Publizist zu Medien und Politik
Für Wirtschaftswende und Kreislaufwirtschaft bringen wir alle an einen Tisch.
#GemeinsamSchnellerUmsetzen climatelab.at
Spittelauerlände 45 1090 Wien
Part of Impact Hub Vienna
News and information from the European Commission. Social media and data protection policy: http://europa.eu/!MnfFmT
🇦🇹⚖️🇪🇺
Bundesministerin für Justiz
Copyright: BKA / Wenzel
Impressum: https://www.bmj.gv.at/uebersicht_startseite/veroeffentlichungsangaben/impressum.html
Außenminister der Bundesrepublik Deutschland | Foreign Minister of the Federal Republic of Germany
www.foresight.at
FORESIGHT GmbH – Forecasts | Research | Insights für gute Entscheidungen. Wahlen. Demokratie. Wohnen. Arbeit. Stadtforschung. KI. Inhouse-Trainings.
Interim President and Rector, Central European University (CEU) |
Political Science prof, political regimes, methods (QCA) | here in private and as ex-vintner 🍷
We are CEU.
Fostering global interdisciplinary education and critical thinking in Vienna 🎓
https://www.ceu.edu/
Beratung und Unterstützung für von Antisemitismus Betroffene & Dokumentation antisemitischer Vorfälle.
Meldungen online & ☎️ 01 / 531 04–777
https://www.antisemitismus-meldestelle.at
Journalismus mit Tiefgang, von Mitgliedern finanziert.
Werde JETZT Mitglied auf jetzt.at
JETZT gemeinsam.
https://foreignpolicylab.at/ | @uniinnsbruck.bsky.social
A hub for innovative ideas on foreign policy and world politics that seeks to promote research, education, and public debate.
Proudly serving the people of New Jersey in the U.S. Senate.
Historian, professor, author "The Ukrainian Night: An Intimate History of Revolution;" "The Taste of Ashes: The Afterlife of Totalitarianism;" "Caviar and Ashes."