Introduction to building (better) R packages www.youtube.com/watch?v=Y8Kr... (R/Pharma 2025 #Rstats)
13.02.2026 21:01 — 👍 22 🔁 10 💬 0 📌 0
@chrischizinski.bsky.social
Associate professor of human dimensions in the School of Natural Resources at the University of Nebraska #rstats enthusiast
Introduction to building (better) R packages www.youtube.com/watch?v=Y8Kr... (R/Pharma 2025 #Rstats)
13.02.2026 21:01 — 👍 22 🔁 10 💬 0 📌 0
NSF's graduate research fellowship (GRF) program is designed to teach aspiring scientists how to write a winning grant proposal. So why are so many applicants being denied that learning experience? www.science.org/content/arti...
12.02.2026 18:31 — 👍 43 🔁 32 💬 2 📌 2Exploring Complex Survey Data Analysis Using R by Stephanie A. Zimmer, Rebecca J. Powell and Isabella C. Velásquez
#RStats
https://bigbookofr.com/chapters/social%20science.html#exploring-complex-survey-data-analysis-using-r
![library(tidyverse)
citekeys <- read_file("manuscript.qmd") |>
str_extract_all("@([A-Za-z0-9_:]+)") |>
unlist() |>
str_remove_all("^@") |>
as_tibble() |>
count(value) |>
arrange(desc(n))](https://cdn.bsky.app/img/feed_thumbnail/plain/did:plc:2zcfjzyocp6kapg6jc4eacok/bafkreicrjengdhqprxl6xqxq4syugggpvcabskfek2lxackxnguywvfnze@jpeg)
library(tidyverse) citekeys <- read_file("manuscript.qmd") |> str_extract_all("@([A-Za-z0-9_:]+)") |> unlist() |> str_remove_all("^@") |> as_tibble() |> count(value) |> arrange(desc(n))
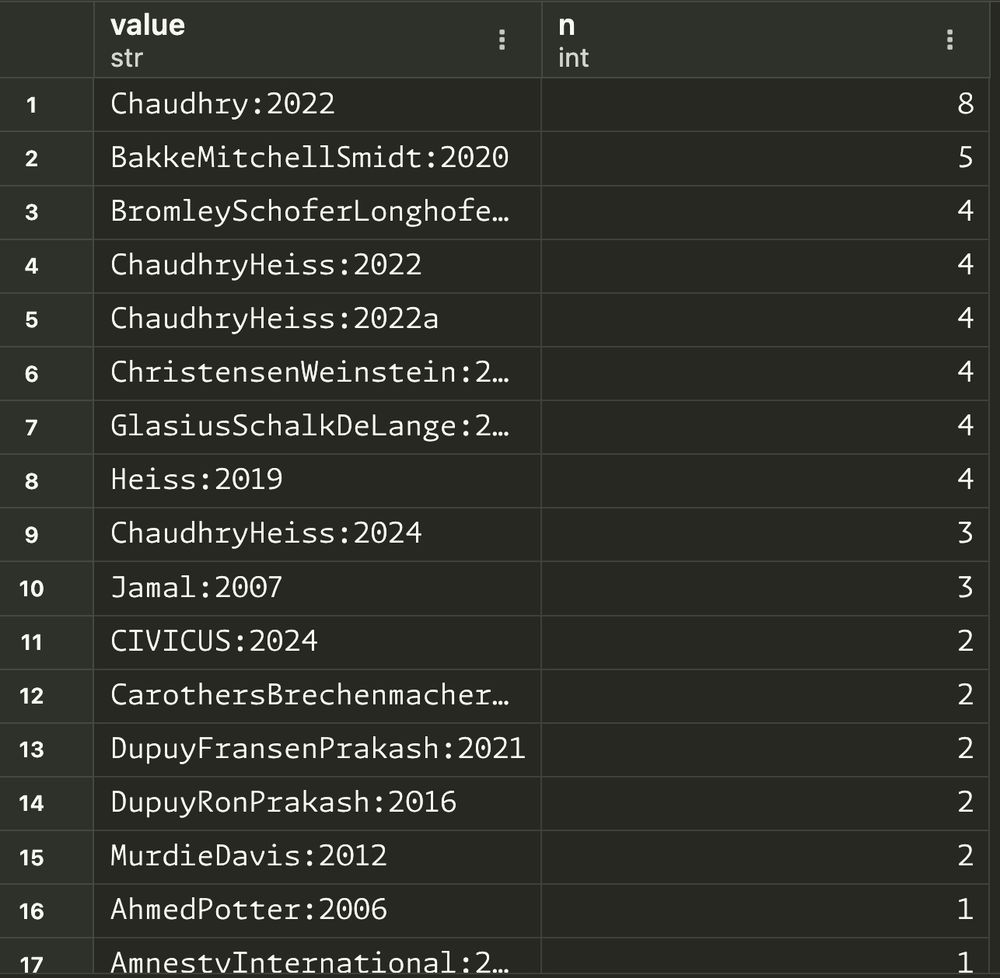
Screenshot of a table with columns for citation key and counts
Helpful trick for academic writing with #QuartoPub: sometimes when trimming down papers, you've got to remove references (ugh—bibliographies shouldn't count in word counts!) so I use this #rstats snippet to extract all citations & and find things that I've only used once to see if they're droppable
28.03.2025 18:06 — 👍 66 🔁 12 💬 5 📌 1Also,
19.03.2025 16:05 — 👍 18 🔁 3 💬 1 📌 0
apnews.com/young-scient... scientists see career pathways vanish as schools adapt to federal funding cuts
17.03.2025 01:09 — 👍 1 🔁 0 💬 0 📌 0
Two years ago I wrote a 3 part blog post on Data Cleaning for Data Sharing for #LoveDataWeek that I think is still relevant for #LoveData25.
1. cghlewis.com/blog/data_cl...
2. cghlewis.com/blog/data_cl...
3. cghlewis.com/blog/data_cl...
#rstats #databs #edusky

A hex logo with 'lintr' written in light blue stitch. The angled white band behind this lettering appears to be "wiped on" by a lint roller at the right end of the hex. The rest of the hex is a Nordic knit sweater pattern in various shades of blue.
#rstats {lintr} finally got a hex logo! Thanks to @gregswinehart.bsky.social! And of course @hadley.nz for the initiative.
20.12.2024 06:26 — 👍 44 🔁 11 💬 1 📌 1
dev ops for data science
Check out the book DevOps for Data Science by Alex Gold.
Want your work to make a real impact? DO4DS is your guide to bringing you & your team's analytic insights into production. Learn more at posit.co/blog/devops-...
#rstats #datascience #devops #pydata

I was today years old when I found this gem of a web app to explore 2500+ color palettes for R:
r-graph-gallery.com/color-palett...

In case you missed it, last Friday I finally launched The Last Hunt for the Jabberwock, a D&D 5e Adventure with lesson plans and learning standards for environmental educators.
You can also just play the campaign on its own. I think it's pretty fun!
www.southernfriedscience.com/hunt-the-jab...
📝 "Positron in action with #TidyTuesday orca encounters"
👤 Julia Silge
🔗 https://juliasilge.com/blog/orcas-positron/
#rladies #rstats

3D elevation map of the Iberian Peninsula🇦🇩🇪🇸🇵🇹 shows the intricate river systems overlayed with the exaggerated terrain.
My new 3D elevation map of the Iberian Peninsula🇦🇩🇪🇸🇵🇹 shows the intricate river systems overlayed with the exaggerated terrain.
Curious about how I create relief maps like this one? Dive into my video tutorial and explore the process:
🔗 youtu.be/piswxAEwnYo
#rstats #dataviz #GIS #maps #coding

TidyTuesday logo
Getting involved in open source projects is a great way to develop your programming skills! As well as creating plots or shiny apps using the #TidyTuesday data, curating a dataset is a good way to contribute!
How to contribute 👇👇👇
#DLSC #RStats #Python #DataScience @dslc.io


~~ new blog post ~~
i wrote about the meme that academic code is bad, what i think is achievable, and why i don't think we should be trying to get academics to write software for production
would love to hear what folks think!
#rstats #pydata
www.alexpghayes.com/post/what-i-...

Screenshot of slides showing the title "More effective data visualisations for improving communication with decision makers"
I really enjoyed talking about the @royalstatsoc.bsky.social's "Best Practices for Data Visualisation" guidance, for the Centre for Marketing Analytics and Forecasting talk this afternoon 📊
Thanks to @kandrika.bsky.social for the invitation and for chairing the session!
#RStats #DataViz
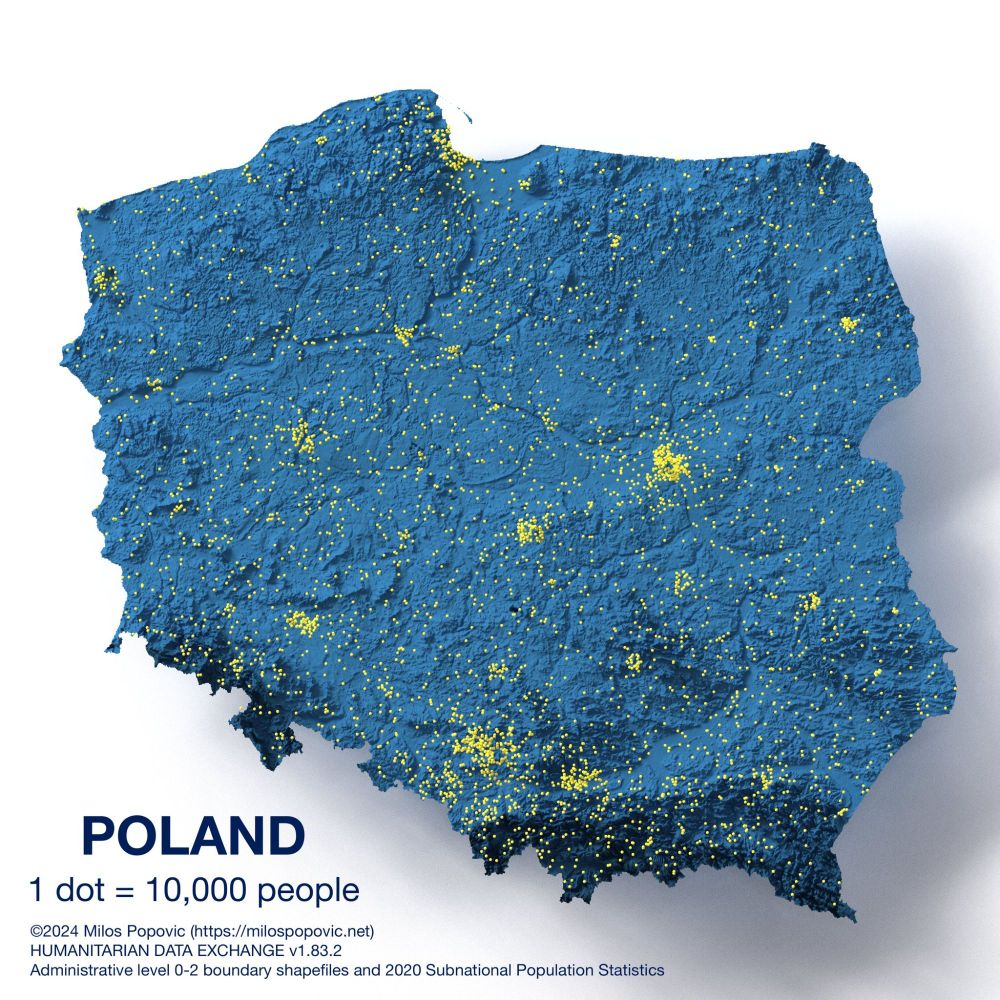
Check out my dot-density map of Poland's🇵🇱 population by powiat (admin level 2).
1 dot = 10,000 people, randomly placed within their powiat.
Can you spot the most populated regions? 🧐
Learn to create maps like this with my YouTube tutorial!
youtu.be/aUA1Sb6IBVQ
#maps #dataviz #rstats #Poland

Using Generalized Additive Models in #rstats but unsure how to interpret them? The {marginaleffects} 📦 by @vincentab.bsky.social is your friend ecogambler.netlify.app/blog/interpr...
16.11.2024 18:52 — 👍 58 🔁 24 💬 4 📌 0The {messy} R package now has a pkgdown site with documentation: nrennie.rbind.io/messy/
#RStats #StatsEd