Looks great - though the dark green on light grey used for the roxygen2-style comments is really hard to read, which is a shame as that stuff is really vital to plumber2!
06.10.2025 12:05 — 👍 1 🔁 0 💬 1 📌 0
@jack-davison.bsky.social
👋 senior consultant, environmental data analyst, #rstats developer 🔗 personal website: https://jack-davison.github.io/
Looks great - though the dark green on light grey used for the roxygen2-style comments is really hard to read, which is a shame as that stuff is really vital to plumber2!
06.10.2025 12:05 — 👍 1 🔁 0 💬 1 📌 0#rstats #quarto - has anyone written anything on how Quarto meets (or fails to meet) modern web accessibility standards? Had a query from our digital team. I imagine some of it would be up to the user - e.g., add alt text - so my second question is there a guide "writing an accessible quarto doc?"
07.03.2025 11:40 — 👍 0 🔁 0 💬 0 📌 0
#rstats #dplyr wizards - I come cap in hand in a time of need - github.com/tidyverse/dp... - something that seems like it should be quite simple but I can't work out how to achieve!
01.03.2025 08:50 — 👍 3 🔁 1 💬 1 📌 0Parallelisation built-in to #rstats #purrr 📦 is a total gamechanger. I've had a play this morning and it seems to "just work" effortlessly. When this lands on CRAN we'll be able to simplify so many of our packages/workflows!
07.02.2025 09:13 — 👍 10 🔁 2 💬 0 📌 0Aha! Seemed to be an issue using "cairo" graphics devices - switching to {ragg} has sorted it
20.12.2024 17:56 — 👍 1 🔁 0 💬 0 📌 0
Clever #rstats #testthat people - I'm trying to write unit tests to run on GitHub Actions but seemingly any that create a plot (e.g., ggplot2) fail on MacOS, and only MacOS. Can anyone who knows more about this than me advise what could be going on? (github.com/davidcarslaw...)
Thanks Allison! 😀
25.11.2024 16:15 — 👍 0 🔁 0 💬 0 📌 0Honestly, I'd never used JS / Observable before, so I just worked through the docs at observablehq.com/framework/ til I got something that looked half decent, with a lot of googling! @allisonhorst.bsky.social also has a nice getting started video series: www.youtube.com/watch?v=N2qi...
25.11.2024 10:21 — 👍 2 🔁 0 💬 1 📌 0This was a wonderful thread to realise GIFs don't work on Bluesky 🤦 the thread looks a bit more impressive when the images move around!
24.11.2024 21:57 — 👍 0 🔁 0 💬 0 📌 0I'm enjoying #observableframework for lots of reasons - I can still use #rstats to do the data loading, and create dashboards that would normally need a #shiny server but are instead totally serverless! It is also lightning quick to react to user inputs ⚡
24.11.2024 21:56 — 👍 1 🔁 0 💬 1 📌 0
Finally (for now!) number three is 2024/46 (iso codes). This was a quick one - just uses #ObservablePlot tree mark to create a flowchart of the three-letter iso codes. I think I'm now one week behind, so will hopefully turn my attention to 2024/47 (Bob's Burgers!) next!
24.11.2024 21:56 — 👍 0 🔁 0 💬 1 📌 0
Number two is 2024/45 (democracy & dictatorship) - change the slider to see countries adopt (or abandon) democracy. This required using #leaflet in JavaScript, which I'd never done before (although I have experience with the #rstats wrapper). Also a lot of nested data/JSONs to create & filter.
24.11.2024 21:56 — 👍 2 🔁 1 💬 1 📌 0
The first dashboard was 2024/44 (monster movies). Using #ObservablePlot and #arquero JS to filter data on the fly and compare data for different genres of monster movie. I've played around with both in #quarto before, so this was familiar territory.
24.11.2024 21:56 — 👍 1 🔁 1 💬 1 📌 0I've been trying to learn @observablehq.com #framework through #tidytuesday. I've lagged behind a few weeks, and never posted about it on Bluesky, so here's what I've done so far! The dashboards are found at jack-davison.github.io/TidyTuesdayO..., code at github.com/jack-davison... 🧵
24.11.2024 21:56 — 👍 5 🔁 0 💬 3 📌 0
A polar plot map, coloured by Pearson's r of two pollutants rather than the concentration of a single pollutant.
Just released v 0.9.1 of our #rstats 📦 {openairmaps}, which combines #openair with #leaflet for dynamic #airquality mapping. Lots of fixes, but main feature is allowing for "pairwise" stats in `polarMap()`. Read more about pairwise bivariate polar surfaces: bookdown.org/david_carsla...
19.11.2024 13:05 — 👍 2 🔁 0 💬 0 📌 0Open to contributions if anyone's keen. I'd like to implement nicer shadows or some way to make the markers pop off the tilemaps better, but can't quite crack something that looks good.
15.11.2024 10:09 — 👍 0 🔁 0 💬 0 📌 0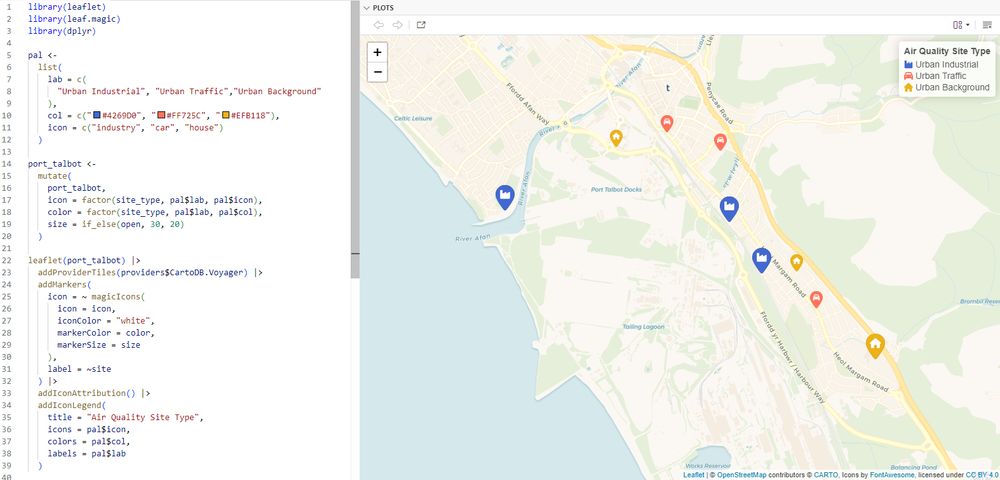
I wrote something #rstats a few months ago and never really plugged it. I love #leaflet, but awesomeMarkers is v limited - instead `leaf.magic::magicIcons` uses {magick} to construct icons on the fly. Totally customisable sizes/icons/colours/shapes. See more at: github.com/jack-davison...
15.11.2024 10:09 — 👍 3 🔁 0 💬 1 📌 0
An #introduction 👋
I'm an environmental data analyst and R package developer, with a specialism in #airquality. Interested in #rstats, #quartopub, #shiny and, increasingly, #observable and #observableframework.
You can see a lot of my stuff on GitHub: github.com/jack-davison