I'll be running a free, online workshop at @rinpharma.bsky.social on Nov 3rd!
If you've never built an #RStats package before, or if you want to learn some tips to make better packages, come along to build a package together! 📦
⏰ 10am EST / 3pm GMT
#RPharma
23.10.2025 21:14 — 👍 30 🔁 10 💬 1 📌 1

R-Ladies YouTube Video Feed
R-Ladies and its chapters share so many amazing recordings!
Interested in seeing what they are and how to watch them?
🔍 Check out the R-Ladies YouTube Video Feed
🔗 ivelasq.github.io/rladies-vide...
Made with flexdashboard + GitHub Actions!
🧑🏫 Tutorial here: ivelasq.rbind.io/blog/automat...
24.09.2025 17:08 — 👍 17 🔁 6 💬 0 📌 0
This is so useful, thanks!
20.08.2025 13:57 — 👍 1 🔁 0 💬 0 📌 0
Hello #dataBS (& especially #TidyTuesday) fam! I'm trying to organize a thing to help me keep TidyTuesday running smoothly, but first I need to get a bit of a runway. Every week I curate a TT dataset, and it's wearing me down. Please see github.com/rfordatascie... for some ways you can help! #RStats
15.08.2025 11:23 — 👍 48 🔁 36 💬 7 📌 4
YouTube video by useR! Conference
Plot Twist: Adding Interactivity to the Elegance of ggplot2 with ggiraph
Check out Tanya Shapiro and Cedric Scherer's talk from useR! virtual conf www.youtube.com/watch?v=GnDj...
13.08.2025 14:23 — 👍 1 🔁 0 💬 1 📌 0

Vincent stands in front of a slide showing the syntax of a tiny table code snippet.
Last but very definitely not least in the #useR2025 ⚡️talks: @vincentab.bsky.social showing us the power of {tinytable}!
IMHO: {gt} is king for fancy reproducible html tables, but {tinytable} should be the go-to for quick formatting and other file formats.
vincentarelbundock.github.io/tinytable/
10.08.2025 15:33 — 👍 36 🔁 7 💬 2 📌 0
The virtual useR! 2025 event is happening tomorrow (August 1). There's still time to register. Claim your spot, for free, before time runs out!
The program: user2025.r-project.org/program/virt...
Registration: user2025.r-project.org/register
#useR2025 #rstats
31.07.2025 12:05 — 👍 16 🔁 11 💬 0 📌 2
Was it flexoki? bsky.app/profile/step...
23.07.2025 13:37 — 👍 4 🔁 1 💬 1 📌 0

Graph showing % threatened vertebrate species. Dark circles show the best estimate for % threatened and the light colored bar shows the range from lower estimate to upper estimate.
Day 30 of the #30DayChartChallenge - National Geographic
IUCN Red List data on species threatened with extinction
Made using #rstats with helpful tips from Albert Rapp on using symbols in the subtitle instead of a legend
www.youtube.com/watch?v=X1gk...
albert-rapp.de/posts/ggplot...
30.04.2025 23:09 — 👍 9 🔁 2 💬 0 📌 0
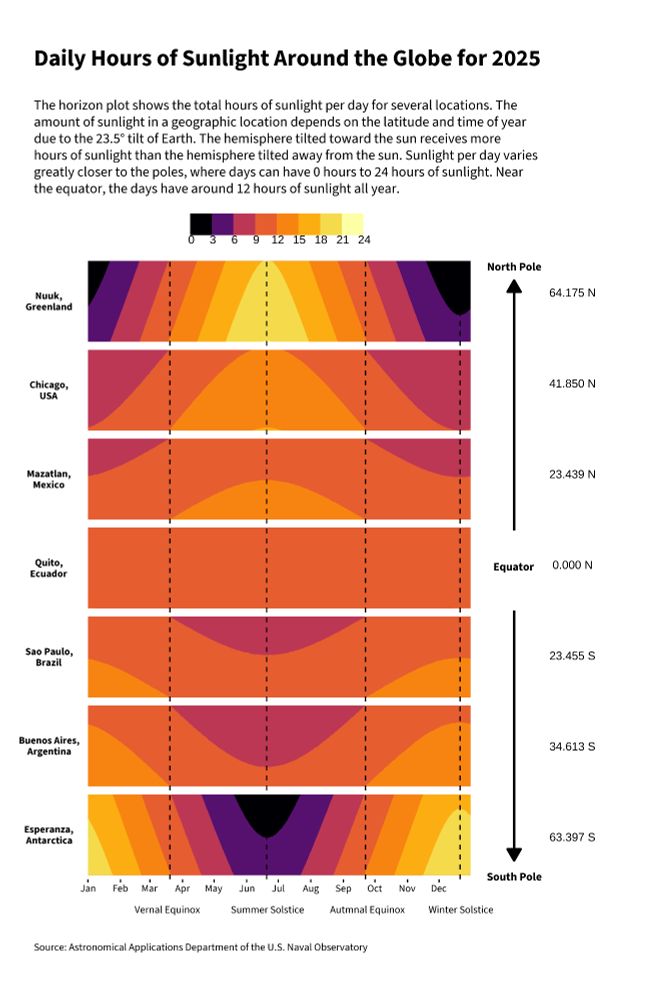
The horizon plot shows the total hours of sunlight per day for several locations. Sunlight per day varies greatly closer to the poles, where days can have 0 hours to 24 hours of sunlight. Near the equator, the days have around 12 hours of sunlight all year. The brighter areas have more daily sunlight and the darker areas have less.
Day 22 of the #30DayChartChallenge - Stars 🌟
Daily hours of sunlight ☀️ for places at different latitudes
Made with #rstats {ggHoriPlot} for the horizon plot and {cowplot} to assemble the pieces
23.04.2025 05:08 — 👍 24 🔁 3 💬 0 📌 0
Yes just one time point, which is maybe not the best choice for a stripe plot but it was the data I had.
15.04.2025 05:20 — 👍 0 🔁 0 💬 0 📌 0
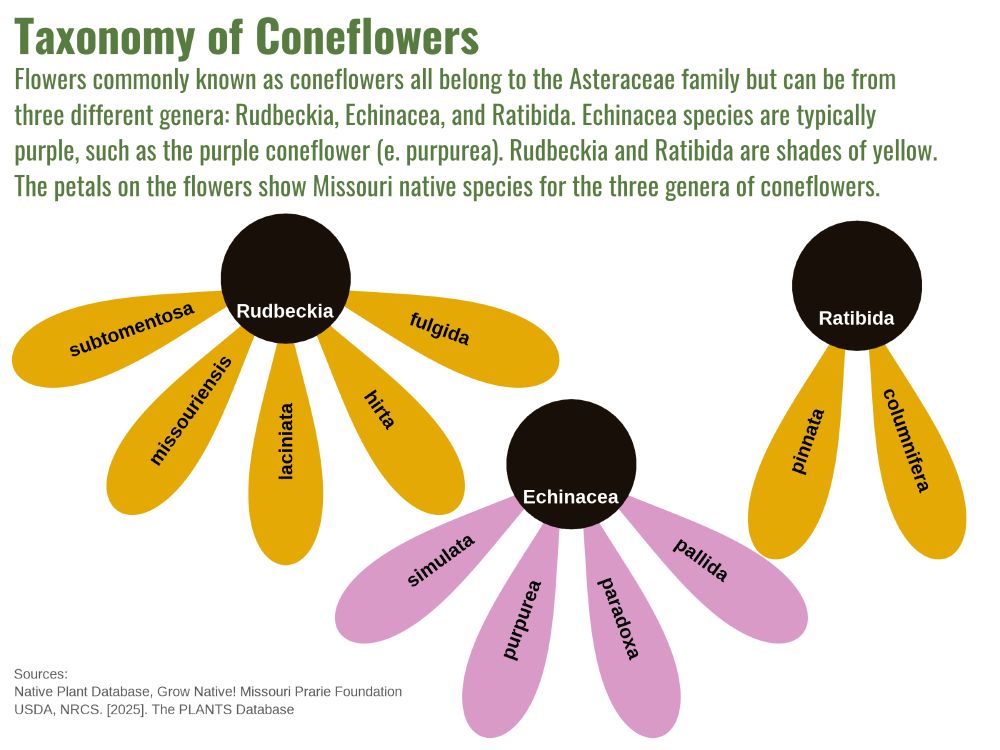
Taxonomy of Coneflower. Image has 3 flowers where each center is a genus and the petals are species.
Day 14 of the #30DayChartChallenge - Kinship
Taxonomic relationship of Missouri native coneflowers
This started out as a quick flowchart in #Rstats until I realized that playing around with coord_polar would make my chart look like an actual coneflower.
15.04.2025 05:14 — 👍 11 🔁 2 💬 0 📌 0
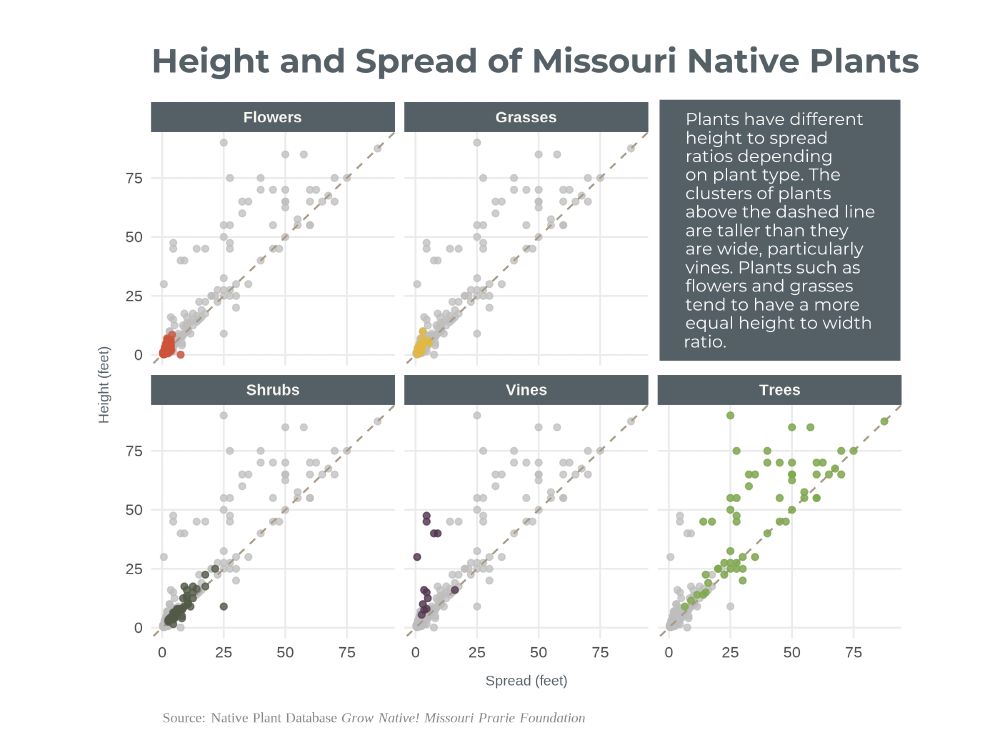
Plot showing height vs spread of Missouri native plants. The clusters of points show the different plant types (flowers, grasses, shrubs, vines, and trees).
Day 13 of the #30DayChartChallenge - Clusters
Looking at the heights vs spread of Missouri native plants 🌿
I tried out using #rstats {ggh4x} and {cowplot} packages to fill the empty facet with text.
13.04.2025 20:22 — 👍 10 🔁 3 💬 1 📌 0
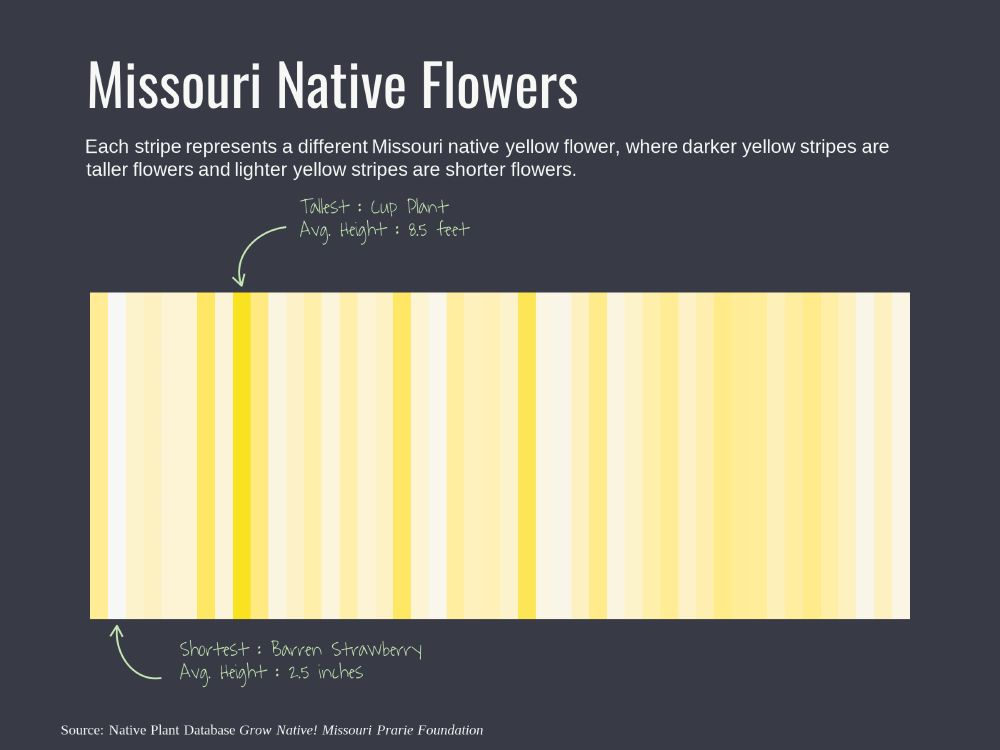
Stripe plot of heights of Missouri native flowers. Each stripe represents a different Missouri native yellow flower, where darker yellow stripes are taller flowers and lighter yellow stripes are shorter flowers.
Day 11 of the #30DayChartChallenge - Stripes
Heights of Missouri native yellow flowers
11.04.2025 14:33 — 👍 9 🔁 2 💬 1 📌 0
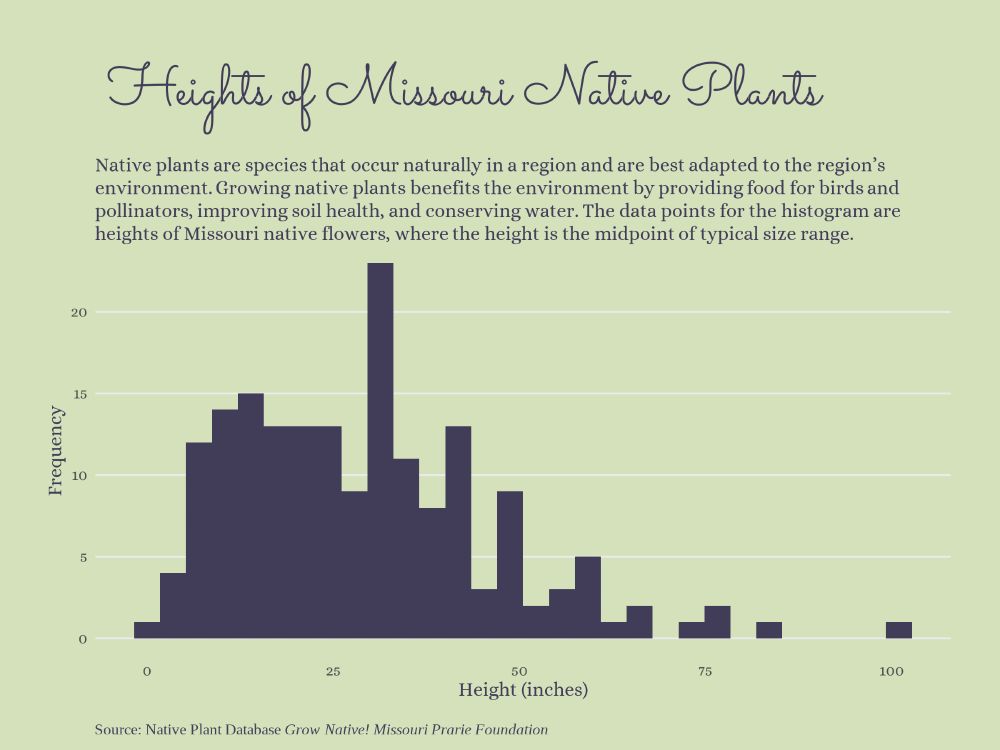
Plot: Histogram of heights of Missouri Native Plants
Day 8 of the #30DayChartChallenge - Histogram
08.04.2025 14:48 — 👍 9 🔁 1 💬 0 📌 0
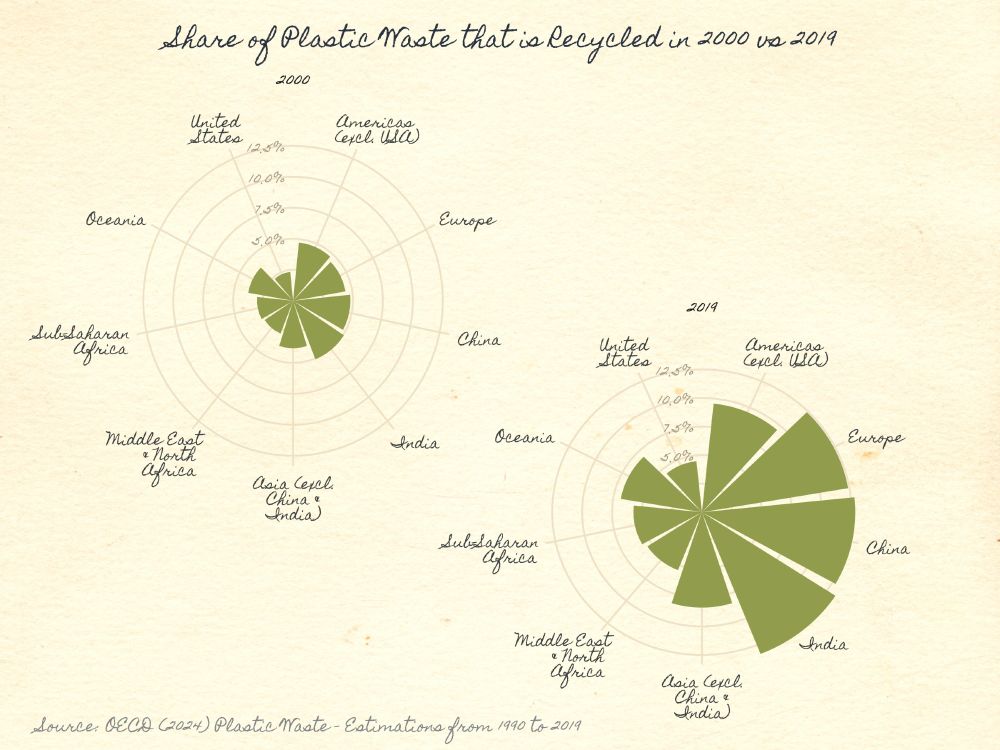
Graph: Share of Plastic Waste that is Recycled in 2000 vs 2019
Day 6 of the #30DayChartChallenge Florence Nightingale (theme day)
06.04.2025 17:58 — 👍 5 🔁 0 💬 0 📌 0
Data Visualisation Manager at a health think tank 👩💻 Mostly talk about data, #dataviz, #opendata, #maps, #python and #data4good 📈 Into cycling, yoga, sourdough, puns and more. Views my own.
Also active on Mastodon + Linkedin
The University of California system will host its annual event November 18-20, 2025. This event celebrates all things mapping and geospatial of the University of California faculty, staff, students, and alumni.
Freelance Data Visualization Specialist and Data Analyst. 📊 Book nerd📚. Always seeking new insights and knowledge💡Available for Projects.
https://deepalikank.in/
📊 Turning complex data into powerful visual stories!
Author of 'Powerful Charts'. Ex-physicist. He/him 🏳️🌈
We help organizations communicate more effectively with their data. Learn more at claritydatastudio.com.
California Beach Biogeography & Geomorphology, Geospatial Data Science, Cartography, Open Source, Library Employee, and definitely some cats.
OSGeo - FOSS4G - #gischat - #maptimeDavis
#rstats #ggblanket
https://github.com/davidhodge931/ggblanket
Biostatistician, R developer, Quarto wizard, and cinephile.
Developer Educator at Posit, spreading the word on quarto.org
Data Elixir is a weekly newsletter with curated data science picks from around the web. Subscribe at dataelixir.com and follow us here for selections between issues. Covering machine learning, data visualization, analytics, and strategy.
I love posting about #rstats and texas politics
https://linktr.ee/alejandro.hagan
Enrich your stories with charts, maps, and tables – interactive, responsive, and on brand. Questions? Write us: datawrapper.de/contact-us
A blog/newsletter of #rstats stuff by Damie Pak (@damiepak.bsky.social). Kinda like a travel blog but it's about transitioning into industry from a postdoc. I create silly things for you to enjoy. Entirely free.
Health Data Science | 📊 DataViz | 📖✨️ | 🐾
Looking for health data analytics or data science position.
LinkedIn: www.linkedin.com/in/darakhshan-nehal-b38747154/
GitHub: https://github.com/darakhshannehal
Join the UseR! at Warsaw!
We’re excited to announce that UseR! Conference in 2026 is being hosted in Warsaw, bringing together data scientists, statisticians, and researchers from across the world.
7-9 July, 2026
https://user2026.r-project.org/
Creating & writing about data vis for @datawrapper.de
Promoting diversity in the #RStats community via meetups, mentorship and global collaboration! 200+ groups worldwide.
#RLadies
|| PhD Statistics | Research Software Engineer | Loves #rstats | Outdoors person | Coffee person | Photography person | Serial Hobbiest | he/him ||
Unlocking better insight for Women's Basketball (WNBA and NCAAW) through statistics, articles, podcasts, videos, and more
Stats: https://herhoopstats.com/
Newsletter: https://herhoopstats.substack.com/
Podcast: https://bit.ly/herhoopstatspodcast