Sorry I'm a few years late to the party, but I'm here finally! :) yihui.org/en/2026/01/h... Thank you all so much for your generous support over the past two years!
26.01.2026 18:54 — 👍 88 🔁 10 💬 5 📌 1
I remember @yihui.org being the one who requested that feature, but can’t find the post
06.03.2025 14:11 — 👍 0 🔁 0 💬 1 📌 0

The reticulate hex plus the uv logo
We are delighted to announce Reticulate 1.41!
You can now simply declare your dependencies using `py_require()`, and Reticulate will handle the rest. This seamless experience is powered by uv, an extremely fast #Python package manager written in Rust.
Learn more: posit.co/blog/reticul...
#RStats
03.03.2025 15:05 — 👍 123 🔁 29 💬 0 📌 6

Air, an extremely fast R formatter
We are thrilled to announce Air, a new R formatter.
@lionelhenry.bsky.social and I are so excited to finally announce Air - an extremely fast R code formatter! 🎉
With Air, you'll never need to worry about styling your #rstats code ever again. All you need to do is save, and Air takes care of the rest.
www.tidyverse.org/blog/2025/02...
21.02.2025 15:10 — 👍 362 🔁 121 💬 20 📌 20
A tmap logo

A screenshot of the tmap CRAN webpage.
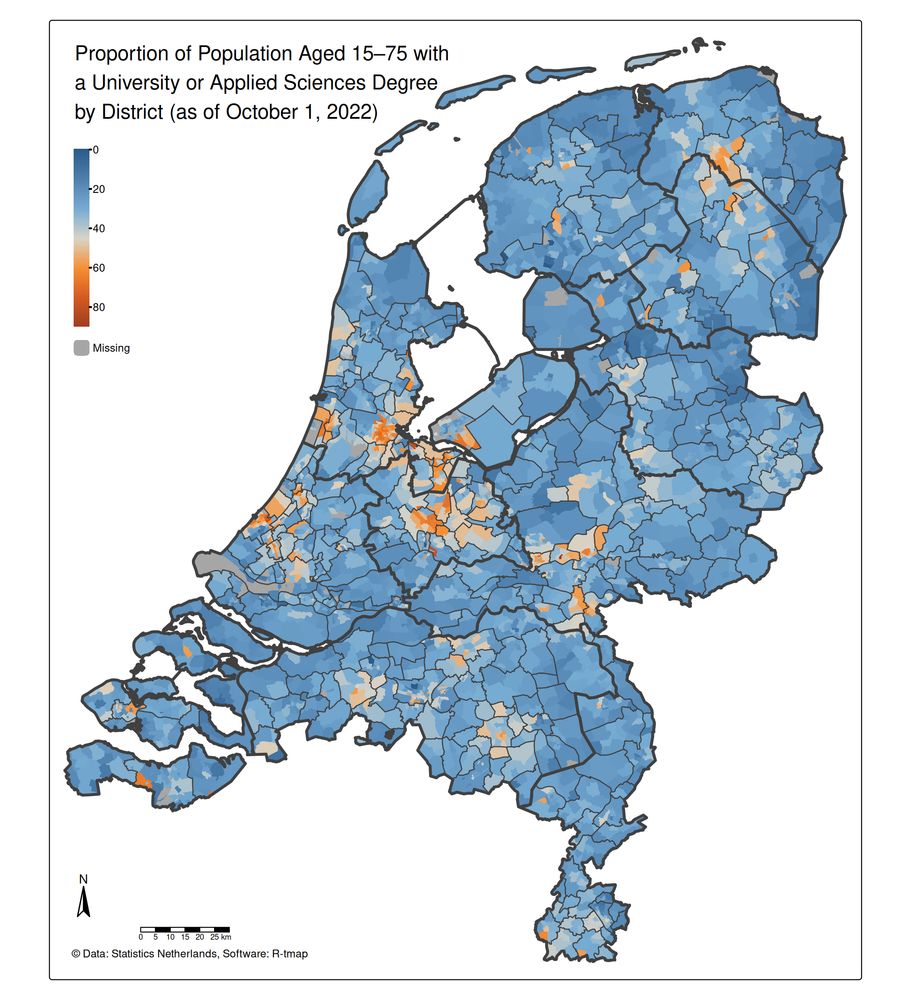
A map from tmap vignette
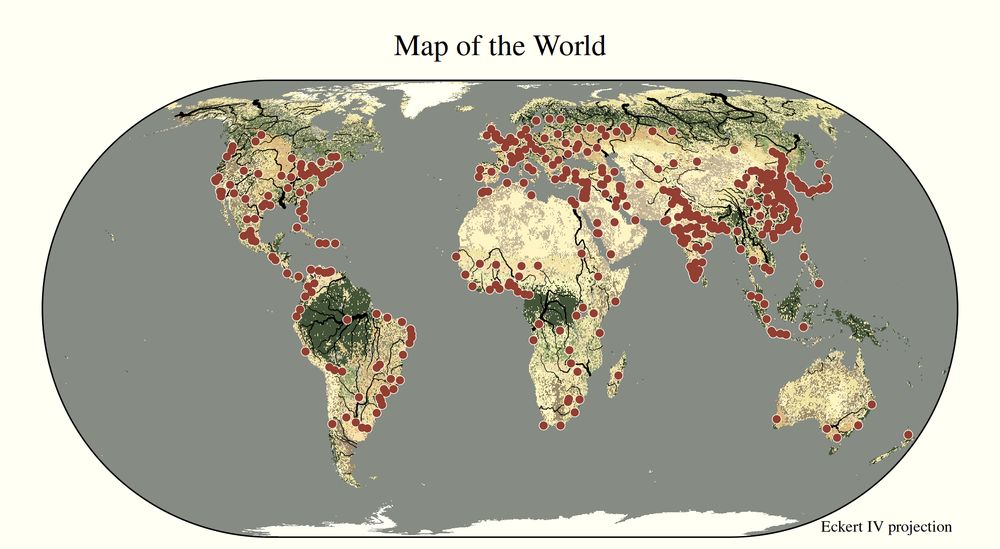
A map from tmap vignette
🚨 After years of development, the new version of #rstats tmap (4) is now available on CRAN! 🎉 Huge thanks to author Martijn Tennekes and all contributors.
🔧 Install: `install.packages("tmap")`
📚 Vignettes: https://buff.ly/4aAYNbq
📖 Book Chapter: https://buff.ly/43TokaF
#maps #tmap #rspatial
29.01.2025 15:00 — 👍 132 🔁 39 💬 5 📌 2
Joining the ggplot2 team - Tidyverse
I joined the ggplot2 team and would like to share the experience.
If you have used #ggplot2 in the last couple of years you owe a great deal to @teunbrand.bsky.social who is behind most of the new features and fixes.
Read about his journey to become a part of the ggplot2 core team here:
28.01.2025 09:09 — 👍 98 🔁 24 💬 3 📌 2
A personal history of the tidyverse
I've been working on a history of the tidyverse for an upcoming special issue of the Australia/New Zealand Journal of Statistics celebrating 25 years of R. I'd love to get your feedback! What have I missed?
hadley.github.io/25-tidyverse...
#rstats
27.01.2025 15:51 — 👍 224 🔁 59 💬 14 📌 5
Always a pleasure to work with @richmeister.bsky.social !
06.01.2025 18:30 — 👍 1 🔁 0 💬 0 📌 0

The brand new `legendry` package by @teunbrand.bsky.social takes ggplots2 guides to the next level 🤩
teunbrand.github.io/teunbrand_bl...
22.11.2024 03:44 — 👍 234 🔁 55 💬 16 📌 8
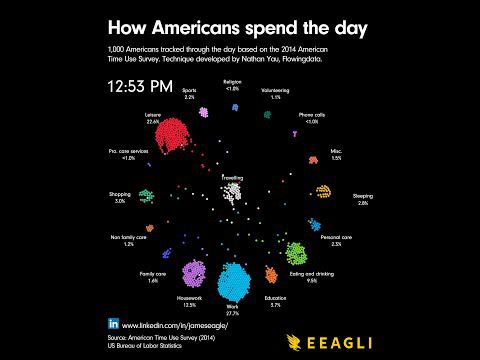
YouTube video by James Eagle
How Americans spend the day in data
Love this visual www.youtube.com/watch?v=jjrf...
02.12.2024 13:10 — 👍 0 🔁 0 💬 0 📌 0

Screenshot of R console with a tibble printed
Today I wanted to share how I print my tibbles in #rstats
Inspired by how readr prints the column spec
pinpoints NA values, adds color, identifies 1-to-1 relationships, and organizes variables by type in footer, clickable links to see other summaries
28.11.2024 14:31 — 👍 3 🔁 0 💬 0 📌 0

Changelog
📦 usethis 3.1.0 📦 is released. `use_vignette()` and `use_article()` can now help you initiate a Quarto (.qmd) vignette or article. #rstats
usethis.r-lib.org/news/index.h...
26.11.2024 15:55 — 👍 115 🔁 31 💬 3 📌 0

Bar mosaic chart showing the distribution of 'monster' movies by decade and title type (Movie, TV Movie, Video) from 1960 to 2020. Movies have dominated in recent decades, while TV Movies and Videos were more prominent in earlier years.
Here is my #viz for the #TidyTuesday challenge—W44. This one is about monster movies.
.
🔗: stevenponce.netlify.app/data_visuali...
.
#rstats | #r4ds | #dataviz | #ggplot2
28.10.2024 20:23 — 👍 11 🔁 2 💬 0 📌 0
Welcome to the data.table ecosystem project! – Blog
Hey y'all,
Since the #rstats clan seems to migrating in force, just thought I'd re-introduce this account.
It's run by @kellybodwin.bsky.social on behalf of the #rdatatable NSF grant project - read more here:
rdatatable-community.github.io/The-Raft/pos...
🧵 1/6
15.11.2024 06:59 — 👍 18 🔁 7 💬 1 📌 0

Role-Based Access Control for Quarto sites with Netlify Identity | Emily Riederer
A quick tech note on Netlify’s managed authentication solution
A common question I've seen from #data folks using Quarto is how to gate content or protect a site behind a login
Just wrote a short tech note on my blog about my recent experience using Netlify Identity for this
www.emilyriederer.com/post/quarto-...
10.11.2024 12:55 — 👍 73 🔁 14 💬 3 📌 0
labelled::set_variable_labels() works a bit like dplyr::rename
29.10.2024 16:27 — 👍 2 🔁 0 💬 0 📌 0
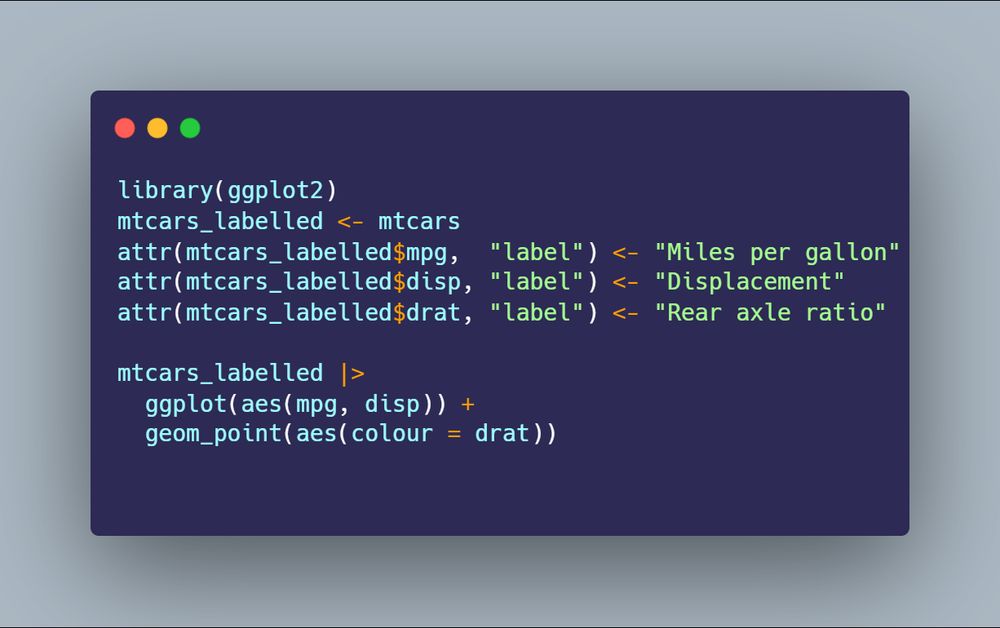
library(ggplot2)
mtcars_labelled <- mtcars
attr(mtcars_labelled$mpg, "label") <- "Miles per gallon"
attr(mtcars_labelled$disp, "label") <- "Displacement"
attr(mtcars_labelled$drat, "label") <- "Rear axle ratio"
mtcars_labelled |>
ggplot(aes(mpg, disp)) +
geom_point(aes(colour = drat))
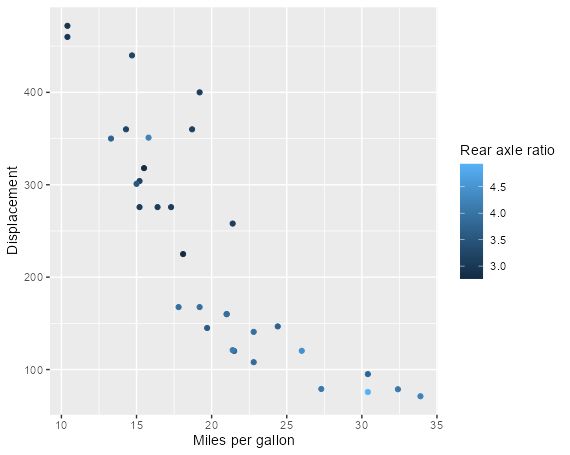
ggplot figure showing "Miles per gallon" on x-axis, "Displacement" on y-axis, and "Rear axle ratio" on legend.
y'all probably know i ❤️labelled data. the dev version of {ggplot2} has a new feature that automatically applies variable labels when plotting 😍✨ thank you @teunbrand.bsky.social!!! 🙏 #rstats
29.10.2024 12:59 — 👍 127 🔁 31 💬 10 📌 2
#RStats
Has anyone got a good workflow for collaborating on a Word document produced via Rmd (via {officedown})
Caveats : only one R user
Multiple SMEs
No git / source control
Many rounds of redrafts / changes as new requirements evolve
Changes are marked up by SMEs in Word via track changes
22.10.2024 15:34 — 👍 2 🔁 3 💬 1 📌 0
Christ, this is brutal, and they haven’t missed a single one yet. That has to be a Dem record? certainly longer than any other primary or main ticket campaign I’ve seen in the 20 years I lived here.
13.08.2024 04:43 — 👍 7 🔁 2 💬 1 📌 0
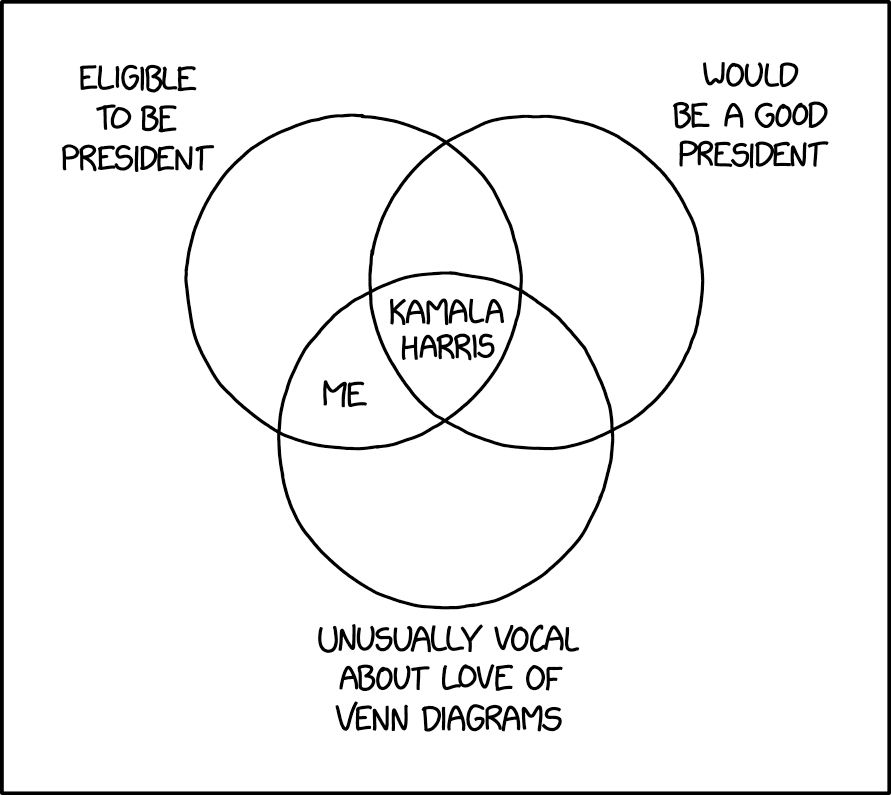
President Venn Diagram xkcd.com/2962
23.07.2024 00:03 — 👍 6867 🔁 1439 💬 58 📌 70
Software Engineer, Open Source @posit.co
Open Science is a pleonasm | Evidence-based teaching | Volunteer | Uppsala Makerspace | Open Science Community Uppsala
Editor-in-Chief 338Canada丨Rédacteur en chef Qc125丨Chroniqueur @ L'actualité, The Walrus & Politico Canada丨Co-host The Numbers podcast丨Prof astronomy & astrophysics丨Occasional cat pictures🤍丨📍Montréal
maxing the pixels to glow
R, Python, GDAL, virtual Zarr, coordinate systems, southern ocean research
I sit and reflect about all that I've learned and all that I've seen
hypertidy.org
Open source #rstats + #python + data + web
Shiny dev at @posit.co
github.com/schloerke
schloerke.com
Statistician, Computational Biologist, R |> Bioconductor
https://www.huber.embl.de
Textbook: Modern Statistics for Modern Biology https://www.huber.embl.de/msmb/ (with @sherlockpholmes.bsky.social)
Postdoc #socialpsychology @centerconflictcooperation.com @nyu.edu | Prosocial cognition, morality, social identity | #Rstats | #OpenScience | @easystats.github.io 🤘
Spatial data science languages, open science, R foundation, upright bass
asst prof of computer science at cu boulder
nlp, cultural analytics, narratives, communities
books, bikes, games, art
https://maria-antoniak.github.io
Research in #statistics, University of Warwick. https://warwick.ac.uk/dfirth
Also @firthstat@fediscience.org (Mastodon)
Current main interest is compositional data analysis. Programming in #rstats
Biostatistician | Public Health | always learning
#rstats
Scaling spatial computing at Wherobots, Inc. ApacheArrow PMC, #gischat, #rstats, ex Voltron Data.
#rstats #ggblanket
https://github.com/davidhodge931/ggblanket
Sociologist/Demographer; studies racial classification and identification; lazy Bayesian, R enthusiast, git evangelist, poisson stan.
Table generation packages for R and Python. Helping you make beautiful tables since 2018. Join our wonderful Discord at https://discord.gg/Ux7nrcXHVV
Yes it's me from twitter and @bigbookofr.com!
#dataBS #RStats
Computational biologist 🧬🖥️ at Mass General Brigham and Broad Institute, PhD at Harvard. Bioinformatics, transcriptomics, COVID, genomics, immunology, genetics, statistics, and web development. I made #ggrepel and I blog at https://slowkow.com
PhD student in metascience at Uni Bern | R package developer – {scrutiny}, {unsum}, and more | https://github.com/lhdjung | #rstats | forensic metascience | error detection | missing value handling