Chiediamo al governo di pubblicare in modo regolare, completo e accessibile i dati sulla violenza maschile contro le donne e di genere #dativiolenzadigenere #datibenecomune
www.datibenecomune.it/2025/11/05/u...

@mcx83.bsky.social
📊 #BI and #dataViz Consultant | 😱 #horrorchart collector | 💡Insights & Data @Capgemini | socio @ondatait.bsky.social Torino, Italy.
Chiediamo al governo di pubblicare in modo regolare, completo e accessibile i dati sulla violenza maschile contro le donne e di genere #dativiolenzadigenere #datibenecomune
www.datibenecomune.it/2025/11/05/u...

Nella legge sulle statistiche in tema di violenza di genere, come è definita la relazione autore vittima? In che articoli?
Nella legge sulle statistiche in tema di violenza di genere, come è definita la relazione autore vittima? In che articoli?
Abbiamo creato normattiva2md, per poter accedere facilmente al catalogo delle leggi italiane e darne in pasto i contenuti all'AI.

📊 Nel 2024/25, il numero di studenti che non sceglie di frequentare l'Insegnamento della Religione Cattolica (Irc) è aumentato di 42.000 studenti
Per ulteriori dettagli e dati, visitate il sito: uaar.it/dati-no-irc
#datiBeneComune

📊 I dati sulla violenza di genere in Italia sono incompleti, frammentati, quasi invisibili.
Per questo abbiamo lanciato una campagna: oltre 24.000 firme raccolte.
Ma non è solo questo. Ecco cosa c'è nella newsletter di gennaio 👇
open.substack.com/pub/ondata/p...

Un numero speciale di "Liberiamoli tutti!" per dare senso e valore alla campagna di #DatiBeneComune sulla richiesta di pubblicazione dei dati sulla violenza di genere
open.substack.com/pub/datibene...

"Quante volte i deputati di un certo partito hanno parlato di mafia, di aborto o di altri temi rilevanti nel corso del tempo?"
Grazie a "ItaParlCorpus", la banca dati sui resoconti stenografici dei dibattiti parlamentari, è possibile scoprirlo.
open.substack.com/pub/datibene...

I dati sulla classifica annuale 2025 sulla qualità della vita nelle province italiane del Il Sole 24Ore sono disponibili su GitHub
github.com/IlSole24ORE/...

The first edition of the new newsletter is out! Check it out IF YOU DARE (halloween)
www.howtoreadthisch.art/the-glorious...

Dataset sulla Palestina: per aiutarti a raccontare la loro storia
data.techforpalestine.org

The only way to close off this long, rich thread is with a picture of my #OpenData friends in Italy! @dennisangemi.bsky.social @aborruso.bsky.social @mcx83.bsky.social @puntofisso.bsky.social @ingmmo.bsky.social @matteofortini.bsky.social @giorgialodi.bsky.social
Thank you, #csvconf ❤️🔥

Italian #opendata legends @aborruso.bsky.social and @giorgialodi.bsky.social
now at #csvconfv9 talking about 15 years of Open data in Italy.
@csvconf.bsky.social
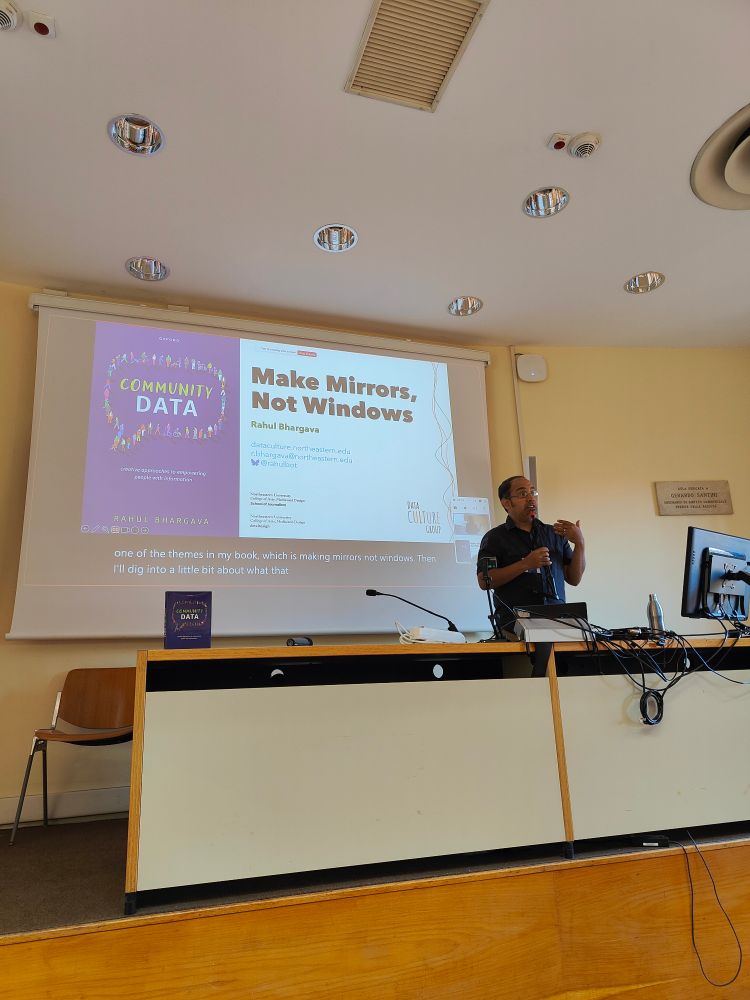
Nice to be in Bologna today for #csvconfv9 and starting with a talk by @rahulbot.bsky.social!
@csvconf.bsky.social
#csvconfv9 is ready to kick off! The venue is stunning, coffee is flowing, and talks are gonna be beautiful! Stay tuned, as I'll try to post here and there :) @csvconf.bsky.social
10.09.2025 07:34 — 👍 11 🔁 6 💬 1 📌 2😂 😂 😂
08.08.2025 07:59 — 👍 1 🔁 0 💬 0 📌 0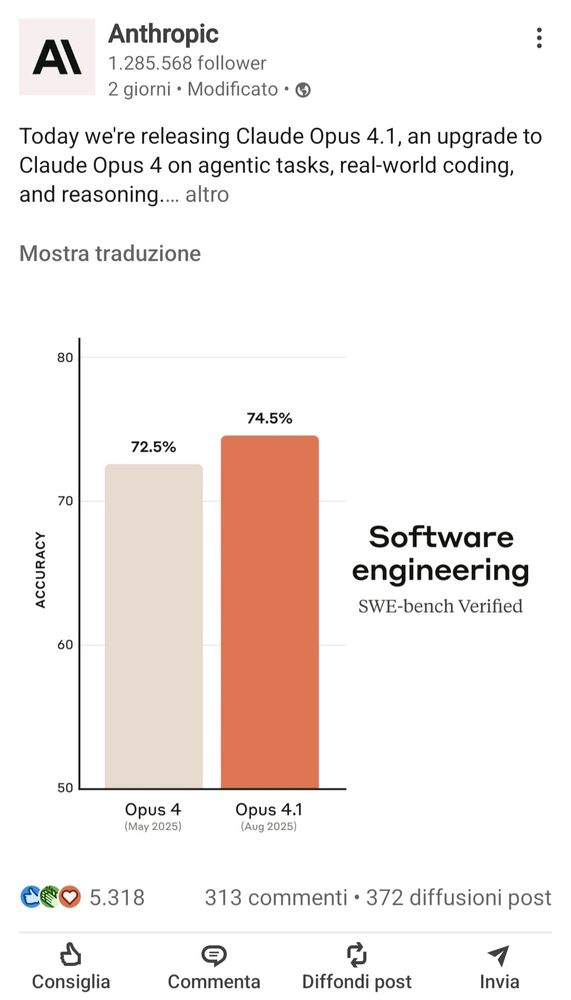
After the #GPT5 chart failure, I also discovered that Anthropic is promoting benchmark increases with... a truncated y-axis bar chart.
#dataviz #horrorchart

This is coming from the official presentation video: www.youtube.com/live/0Uu_VJe... around 30:48
08.08.2025 06:19 — 👍 1 🔁 0 💬 0 📌 0#horrorchart directly from the brand new #GPT5.
#dataviz
Vale vale!
08.08.2025 06:11 — 👍 1 🔁 0 💬 0 📌 0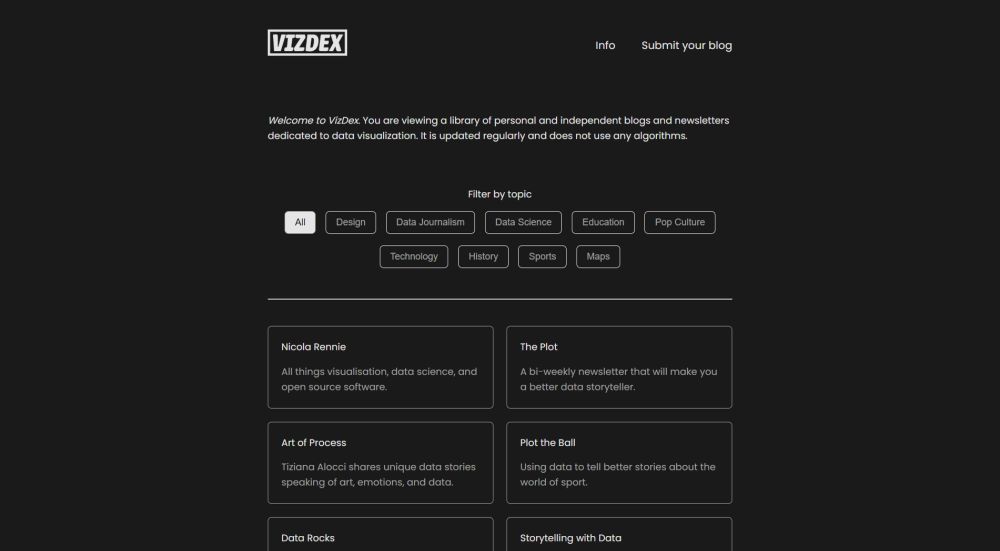
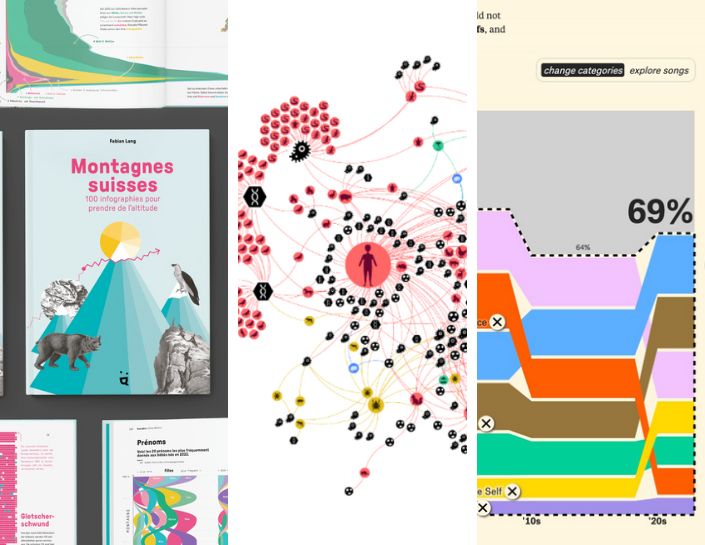
Introducing VizDex!
An ever-growing library of personal and independent blogs and newsletters dedicated to data visualization.
vizdexproject.com

Just a reminder: #dataviz isn't intrinsically good or bad. Like other forms of communication, it can -and will- be used for propaganda as well.
By the way, the photo is from 2012.
OMG #visualized will be back!! Visualized share.google/tOOaw9XSEVa4...
15.06.2025 18:27 — 👍 11 🔁 2 💬 2 📌 1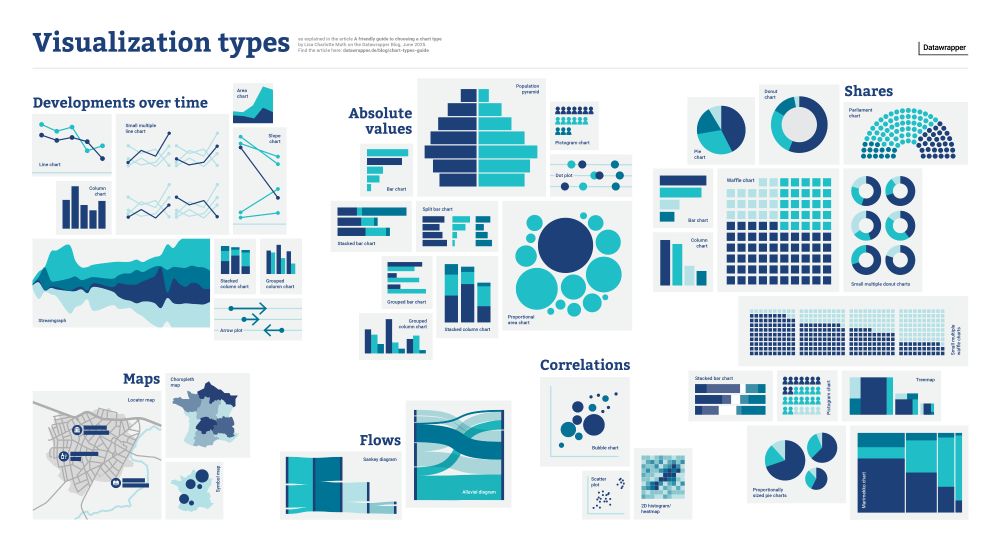
A poster showing icons for 40 different visualization types, categorized by goal – e.g. "showing shares" or "showing flows" or "showing developments over time".
📊 There are *so* many chart types out there. Which one should you use for what kind of data and goal?
I tried to answer the question in a new blog post (and poster!): www.datawrapper.de/blog/chart-t...
We’re thrilled to unveil the winners of the 2024 #IIBAwards! These works stand out not just for their mastery of #dataviz and storytelling, but for their impact and innovation. See the winners: www.informationisbeautifulawards.com/news/680-ann...
14.06.2025 21:40 — 👍 40 🔁 10 💬 1 📌 1
Visualizing abstract numbers / actual human beings ... visualizingpalestine.org/gaza-names/e...
23.05.2025 12:24 — 👍 19 🔁 9 💬 2 📌 2What is #dataviz animation good for? An updated thread with examples.
15.05.2025 12:49 — 👍 104 🔁 26 💬 7 📌 11Not sure if this falls into the #scrollytelling category, but this is a very clever way to use social media to show a #dataviz.
13.05.2025 12:58 — 👍 10 🔁 1 💬 1 📌 0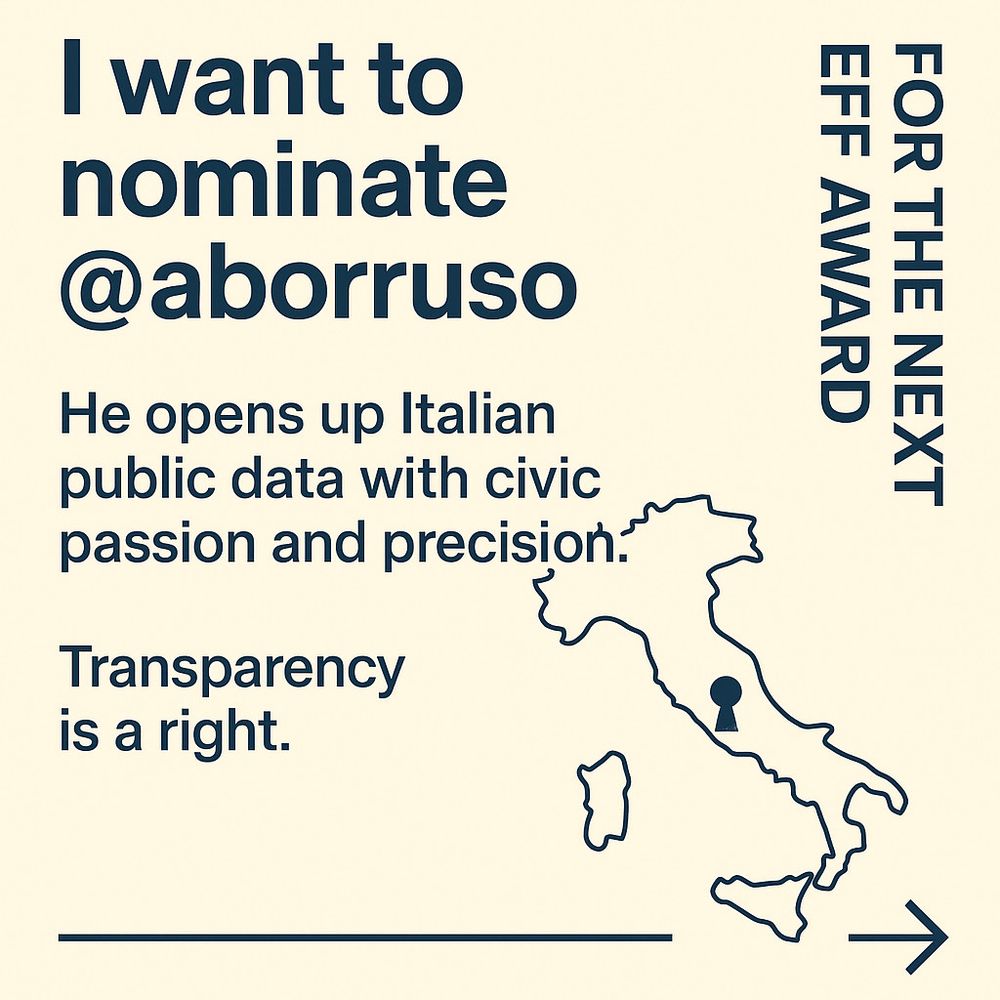
I want to nominate @aborruso.bsky.social for the next @eff.org award.
He opens up Italian public data with civic passion and precision.
Transparency is a right.
www.eff.org/nominate-nex...
#EFFAward #OpenData #CivicTech

Our new interactive work is out! The New Pope. This is How the Catholic Church elects. #dataviz #interactive #infograohics #3D #datavisualization atlo.team/wp-content/u...
05.05.2025 07:21 — 👍 6 🔁 3 💬 1 📌 3Ooh I see what you mean 😄 maybe like a Tabletop Simulator version of it!
28.04.2025 10:15 — 👍 1 🔁 0 💬 1 📌 0@luca-bolognini.bsky.social
28.04.2025 10:13 — 👍 0 🔁 0 💬 0 📌 0