A paper on the probability words used in intelligence analysis. Each word is meant to relate to a specific probability range. But people interpret these words in varied ways. "Participants greatly overestimated the probability for realistic possibility"
www.tandfonline.com/doi/full/10....
28.03.2025 09:50 — 👍 147 🔁 27 💬 6 📌 5
Hex logo for my course, Psychology of Data Visualization, featuring an image of various graphic ideas inside a brain
ANNOUNCE:
📊 I'm teaching my favorite course, _Psychology of Data Visualization_ again starting in Jan. Among other topics: #history of #dataviz, graph #perception, #rstats graphs, data journalism, ...
Course materials available at: friendly.github.io/6135/
I'll use the tag #psy6135 for posts
03.12.2024 21:26 — 👍 64 🔁 12 💬 3 📌 0
Nice
27.03.2025 00:35 — 👍 2 🔁 0 💬 0 📌 0
So @jbgruber.bsky.social's {rollama} #rstats package here is actually super super cool
02.03.2024 16:29 — 👍 17 🔁 4 💬 0 📌 0
webr-demo
AUTHOR: Jeffrey M. Perkel
PUBLISHED: December 14, 2023
WEBR STATUS: 🟢 Ready!
WebR
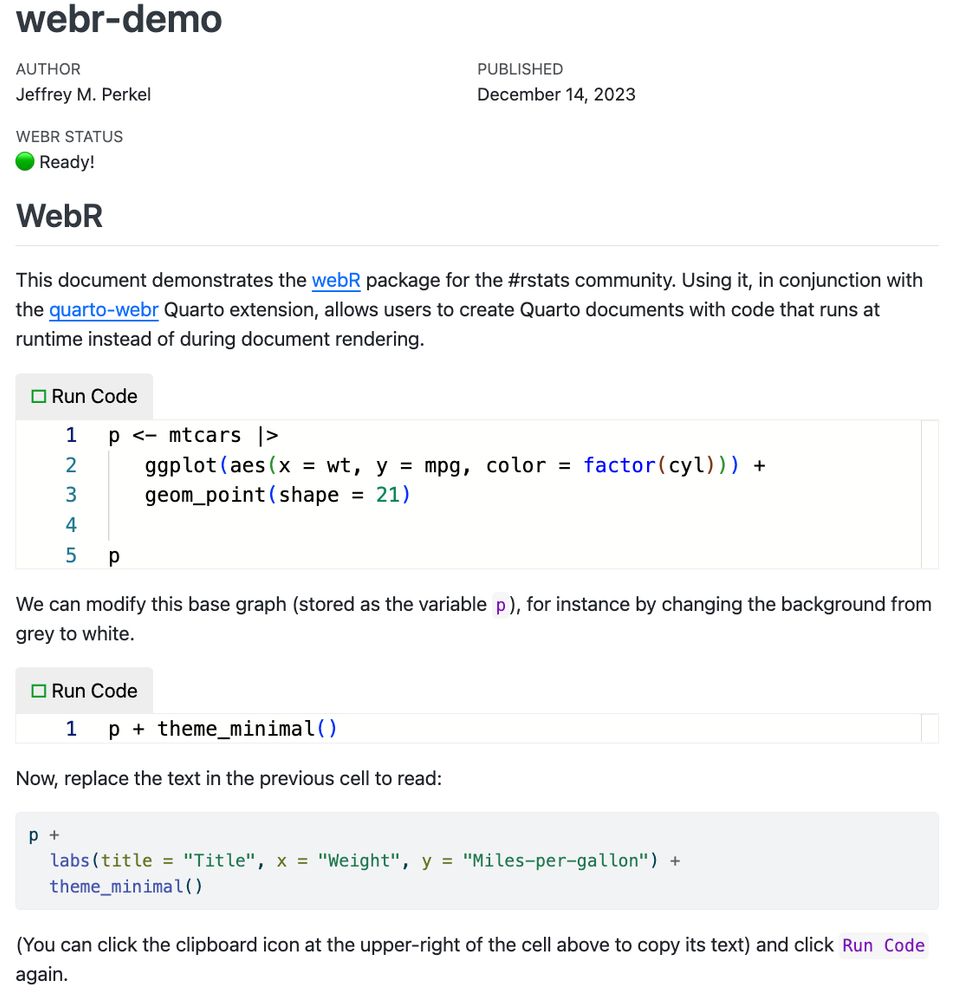
This document demonstrates the webR package for the #rstats community. Using it, in conjunction with the quarto-webr Quarto extension, allows users to create Quarto documents with code that runs at runtime instead of during document rendering.
p <- mtcars |>
ggplot(aes(x = wt, y = mpg, color = factor(cyl))) +
geom_point(shape = 21)
p
We can modify this base graph (stored as the variable p), for instance by changing the background from grey to white.
p + theme_minimal()
Now, replace the text in the previous cell to read:
p +
labs(title = "Title", x = "Weight", y = "Miles-per-gallon") +
theme_minimal()
(You can click the clipboard icon at the upper-right of the cell above to copy its text) and click Run Code again.
This is so cool. R running in the browser thanks to WebAssembly and {webR}, no installation required! Check it out! #Rstats jperkel.github.io
14.12.2023 23:43 — 👍 6 🔁 5 💬 0 📌 0
Specialist training in applied statistical methods for researchers in ecology, biology, and environmental sciences.
Courses are taught by leading academics and designed to support postgraduate students, early-career researchers, and established scientists
This is an automated new-posts account. Messages sent to it will go unread; attempts to converse with it will be fruitless. We would all be better off if Twitter and all its clones disappeared immediately.
The Union of Concerned Scientists puts rigorous, independent science to work to solve our planet's most pressing problems.
ucs.org
Environmental science for a better world, where people and nature prosper
💧🌳🌍
🎙️ Counting The Earth podcast: https://tinyurl.com/CTEarthpodcast
📰 Newsletter sign-up: https://tinyurl.com/ukceh-news
The London Archives is a free public archive focusing on the history of London from 1067. Visit today and explore 1000 years of history.
About us - https://www.thelondonarchives.org/
Events - https://www.eventbrite.co.uk/o/the-london-archives-2913691059
he/him - writing statistical software at Posit, PBC (née RStudio)🥑
simonpcouch.com, @simonpcouch elsewhere
Photo sharing bot for planetary and deep space images.
Run by @kevinmgill.bsky.social
Content providers added with permission.
The CCC is an underwater camera streaming live from an urban coral reef in Miami, FL. A public art & scientific research project by Coral Morphologic (https://bsky.app/profile/coralmorphologic.bsky.social) ◦ coralcitycamera.com
Neuroscientist and gardener
Lab site- saunderslab.com
Publishing the best of biotech science and business. Find us on Twitter, Facebook & Instagram. Part of @natureportfolio.nature.com.
We provide expert guidance, training, and advice in good research practice to improve #ResearchIntegrity and #ResearchCulture in the United Kingdom. Charity no. 1147061. ukrio.org, also at @ukrio@mstdn.science.
Investor and advisor in tech, Asia and beyond. www.duncanclark.com
Research, news, and commentary from Nature, the international science journal. For daily science news, get Nature Briefing: https://go.nature.com/get-Nature-Briefing
Science journalist and leatherworker.
Reporter for @chco-tv.bsky.social
Author of Lyme Disease in Canada
New Brunswick 🇨🇦
www.scibri.com
Associate Editor at Science covering plant science.
Senior Editor for #immunology, #infection, #immunotherapy, and #vaccines at Science Translational Medicine. My entire personality is based on immunology, my dogs, romantasy books, and pilates. She/Her. Opinions are my own.