2 years since we published this paper www.nature.com/articles/s41.... I've checked the around 100 papers that according to Scopus have cited our umbrella. 33% of these papers have cited it incorrectly.
06.10.2025 18:15 — 👍 3 🔁 2 💬 0 📌 0
@crist14n.bsky.social
PhD candidate at Eindhoven University of Technology. Having a great time doing meta-research. Wary optimism in sports and exercise science research
2 years since we published this paper www.nature.com/articles/s41.... I've checked the around 100 papers that according to Scopus have cited our umbrella. 33% of these papers have cited it incorrectly.
06.10.2025 18:15 — 👍 3 🔁 2 💬 0 📌 0
Introductory online INSPECT-SR workshop. November 6th, 12-2pm UK-time. Free, places limited. BOOK: www.trybooking.com/uk/events/la...
03.10.2025 11:08 — 👍 5 🔁 6 💬 1 📌 0
Histogram figure illustrating selection bias in estimating intervention effects. The central blue histogram shows the full population distribution of pre-scores (mean = 100, SD = 10). A green histogram (top left) shows a random sample of 1000 participants with similar mean (≈100) and SD (≈10), producing a raw intervention effect of ~8.7 and standardised mean difference (SMD) of ~0.86. A red histogram (top right) shows a conditionally sampled group (n = 1000, pre-score ≥ 110), with higher mean (≈115) and smaller SD (≈4.4). This sample yields a similar raw effect (~9) but an inflated SMD (~2.0) compared to the population. A corrected SMD brings it back closer to the true effect (~0.9). The figure illustrates how restricting samples to higher-performing individuals (e.g., “elite” athletes) compresses variance and artificially inflates standardised effect sizes, despite unbiased raw effects.
#SportScience, especially in elite sports, has an issue that can make effects seem more impressive than they really are... selection bias on the sample (explanation🧵 and a simulation pictured to illustrate below).
1/12
Congrats Peder! See you soon in Eindhoven!
26.09.2025 14:03 — 👍 1 🔁 0 💬 1 📌 0
Screenshot of first page of slidecrafting-book.com website
I'm exited to announce a new resource about making slides with quarto and revealjs. This book is the combination of all the work I have done in this area, reordered and polished up
There isn't a lot of new information yet, but this format allows me to add more easily
slidecrafting-book.com
#quarto
Version 2.0.0 of quarto-revealjs-editable now lets you edit the text in divs
github.com/EmilHvitfeld...
#quarto
So a spurious correlation from an observational study is “gold standard science”, but testing vaccines in multiple RCTs with over 30,000 participants each is not?
23.09.2025 14:01 — 👍 86 🔁 13 💬 5 📌 0
Figure 2 from preprint illustrating simulation workflow. From left to right, it goes from simulation grid, to generation function, to analysis function, to results table
Tidy simulation: Designing robust, reproducible, and scalable Monte Carlo simulations #StatsSky
arxiv.org/abs/2509.11741
It is not formally linked to the {tidyverse}, bit affinity is obvious.
The paper does a solid job in describing the simulation workflow, could be useful for intros to simulation
Excited to finally have my first paper officially published! "How Do Psychology Journals Handle Postpublication Critique?" is now online with AMPPS. Huge thanks to my supervisors @tomhardwicke.bsky.social and @simine.com and co-authors @bethclarke.bsky.social, N Moodie, S Schiavone, and R Thibault ☺️
17.09.2025 23:23 — 👍 42 🔁 16 💬 1 📌 3The new {marginaleffects} release for #RStats (0.30.0) comes with two new vignettes:
1. Speed up computation with automatic differentiation (often 10x gains) marginaleffects.com/bonus/perfor...
2. Power analyses with {marginaleffects} and {DeclareDesign}. marginaleffects.com/bonus/power....

Time is running out to register for our pre-symposium workshop and Meta Research Symposium event at Paul Meehl Graduate School
Check the information and registration links below:
paulmeehlschool.github.io/workshops/

This is big! Worked with great statisticians on guidelines for meta-analysis & systematic review. We discuss rationales for systematic review, evaluation & interpretation of heterogeneity, & common errors in network meta-analysis, funnel plots etc. www.europeanurology.com/article/S030...
05.09.2025 14:29 — 👍 21 🔁 6 💬 2 📌 0
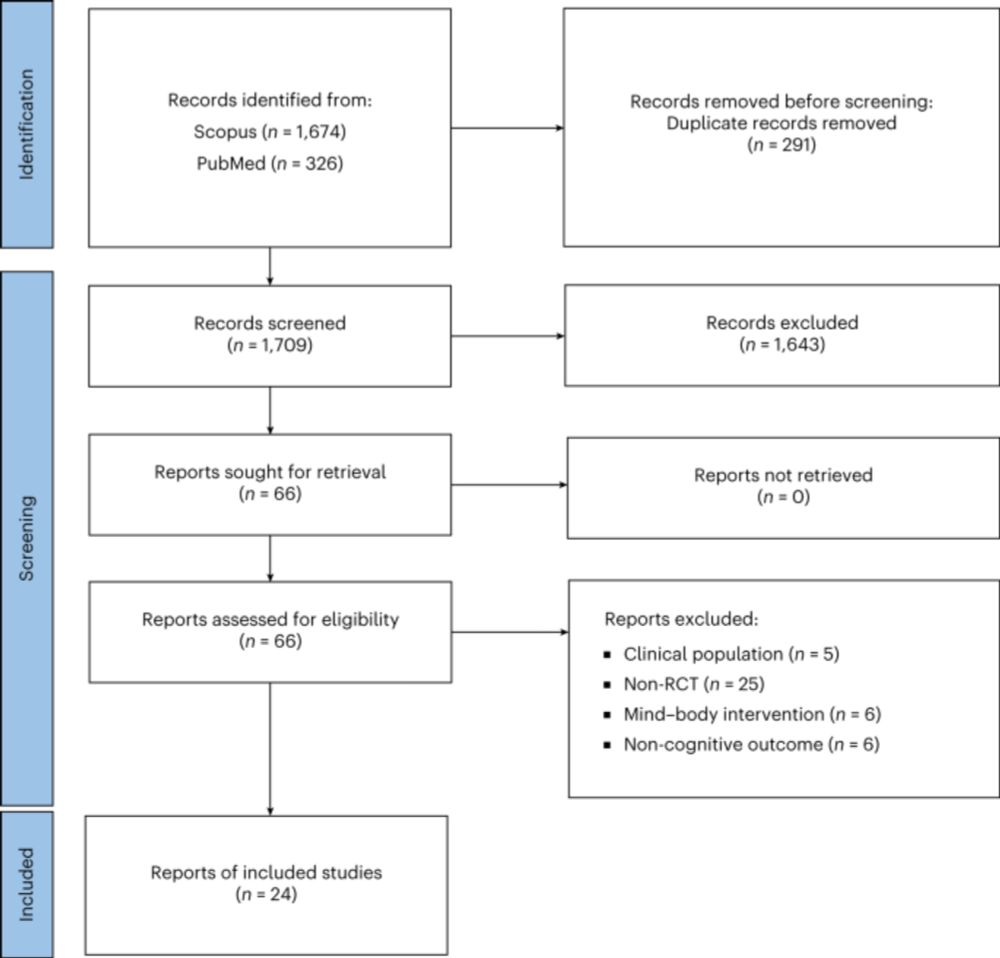
www.medrxiv.org/content/10.1...
INSPECT-SR: A tool for assessing trustworthiness of randomised controlled trials.

A further problem is illustrated by the authors equating no treatment with placebo. For example, describing their second assumption, they state, ‘Implicit in this notation is that there is a single version of ‘no treatment’ that is consistently defined across all subjects in the RCT and external controls’ (p4). However, most clinical trials are add-on trials (Senn, 2002), even if not specifically identified as such. In placebo-controlled trials, one starts with standard of care and then subjects are either allocated to receive in addition the active treatment or a placebo to it. The statistical analysis plan for SUNFISH (F Hoffman-La-Roche Ltd, 2020) has a protocol summary as Appendix 1, which has this to say, ‘In addition to the study drug treatment, patients may continue to receive concomitant drug medication…’ (p186). This is very standard for clinical trials. It highlights that a key assumption in borrowing control data in this way is that there has been no evolution in the standard of care in the period since the trial.
One of the most common misunderstandings about the use and value of placebos in clinical RCTs, often made by both methodological experts and experienced trialists:
(from @stephensenn.bsky.social in academic.oup.com/jrsssa/advan...)
Spending 3 full days coding up a simulation for a method that *should* be better, but performs identically to a common R function (that takes about 5 seconds to apply). Absolutely priceless.
#rstats
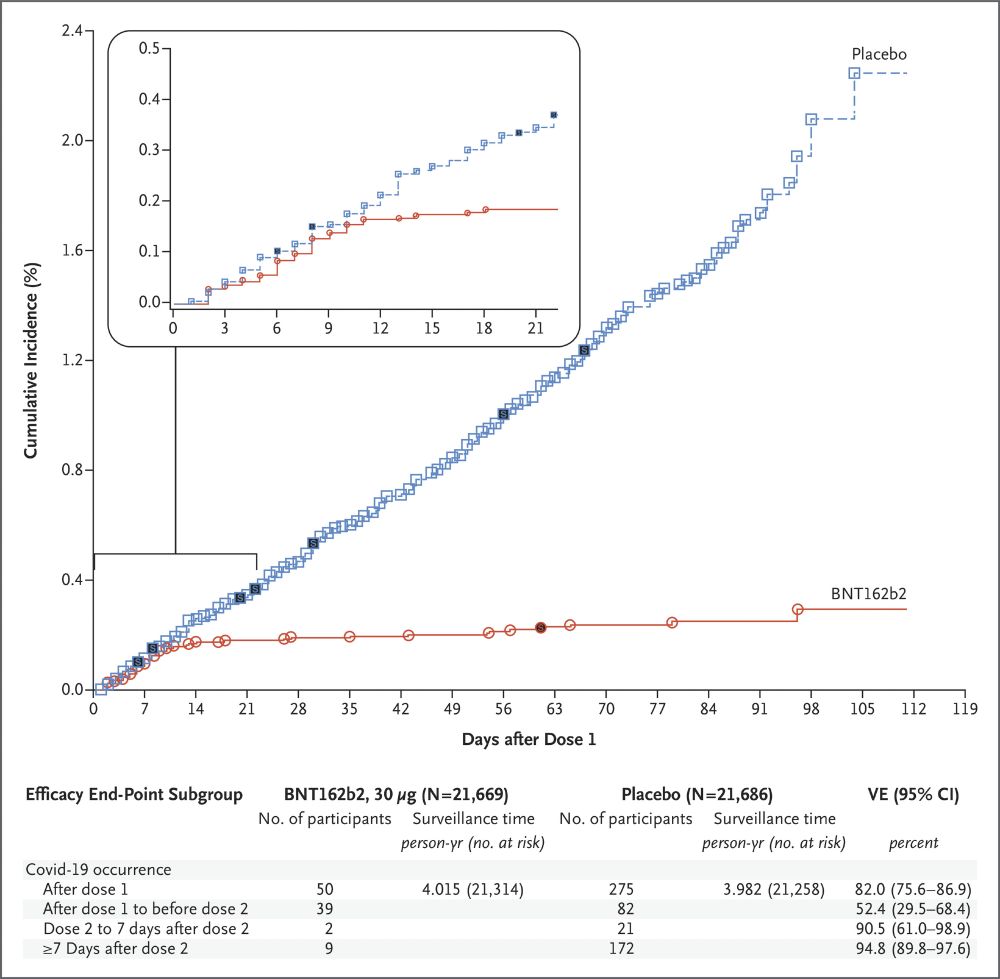
I love looking at this graph, showing it to my students, and sharing it on social media, even though it unerringly brings out the trolls.
This is the efficacy curve of Pfizer's mRNA COVID vaccine.
This, people, is what ended the emergency phase of the COVID pandemic. Despite what RFK Jr says.
It was a rewarding labour of love to work on this paper with a fantastic team of authors, “Understanding Treatment Response Heterogeneity Using Crossover Randomized Controlled Trials: A Primer for Exercise and Nutrition Scientists”. @hk-ijsnem.bsky.social journals.humankinetics.com/view/journal...
28.08.2025 17:50 — 👍 12 🔁 6 💬 2 📌 0
Models as Prediction Machines: How to Convert Confusing Coefficients into Clear Quantities Abstract Psychological researchers usually make sense of regression models by interpreting coefficient estimates directly. This works well enough for simple linear models, but is more challenging for more complex models with, for example, categorical variables, interactions, non-linearities, and hierarchical structures. Here, we introduce an alternative approach to making sense of statistical models. The central idea is to abstract away from the mechanics of estimation, and to treat models as “counterfactual prediction machines,” which are subsequently queried to estimate quantities and conduct tests that matter substantively. This workflow is model-agnostic; it can be applied in a consistent fashion to draw causal or descriptive inference from a wide range of models. We illustrate how to implement this workflow with the marginaleffects package, which supports over 100 different classes of models in R and Python, and present two worked examples. These examples show how the workflow can be applied across designs (e.g., observational study, randomized experiment) to answer different research questions (e.g., associations, causal effects, effect heterogeneity) while facing various challenges (e.g., controlling for confounders in a flexible manner, modelling ordinal outcomes, and interpreting non-linear models).

Figure illustrating model predictions. On the X-axis the predictor, annual gross income in Euro. On the Y-axis the outcome, predicted life satisfaction. A solid line marks the curve of predictions on which individual data points are marked as model-implied outcomes at incomes of interest. Comparing two such predictions gives us a comparison. We can also fit a tangent to the line of predictions, which illustrates the slope at any given point of the curve.

A figure illustrating various ways to include age as a predictor in a model. On the x-axis age (predictor), on the y-axis the outcome (model-implied importance of friends, including confidence intervals). Illustrated are 1. age as a categorical predictor, resultings in the predictions bouncing around a lot with wide confidence intervals 2. age as a linear predictor, which forces a straight line through the data points that has a very tight confidence band and 3. age splines, which lies somewhere in between as it smoothly follows the data but has more uncertainty than the straight line.
Ever stared at a table of regression coefficients & wondered what you're doing with your life?
Very excited to share this gentle introduction to another way of making sense of statistical models (w @vincentab.bsky.social)
Preprint: doi.org/10.31234/osf...
Website: j-rohrer.github.io/marginal-psy...

Been working on a tutorial on synthetic data for open science for @lmu-osc.bsky.social
A draft version is now up: lmu-osc.github.io/synthetic-da...
It covers model building, evaluating synthetic data utility with density ratio estimation, and disclosure risk.
Feedback is very welcome!
Happy to announce ✨quarto-revealjs-editable✨
This fully supersedes the imagemover extension, as I back then didn't realize the potential. You can now also move, resize, change font size and alignment for text in your slides
github.com/EmilHvitfeld...
#quarto #slidecrafting
Teaching/learning intro stats and R? #rstats
Explore my teaching materials, including syllabus, lecture slides, exercises, interactive graphs, and self-graded review exercises: ellaudet.github.io/dss_instructor_resources
Instructors using DSS: source files from PUP have just been updated!

The full program for the PMGS Meta Research Symposium 2025 is online: docs.google.com/document/d/1... If you are interested in causal inference, systematic review, hypothesis testing, and preregistration, join is October 17th in Eindhoven! Attendance is free!
20.08.2025 14:34 — 👍 21 🔁 13 💬 0 📌 3
The PMGS Meta-Research Symposium program is out!
📅 Oct 16–17, Eindhoven University of Technology
🧑🏫 Workshop: Aaron Peikert
🎤 Keynotes: Duygu Uygun-Tunç & Lisa Spitzer
👩🔬 Talks by early-career researchers
Check the program + register by Oct 1 👉 paulmeehlschool.github.io/2025-08-17-p...
For those interested, here is a link to a new power paper:
Hancock, G. R., & Feng, Y. (2026). nmax and the quest to
restore caution, integrity, and practicality to the sample size planning process. Psychological Methods.
yifengquant.github.io/Publications...
Excited to share my newest quarto revealjs plugin: imagemover
Easily reposition and resize images directly in your quarto revealjs slides for a much smoother slidecrafting experience
github.com/EmilHvitfeld...
#quarto
A letter from myself and @jdwilko.bsky.social that expands on this a bit more. Thanks to Fertility and Sterility for the opportunity.
doi.org/10.1016/j.fe...
Your intuitions about individual responses to training are probably wrong 😉
👇🧵 1/11

New Preprint: Rethinking Type S and M Errors. We argue Type S and M errors are not useful when designing or evaluating studies, and present alternative solutions to address the issues they were supposed to address (minimum effect tests, and correcting for bias with p-uniform). osf.io/preprints/ps...
05.08.2025 14:35 — 👍 20 🔁 8 💬 1 📌 2
Translation: The weighted average of the thing that can't be less than zero was very much significantly different from zero. Science!
23.07.2025 09:11 — 👍 10 🔁 1 💬 0 📌 0
SOMEONE PLEASE STOP ME
23.07.2025 09:05 — 👍 3 🔁 1 💬 1 📌 0