I think @chelseaparlett.bsky.social complained once about have to teach posterior-predictive functions have names like “pp_check()”
05.08.2025 20:15 — 👍 14 🔁 4 💬 7 📌 0
cumsum()
also this:
06.08.2025 03:04 — 👍 6 🔁 1 💬 3 📌 0
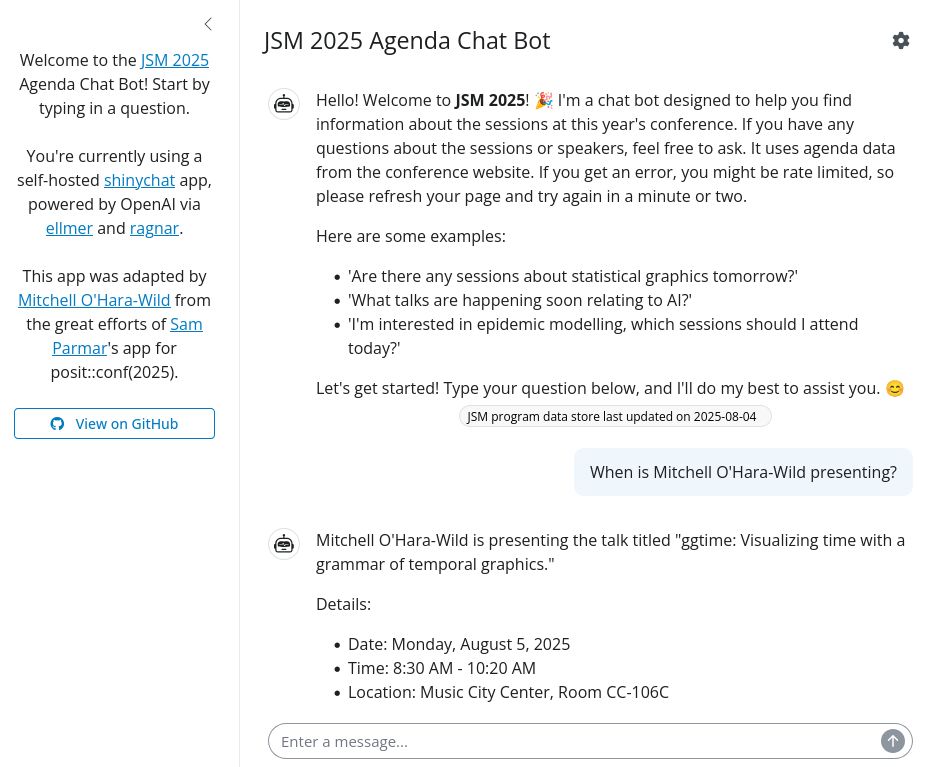
A screenshot of my JSM 2025 Agenda Chat bot, featuring the answer to "when is Mitchell O'Hara-Wild presenting".
There's so many parallel sessions at #JSM2025 that it's hard to choose where to go, so I web-scraped the schedule and made a chatbot to help.
I've made it public, so hopefully it can help you too - try it out 👉 shiny.mitchelloharawild.com/jsm2025/
04.08.2025 15:32 — 👍 17 🔁 8 💬 5 📌 0
hmm allow me to Google the words "frequentist" and "eugenics" and see if I can't drum up an answer to your question
02.08.2025 18:05 — 👍 5 🔁 0 💬 1 📌 0
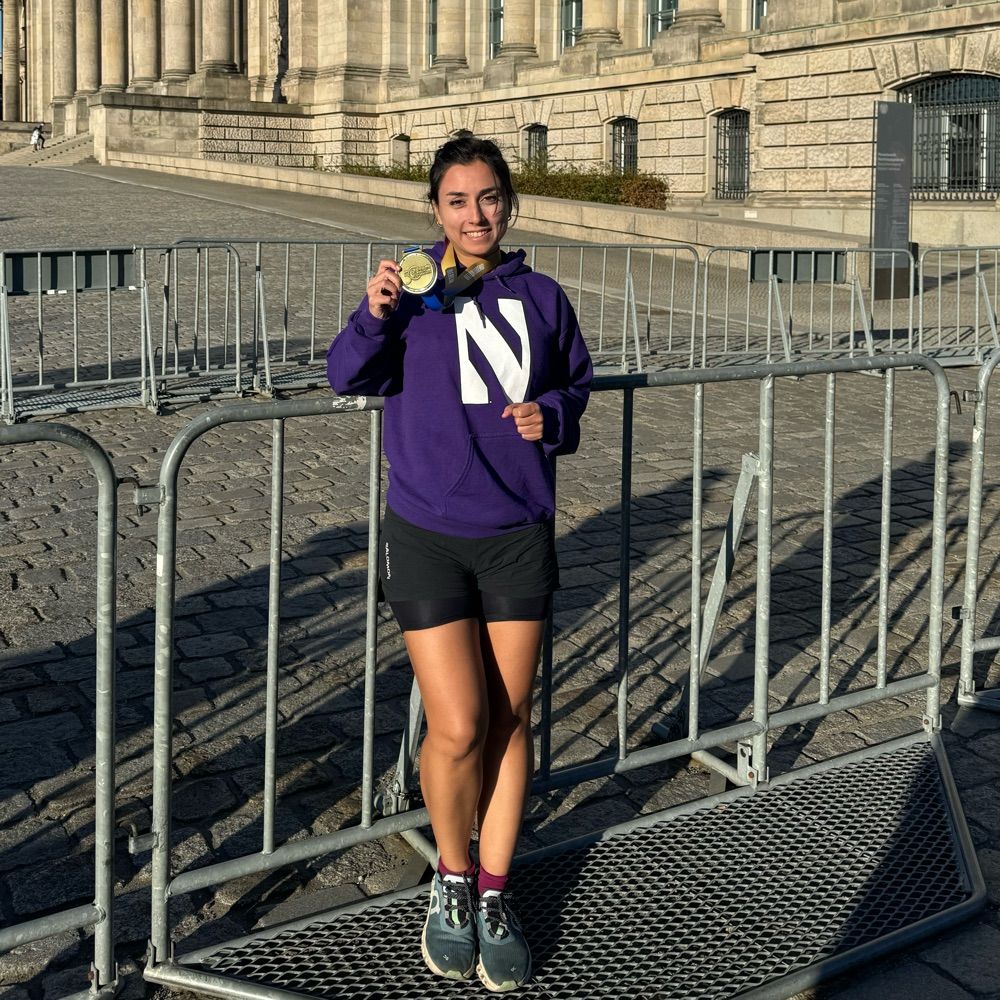
Congrats to Dr. @abhsarma.bsky.social on a successful Ph.D. thesis defense!
"Designing Interactive Systems for Reasoning with Ontological Uncertainty in Data Analysis"
Advised by @mjskay.com and me with Darren Gergle and Fanny Chevalier also on the committee.
02.08.2025 15:24 — 👍 14 🔁 1 💬 0 📌 1
Paula and her committee
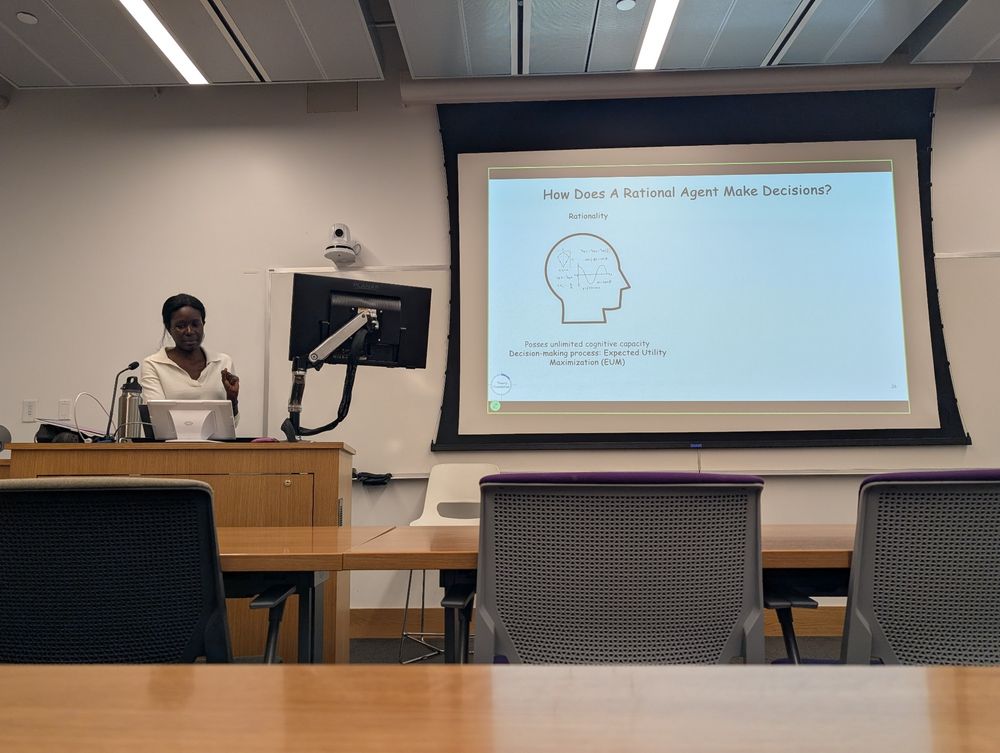
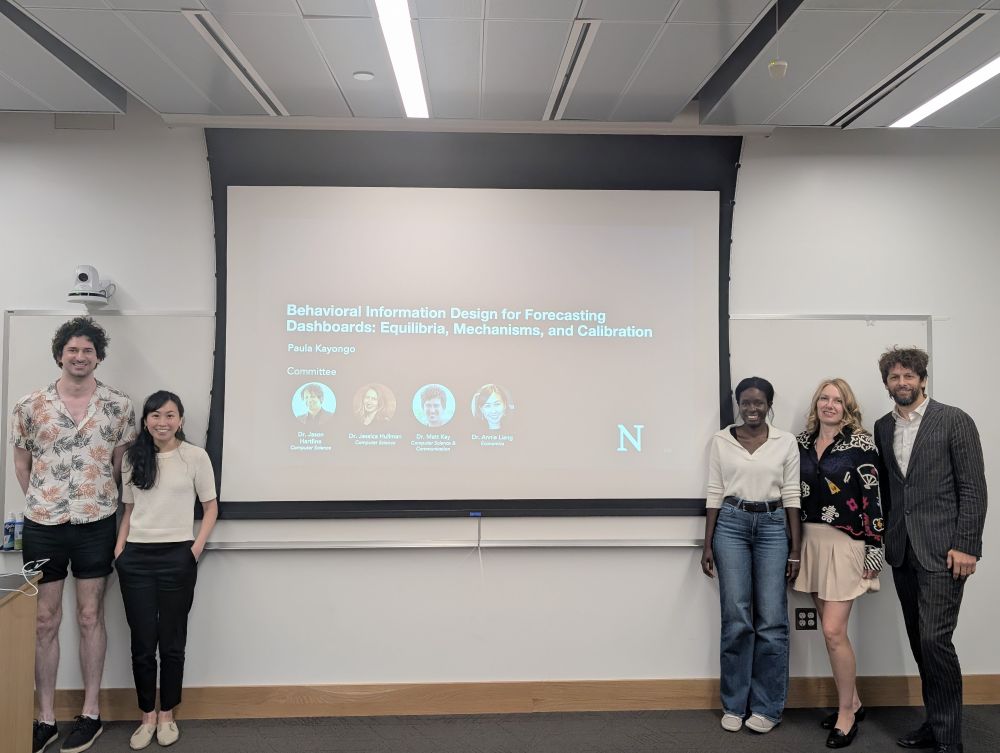
Paula defending her dissertation
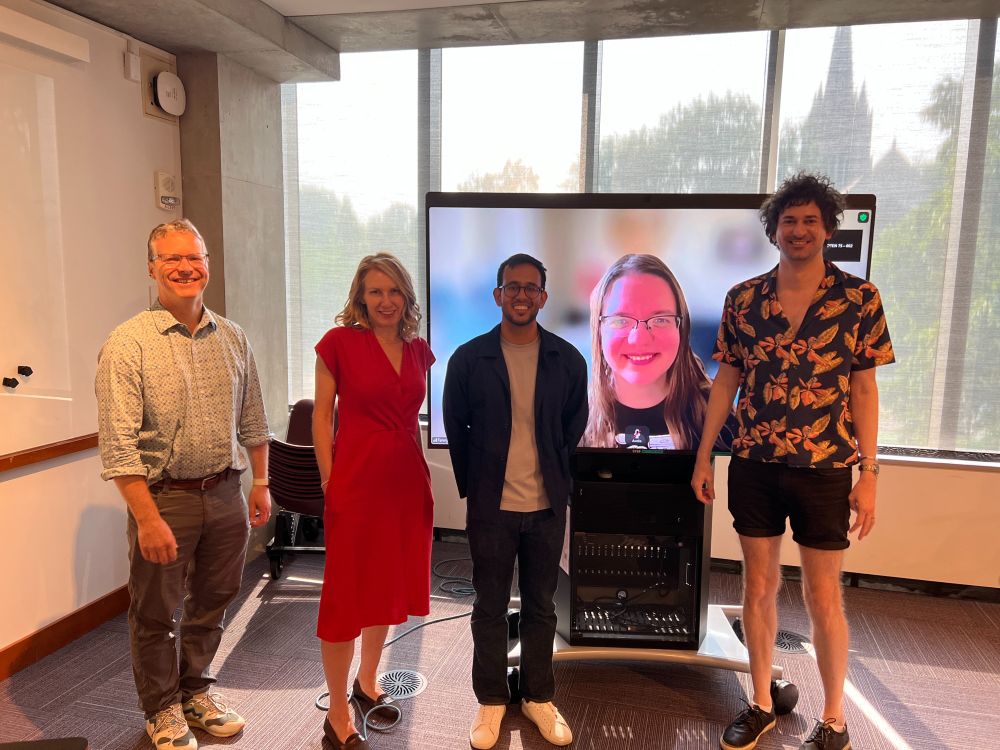
Congratulations Dr. Paula Kayongo for successfully defending her Ph.D. dissertation!
"Behavioral Information Design for Forecasting Dashboards: Equilibria, Mechanisms, and Calibration"
Thanks to her stellar committee: @jessicahullman.bsky.social, @mjskay.com, and Annie Liang!
01.08.2025 19:58 — 👍 13 🔁 2 💬 0 📌 0
If you've been working hard on an alt.vis25 submission, then good news!!
The alt.vis deadline is extended! It is now on AoE August 6. We look forward to seeing what you've been up to! Keep up the alt.work!!
31.07.2025 14:59 — 👍 3 🔁 2 💬 2 📌 0
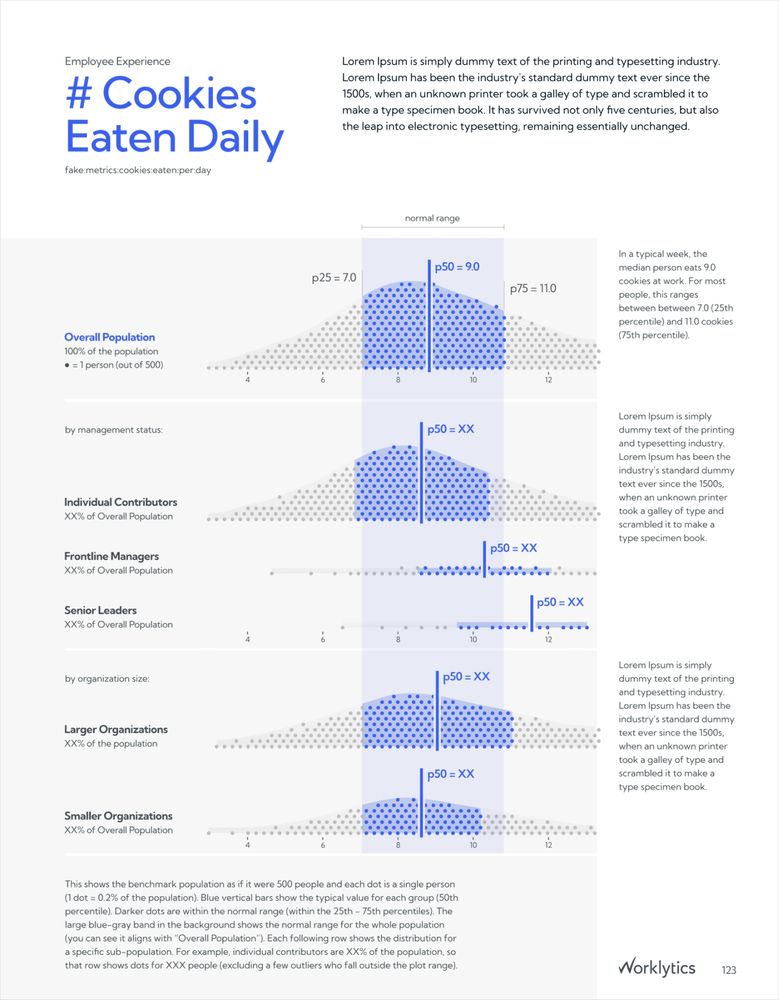
Worklytics - Work Analytics Benchmark Report Design and Specialized Data Visualization
Design system, visualization, and automation for the Worklytics Annual Benchmarks Report.
How do people work at work?
Also: How do you get quantile dot plots to play nicely in a dataviz 📊 design system across an 89 page report, with hundreds of different plots, each with varying distributions?
New deep-dive case study on my recent project for Worklytics: 3iap.com/work/worklyt...
30.07.2025 18:22 — 👍 31 🔁 8 💬 4 📌 1
An actually interesting take on NA handling in #rstats! That we can treat it like a monad and use function wrappers to handle it instead of arguments like na.rm. I really like this!!
30.07.2025 17:36 — 👍 11 🔁 3 💬 1 📌 0

Let's talk about NA-s!
ARTHUR: Well, what is it you want?
HEAD KNIGHT: We want… a paste function that can deal with NA-s!
A language for statistical computing clearly needs to be able to deal with missing values, and R has ...
Interesting read about NA handling in #rstats (via rweekly.org/2025-W31.html): www.biobits.be/biofunctor/2...
The overview of the {stats} package's various NA utility functions was informative: `na.pass`, `na.omit`, `na.exlude`, `na.contagious`, and `na.fail`.
1/2
30.07.2025 16:02 — 👍 20 🔁 6 💬 4 📌 2
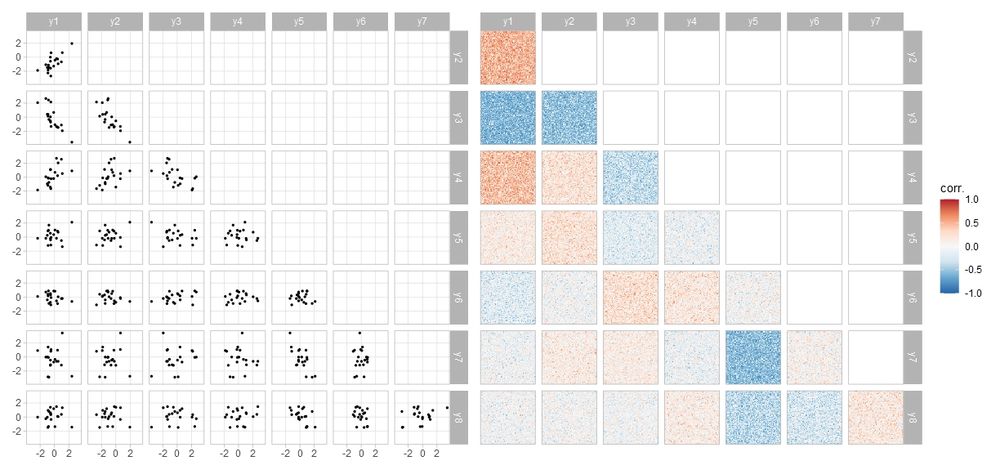
Scatterplot matrix alongside a dithered correlation heatmaps showing the correlation between each pair of variables (and its uncertainty)
Yeah with a map I think that interpretation is reasonable - it's what that visual form usually means. Makes the technique potentially tricky to apply (and also therefore interesting!)
Some time ago I played with these on correlation heatmaps which don't have that baggage
30.07.2025 06:41 — 👍 3 🔁 0 💬 0 📌 0
Funny @mitchelloharawild.com just mentioned this package to me earlier today! Really glad to see it being done in a usable way
30.07.2025 04:18 — 👍 4 🔁 0 💬 0 📌 0
I really like this idea and TBH I don't think existing empirical work tells us enough --- I'm not even sure what the right parameters would be (apparent "pixel" size, ordering, etc) to make these things work well, and I don't think that's been explored enough to even know if they do work...
30.07.2025 04:17 — 👍 1 🔁 0 💬 1 📌 0
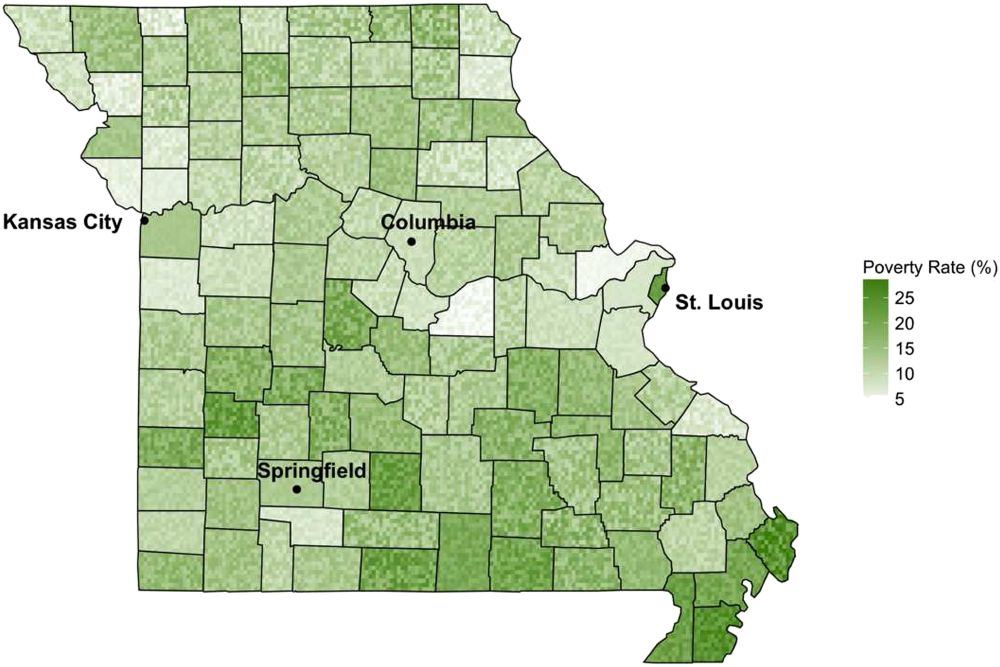
Pixelated display of uncertainty in county-level poverty rates from Lucchesi & Wikle (2017)
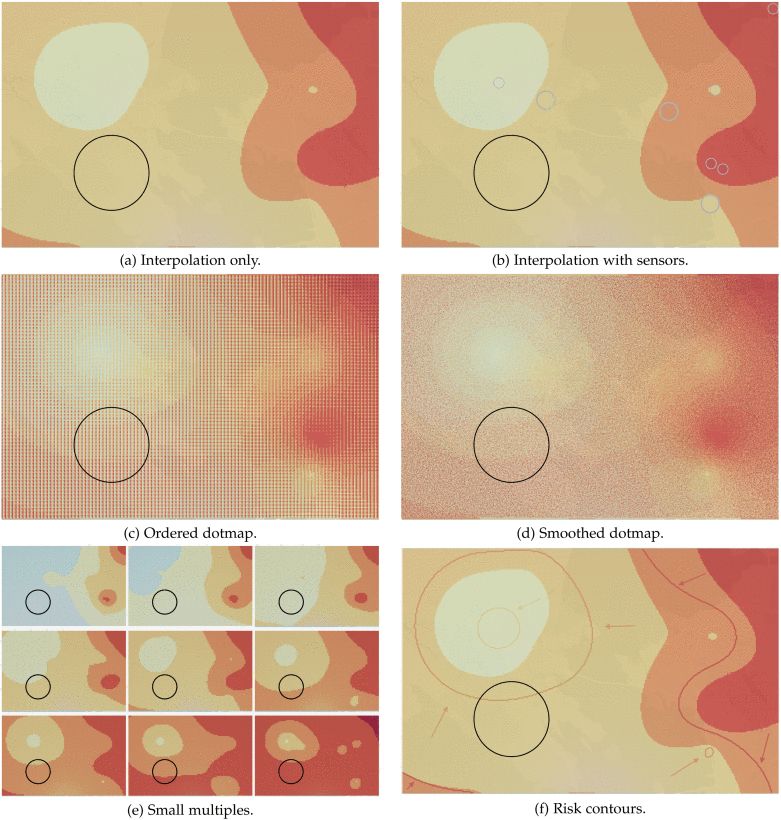
Visualization techniques evaluated in Preston & Ma (2022), of which the "dotmaps" are pixelated depictions of uncertainty: (a) interpolation only, (b) interpolation with sensors, (c) ordered dotmap, (d) smoothed dotmap, (e) small multiples, (f) risk contours.
It's been studied a bit, but not enough IMO (occasionally I contemplate it...)
Lucchesi & Wikle (doi.org/10.1002/sta4...) discuss it (and link to earlier work I've only found illegible scans of: doi.org/10.1016/S009..., and Preston & Ma did a study on some variations (doi.org/10.1109/TVCG...)
30.07.2025 04:12 — 👍 9 🔁 2 💬 4 📌 1
Pretty! Interesting use of gradients for data alongside the model
29.07.2025 16:04 — 👍 1 🔁 0 💬 0 📌 0
MOAR yes but I am like 3 deep on "package to write a package to write a package" and I need to pop stuff off the stack
26.07.2025 19:22 — 👍 3 🔁 1 💬 0 📌 0
I'd probably go the other way and make the text colored (but in a thicker font weight to compensate for reduced contrast) and make the glow white to help the text stand out better
26.07.2025 19:06 — 👍 5 🔁 1 💬 1 📌 0
I love Steve but also he likes to get into arguments and that tracks
26.07.2025 17:36 — 👍 1 🔁 0 💬 1 📌 0
goddammit every day is a new "hmm I should make a package for that" #rstats
26.07.2025 17:31 — 👍 31 🔁 2 💬 5 📌 0
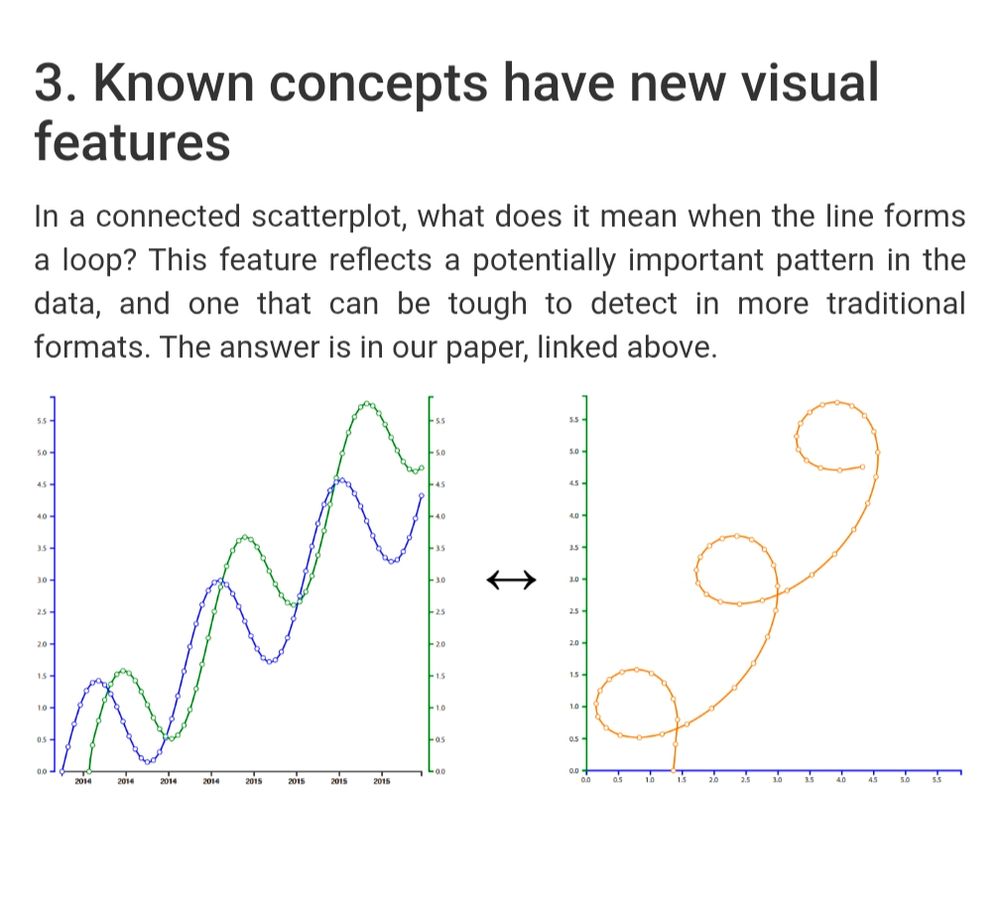
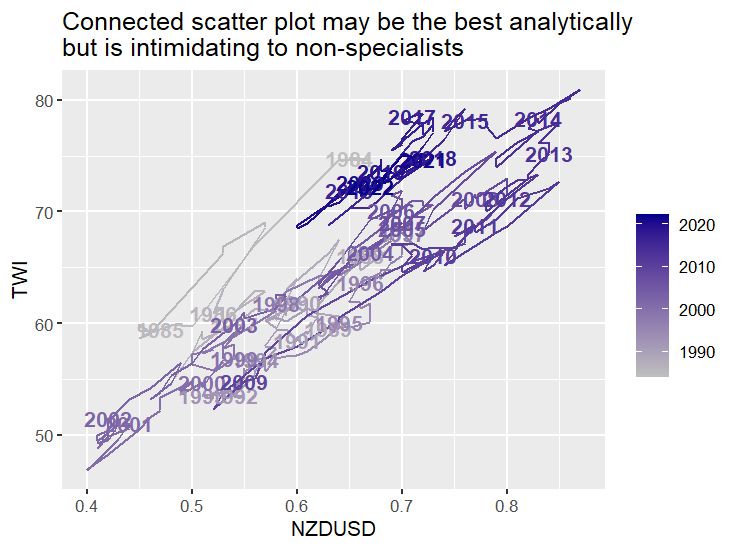
Excerpt from linked page showing a dual axis plot alongside its translation to a connected scatterplot, with this text:
Known concepts have new visual features.
In a connected scatterplot, what does it mean when the line forms a loop? This feature reflects a potentially important pattern in the data, and one that can be tough to detect in more traditional formats. The answer is in our paper, linked above.
@steveharoz.com has a nice page+paper that includes pros/cons of connected scatterplots and how to read them: steveharoz.com/research/con...
26.07.2025 17:30 — 👍 4 🔁 1 💬 1 📌 0
they're always there, waiting...
26.07.2025 17:24 — 👍 3 🔁 0 💬 0 📌 0
Re: z scoring, scaling to have the same mean and sd seems to me a reasonable way to do dual axis charts if you're gonna do them (not indexing)
that's what I did here though no one seemed to notice for some reason...
26.07.2025 17:23 — 👍 3 🔁 1 💬 2 📌 0
# dualaxes ----
# URL: https://freerangestats.info/blog/2016/08/18/dualaxes
library(readxl)
library(tidyverse)
library(scales)
devtools::install_github("ellisp/ggseas/pkg")
library(ggseas) # for stat_index()
library(grid)
library(gridExtra)
# Download data from the Reserve Bank of New Zealand
download.file("http://www.rbnz.govt.nz/-/media/ReserveBank/Files/Statistics/Key%20graphs/graphdata.xlsx?la=en",
destfile = "data/rbnz.xlsx", mode = "wb"
)
# Import some of that data into R and create a numeric TimePeriod variable from the original
# string that shows year and month:
forex <- read_excel(
path = "data/rbnz.xlsx", sheet = "NZDUSD", skip = 4,
col_names = c("DATE", "NZDUSD", "TWI"),
col_types = c("date", "numeric", "numeric")
)
forex <- forex %>%
mutate(
year = year(DATE),
month = month(DATE),
TimePeriod = year + (month - 0.5) / 12
) %>%
select(-DATE, -year, -month) |>
na.omit()
# Create a long, thin ("tidy") version for use with {ggplot2}:
forex_m <- forex %>%
gather(variable, value, -TimePeriod)
# Set the basic foundation of the coming ggplot graphics:
basicplot <- ggplot(
data = forex_m,
mapping = aes(x = TimePeriod, y = value, colour = variable)
) +
labs(
x = NULL,
caption = "Data from RBNZ; graphic by http://ellisp.github.io",
colour = ""
)
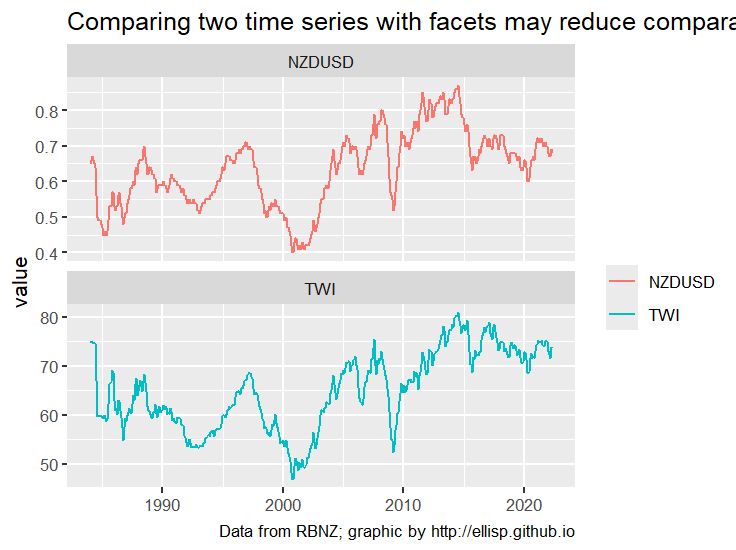
## facet versions ----
# Good facet plot
basicplot +
geom_line() +
facet_wrap(facets = ~variable, scales = "free_y", ncol = 1) +
ggtitle("Comparing two time series with facets may reduce comparability")
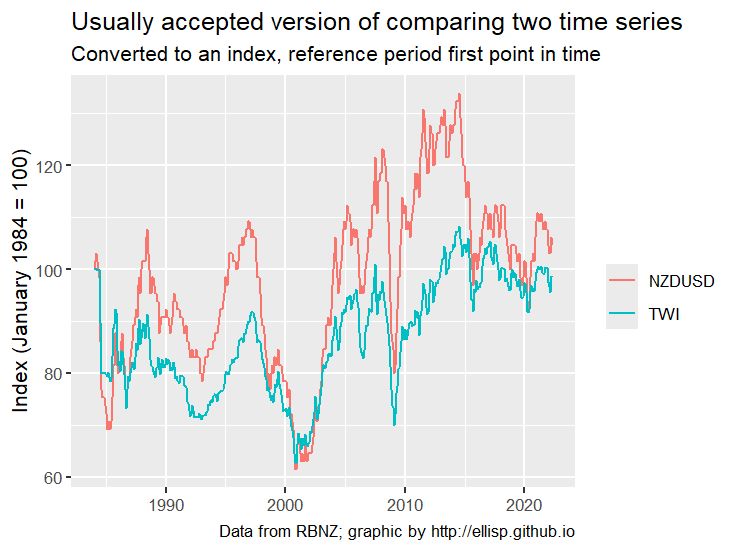
# Good index plot
basicplot +
stat_index(index.ref = 1) +
labs(y = "Index (January 1984 = 100)") +
ggtitle("Usually accepted version of comparing two time series",
subtitle = "Converted to an index, reference period first point in time"
)
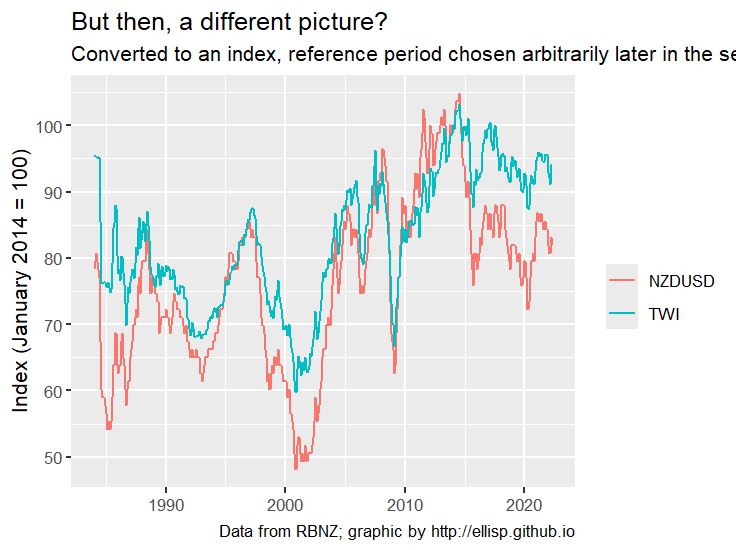
# Also a good index plot,
# but showing that arbitrary choices are still being made
basicplot +
stat_index(index.ref = 361) +
labs(y = "Index (January 2014 = 100)") +
ggtitle("But then, a different picture?",
subtitle = "Converted to an index, reference period chosen arbitrarily later in the series"
)
## connected scatterplot ----
forex %>%
mutate(label = ifelse(round(TimePeriod - floor(TimePeriod), 3) == 0.042, substring(TimePeriod, 1, 4), "")) %>%
ggplot(aes(x = NZDUSD, y = TWI, label = label, colour = TimePeriod)) +
geom_path() +
geom_text(fontface = "bold") +
scale_colour_gradientn("", colours = c("grey75", "darkblue")) +
ggtitle("Connected scatter plot may be the best analytically\nbut is intimidating to non-specialists")
@freerangestats.info on the dangers of dual-axes plots.
freerangestats.info/blog/2016/08...
Amazing how these codes still run even without a lockfile or a docker environment
#rstats #econsky #dataviz
Code in ALT
26.07.2025 16:17 — 👍 32 🔁 7 💬 4 📌 0
marginalizing over random effects with posterior::rvar()s
24.07.2025 20:54 — 👍 2 🔁 2 💬 1 📌 0
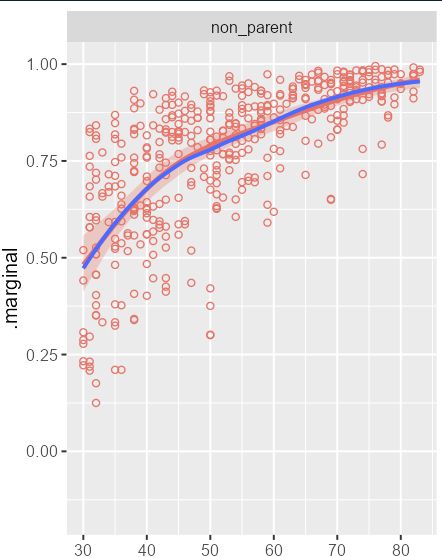
plot of the what i just said
yeah i fit a beta regression model with a 3-df spline on age and by-child random intercepts and computed marginal means by simulating and averaging 1000 children on each posterior draw... just to get the same thing as a LOESS smoooooth of the observations
24.07.2025 21:14 — 👍 32 🔁 2 💬 1 📌 1
(I interpreted this as "monotonic within groups", globally monotonic I don't have a clever solution for)
24.07.2025 05:03 — 👍 0 🔁 0 💬 0 📌 0
add indices to duplicates, something like this?
index_duplicates = \(x) {
x = mtfrm(x)
paste(x, ave(x, x, FUN = seq_along))
}
newmatch = \(x, table, ...) match(index_duplicates(x), index_duplicates(table), ...)
24.07.2025 00:59 — 👍 2 🔁 1 💬 1 📌 0
Lol. Maybe a burner account just for searches?
(I admit I'm only offering bad ideas atm)
23.07.2025 18:31 — 👍 2 🔁 0 💬 0 📌 0
All pookleblinky know is play music, lift weight, eat hot chip, write unsettling threads. You are now aware of the taste of your own mouth. Gendered in the way a peat bog is.
Trumpet, saxophone, guitar, banjo, bass, and squats
data, design, digital culture, birds
PhD student at University of Toronto working on visualization/HCI! Focus on visualization literacy 📊📖
they/he
Data scientist, #rstats developer, and educator.
Passionate about permaculture, automated systems and design (🐝🥚🍅🌻🍄🤖).
Professor of Technology and Economic Policy | Co-founder of causalscience.org | Associate Editor at Journal of Causal Inference | Executive Team at Academy of Management TIM Division
Just an ole t-test in a GLMM world. #statistics #healthcare #rstats
doer of data things at Yardhura Walani
I do #rstats, surveys, biostatistics, #IDSov
on Ngunnawal and Ngambri lands
not Indigenous, non-binary (they/them)
benharrap.com
www.dliebl.com
Professor of Statistics at Uni Bonn
From 🥨🏔️🍻-Land.
Economist socialized as nonparametric statistician
#statistics #statsky #econsky #rstats
Almost certainly one of the ecologists of all time.
AI/ML, biodiversity monitoring, viral emergence, open science, methodological anarchism
he/they
🧪 https://poisotlab.io/
📰 https://buttondown.email/ctrl-alt-tim
Butterflies and zebras and moonbeams and fairy tales. Literally wrote the book on carbon. Born 326.17. He/him. "Bleakly amusing." —A. Martine.
"The dad jokes will continue until morale improves." —Charlie Jane Anders.
Signal: eroston.87
Bloomberg Green
Tinkering with atoms, bits, and pixels at the University of Regensburg, Germany.
Yak shaver and award-winning procrastinator.
Also on https://hci.social/@RaphaelWimmer and Twitter
Statistician at University of Bristol | Bayesian, meta-analysis and evidence synthesis, #rstats
Linguistics PhD by day, open-source dev by night. I nerd out about: data viz, data management, R language internals, interop (R+Julia|Python), etc.
https://yjunechoe.github.io
https://github.com/yjunechoe
A diamond open-access journal for the InfoVis and HCI communities.
Also on Mastodon as @jovi@hci.social.
https://www.journalovi.org/
The Northwestern University Center for Human-Computer Interaction + Design brings together researchers and practitioners from across the University to study, design, and develop the future of human and computer interaction. https://www.hci.northwestern.edu
🌍 Spatial Data Scientist | Team Lead | 🌱 AgTech | PhD in Computational Ecology + MSc in GIS
#rstats developer | geospatial engineering | soil microbiome and crop health mapping | product development
https://github.com/BlasBenito - www.blasbenito.com
Editor-in-Chief 338Canada丨Rédacteur en chef Qc125丨Chroniqueur @ L'actualité, The Walrus & Politico Canada丨Co-host The Numbers podcast丨Prof astronomy & astrophysics丨Occasional cat pictures🤍丨📍Montréal
#rstats, maths, science, quirky stuff, and Aussie Rules football.
@matterofstats on Twitter
"Your data is not required to follow a well-defined distribution"
Healthcare data analyst.
Aspiring Munroist.