Trying out dplyr 1.2.0 | Crystal Lewis
Updating existing dplyr code in my workflow with new dplyr updates
dplyr 1.2.0 was released last week and since I use {dplyr} a lot in my work, I wanted to take some time to try some of the new functions.
This post provides some supplemental examples of the new functions, beyond what is provided in the new Posit materials.
#rstats
cghlewis.com/blog/dplyr_u...
09.02.2026 19:32 — 👍 84 🔁 29 💬 4 📌 3

dplyr 1.2.0
dplyr 1.2.0 fills in some important gaps in dplyr's API: we've added a new complement to `filter()` focused on dropping rows, and we've expanded the `case_when()` family with three new recoding and re...
dplyr 1.2.0 is out now and we are SO excited!
- `filter_out()` for dropping rows
- `recode_values()`, `replace_values()`, and `replace_when()` that join `case_when()` as a complete family of recoding/replacing tools
These are huge quality of life wins for #rstats!
tidyverse.org/blog/2026/02...
04.02.2026 11:39 — 👍 458 🔁 133 💬 12 📌 14


Are female economists treated differently than males in academic seminars?
These authors wanted to know whether gender shapes how scholars are treated when presenting research.
So they built a massive dataset of 2,000+ economics seminars, job talks, and conference presentations from 2019–2023...
03.02.2026 20:54 — 👍 410 🔁 190 💬 9 📌 39

Screenshot of the title page of an article published in the journal "Psychological Bulletin" titled: "Trust and Subjective Well-Being Across the Lifespan: A Multilevel Meta-Analysis of Cross-Sectional and Longitudinal Associations."
Trust in others and institutions predicts subjective well-being and vice versa. This makes me even more attuned to the costs of people and systems that undermine trust. The decay of trust as a public health issue. #PsychSciSky #AcademicSky #EduSky doi.org/10.1037/bul0...
16.01.2026 13:00 — 👍 68 🔁 23 💬 2 📌 0
YouGov poll Jan 9-11
d3nkl3psvxxpe9.cloudfront.net/documents/IC...
13.01.2026 14:18 — 👍 1 🔁 0 💬 0 📌 0
![During the initial 36 weeks of tirzepatide treatment, participants’ weight decreased and cardiometabolic parameters improved. After withdrawal of tirzepatide, from week 36 to week 88, the mean change in waist circumference increased by weight regain category (<25% weight regain, 0.8 cm; 95% CI, −1.0 to 2.6; 25% to <50%, 5.4 cm; 95% CI, 4.0-6.8; 50% to <75%, 10.1 cm; 95% CI, 8.9-11.3; ≥75%, 14.7 cm; 95% CI, 12.7-16.7; P < .001), as did systolic blood pressure (6.8 mm Hg [95% CI, 3.9-9.7], 7.3 mm Hg [95% CI, 4.8-9.8], 9.6 mm Hg [95% CI, 7.1-12.1], and 10.4 mm Hg [95% CI, 8.0-12.8], respectively; P = .002), non–high-density lipoprotein cholesterol (−0.4% [95% CI, −7.3 to 6.5], 1.6% [95% CI, −2.3 to 5.5], 8.4% [95% CI, 3.9-12.9], and 10.8% [95% CI, 5.3-16.3], respectively), hemoglobin A1c (0.14% [95% CI, 0.06-0.22], 0.15% [95% CI, 0.09-0.21], 0.27% [95% CI, 0.21-0.33], and 0.35% [95% CI, 0.29-0.41], respectively; P < .001), and fasting insulin (−4.0% [95% CI, −20.7 to 12.7], 15.4% [95% CI, 2.3-28.5], 46.2% [95% CI, 29.5-62.9], and 26.3% [95% CI, 9.6-43.0], respectively).](https://cdn.bsky.app/img/feed_thumbnail/plain/did:plc:73aicoale2mqwrap63rdzwep/bafkreihnzkk6zi543zbfxprq7lg5fjkwkvtxo54yjfnva6puadub7h5e6a@jpeg)
During the initial 36 weeks of tirzepatide treatment, participants’ weight decreased and cardiometabolic parameters improved. After withdrawal of tirzepatide, from week 36 to week 88, the mean change in waist circumference increased by weight regain category (<25% weight regain, 0.8 cm; 95% CI, −1.0 to 2.6; 25% to <50%, 5.4 cm; 95% CI, 4.0-6.8; 50% to <75%, 10.1 cm; 95% CI, 8.9-11.3; ≥75%, 14.7 cm; 95% CI, 12.7-16.7; P < .001), as did systolic blood pressure (6.8 mm Hg [95% CI, 3.9-9.7], 7.3 mm Hg [95% CI, 4.8-9.8], 9.6 mm Hg [95% CI, 7.1-12.1], and 10.4 mm Hg [95% CI, 8.0-12.8], respectively; P = .002), non–high-density lipoprotein cholesterol (−0.4% [95% CI, −7.3 to 6.5], 1.6% [95% CI, −2.3 to 5.5], 8.4% [95% CI, 3.9-12.9], and 10.8% [95% CI, 5.3-16.3], respectively), hemoglobin A1c (0.14% [95% CI, 0.06-0.22], 0.15% [95% CI, 0.09-0.21], 0.27% [95% CI, 0.21-0.33], and 0.35% [95% CI, 0.29-0.41], respectively; P < .001), and fasting insulin (−4.0% [95% CI, −20.7 to 12.7], 15.4% [95% CI, 2.3-28.5], 46.2% [95% CI, 29.5-62.9], and 26.3% [95% CI, 9.6-43.0], respectively).
I know, I get that there are formatting standards, etc. etc. but there has got to be a better way of communicating results in a world where scientific publishing is primarily digital than what's happening in this paragraph...
09.01.2026 00:18 — 👍 88 🔁 7 💬 16 📌 3

🚨 Now out in Psych Science 🚨
We report an adversarial collaboration (with @donandrewmoore.bsky.social) testing whether overconfidence is genuinely a trait
The paper was led by Jabin Binnendyk & Sophia Li (who is fantastic and on the job market!) Free copy here: journals.sagepub.com/eprint/7JIYS...
17.12.2025 17:17 — 👍 127 🔁 41 💬 8 📌 6
great font choice to match the dataviz
16.11.2025 15:10 — 👍 1 🔁 0 💬 0 📌 0
this is the Inclusion of Other in the Self Scale, often used in social psychology! doi.org/10.1037/0022...
29.10.2025 17:15 — 👍 1 🔁 0 💬 0 📌 0
eh, It wasn't that high up... and 4-year-olds can take it. 😜
But if you're looking for other good moments in the paper... I also recommend reading the acknowledgments closely.
15.10.2025 11:49 — 👍 85 🔁 20 💬 2 📌 2

love spotting new and fun ways how researchers show group differences. here is one from Walker et al., 2025 showing transparent, overlayed density plots with circled data labels for the mean
doi.org/10.1016/j.co...
13.10.2025 22:15 — 👍 3 🔁 0 💬 0 📌 0

ggplot2 4.0.0
A new major version of ggplot2 has been released on CRAN. Find out what is new here.
I am beyond excited to announce that ggplot2 4.0.0 has just landed on CRAN.
It's not every day we have a new major #ggplot2 release but it is a fitting 18 year birthday present for the package.
Get an overview of the release in this blog post and be on the lookout for more in-depth posts #rstats
11.09.2025 11:20 — 👍 850 🔁 281 💬 9 📌 51
The psych job market may not be dead... but it is gravely injured 😬 So far it's looking like the Trump administration's attacks on higher ed/research are going to have more than 2x the impact on the job market as the covid-19 pandemic. #psychjobs #neurojobs #academicjobs
03.09.2025 18:27 — 👍 165 🔁 73 💬 14 📌 10

Models as Prediction Machines: How to Convert Confusing Coefficients into Clear Quantities
Abstract
Psychological researchers usually make sense of regression models by interpreting coefficient estimates directly. This works well enough for simple linear models, but is more challenging for more complex models with, for example, categorical variables, interactions, non-linearities, and hierarchical structures. Here, we introduce an alternative approach to making sense of statistical models. The central idea is to abstract away from the mechanics of estimation, and to treat models as “counterfactual prediction machines,” which are subsequently queried to estimate quantities and conduct tests that matter substantively. This workflow is model-agnostic; it can be applied in a consistent fashion to draw causal or descriptive inference from a wide range of models. We illustrate how to implement this workflow with the marginaleffects package, which supports over 100 different classes of models in R and Python, and present two worked examples. These examples show how the workflow can be applied across designs (e.g., observational study, randomized experiment) to answer different research questions (e.g., associations, causal effects, effect heterogeneity) while facing various challenges (e.g., controlling for confounders in a flexible manner, modelling ordinal outcomes, and interpreting non-linear models).

Figure illustrating model predictions. On the X-axis the predictor, annual gross income in Euro. On the Y-axis the outcome, predicted life satisfaction. A solid line marks the curve of predictions on which individual data points are marked as model-implied outcomes at incomes of interest. Comparing two such predictions gives us a comparison. We can also fit a tangent to the line of predictions, which illustrates the slope at any given point of the curve.

A figure illustrating various ways to include age as a predictor in a model. On the x-axis age (predictor), on the y-axis the outcome (model-implied importance of friends, including confidence intervals).
Illustrated are
1. age as a categorical predictor, resultings in the predictions bouncing around a lot with wide confidence intervals
2. age as a linear predictor, which forces a straight line through the data points that has a very tight confidence band and
3. age splines, which lies somewhere in between as it smoothly follows the data but has more uncertainty than the straight line.
Ever stared at a table of regression coefficients & wondered what you're doing with your life?
Very excited to share this gentle introduction to another way of making sense of statistical models (w @vincentab.bsky.social)
Preprint: doi.org/10.31234/osf...
Website: j-rohrer.github.io/marginal-psy...
25.08.2025 11:49 — 👍 1007 🔁 288 💬 47 📌 22
great color choice
07.08.2025 13:27 — 👍 1 🔁 0 💬 0 📌 0
Paper on effortful leisure led by @aidanvcampbell.bsky.social with @minzlicht.bsky.social and myself now out! (www.nature.com/articles/s44...). Effort is aversive and often avoided, yet here we find effortful tasks and activities are also more meaningful, and effortful leisure is no less enjoyable.
24.07.2025 17:30 — 👍 21 🔁 5 💬 1 📌 0
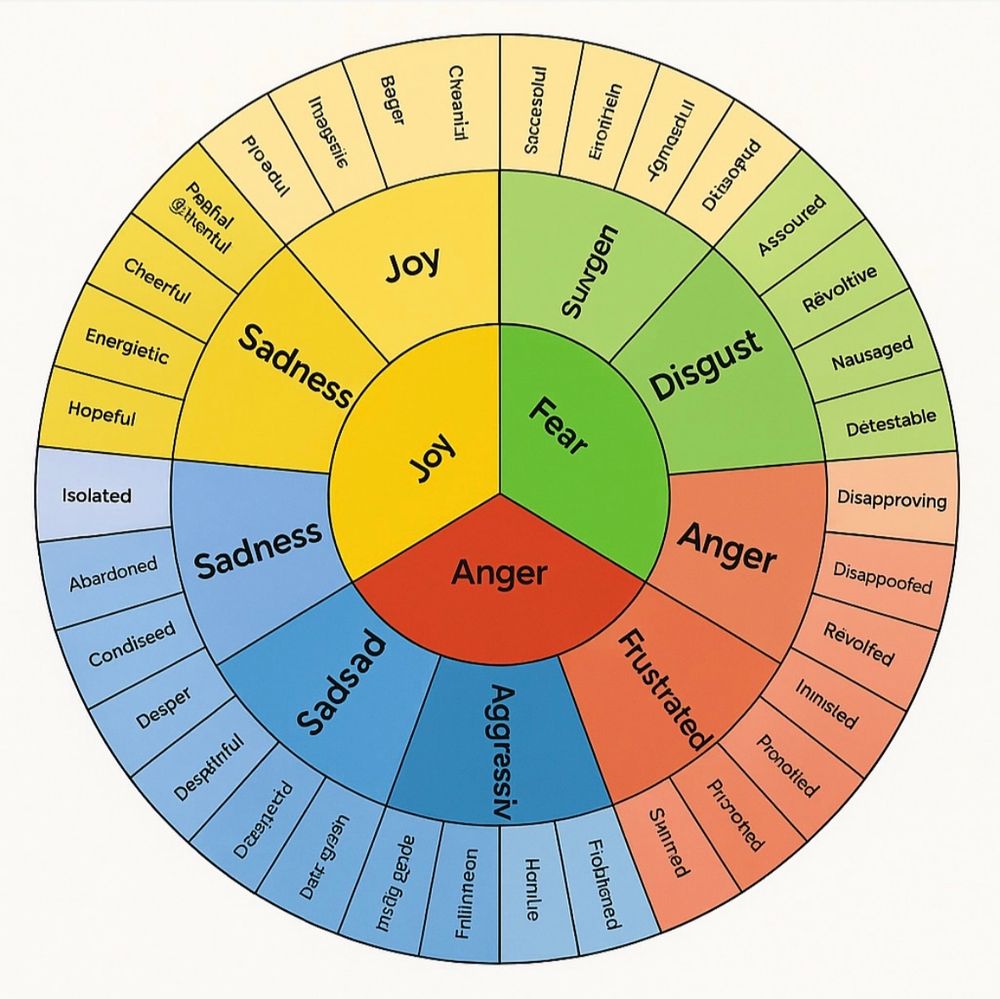
emotion wheel starting with "joy, fear, anger" in the center and then lapsing into gibberish
a friend of mine shared this ai-generated "emotion wheel" and unfortunately i have been laughing my ass off at it for like 15 minutes now. today i am feeling Fnliinneon
05.06.2025 14:46 — 👍 5167 🔁 1330 💬 241 📌 1290

Believing in Spirits and Life After Death Is Common Around the World
Belief in an afterlife, God and spirits in nature is widespread globally. Older adults are more likely than younger adults to believe in God. Pew Research Center.
Majorities of adults in most countries surveyed say that animals can have spirits or spiritual energies, including:
- 83% of adults in Hindu-majority India
- 81% in Muslim-majority Turkey
- 76% in Christian-majority Argentina, and
- 70% in Jewish-majority Israel. www.pewresearch.org/...
08.05.2025 12:00 — 👍 5 🔁 1 💬 2 📌 1
"In January 2023, just two months after OpenAI launched ChatGPT, a survey of 1,000 college students found that nearly 90 percent of them had used the chatbot to help with homework assignments. "
While everyone gets mad about college students using AI...I am extremely curious about this very vague survey cite in the NY Mag story
07.05.2025 14:29 — 👍 447 🔁 71 💬 19 📌 20
Today is #EarthDay a day for Americans to come together to protect and celebrate nature.
Despite the divisiveness of contemporary climate debates, Americans agree: protecting nature is important. (1/3)
22.04.2025 17:36 — 👍 2 🔁 1 💬 1 📌 0
Have young voters really abandoned the Democrats?
by Caroline Soler, Brian Schaffner, and Stephen Ansolabehere
did young voters support Trump in 2024? this is a notoriously difficult group to poll but the major election surveys indicate that Trump lost among all but young white men. tufts-pol.medium.com/have-young-v...
17.04.2025 17:59 — 👍 25 🔁 8 💬 0 📌 1
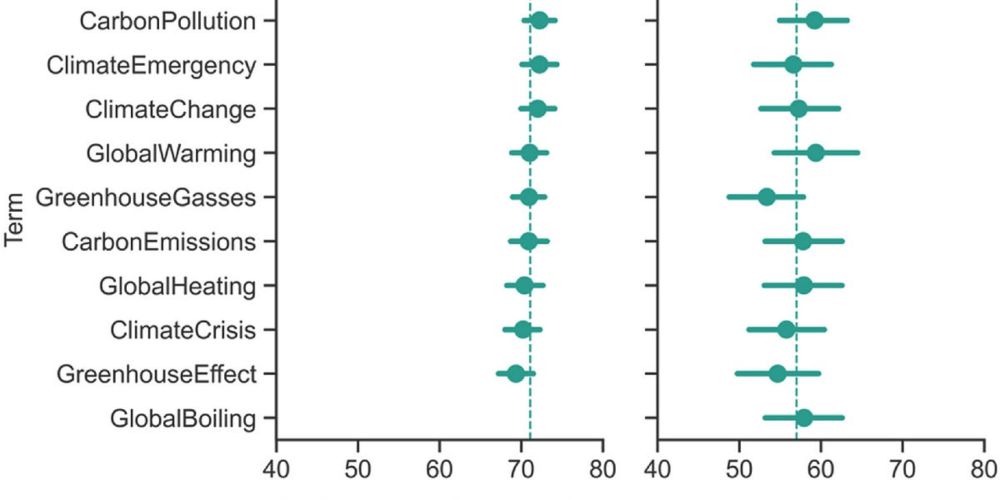
Climate Terminology Does Not Matter
Our new paper finds that swapping out one climate term for another does not meaningfully change people’s stated commitment to fight climate change
Climate Terminology Does Not Matter
Across tens of thousands of participants in two large-scale experiments, we found that labeling climate change in different ways had no effect on their stated willingness to act.
jayvanbavellab.substack.com/p/climate-te...
via @dgoldwert.bsky.social
07.04.2025 17:46 — 👍 125 🔁 43 💬 8 📌 6

a scatterplot of 500,000 points that is basically a black rectangle
dataviz is my passion
02.04.2025 13:27 — 👍 207 🔁 14 💬 20 📌 5
I was curious to see how academic articles in (Political) Communication and Political Science are being shared on X vs. Bluesky.
I find: In 2024, academic articles in our field seem to be clearly more shared on X. But by 2025, Bluesky is catching up fast.
Short 🧵 1/n
27.03.2025 09:59 — 👍 233 🔁 80 💬 7 📌 10
Elon Musk recently claimed that "empathy is the fundamental weakness of western civilization", pushing us towards "civilizational suicide". I recently wrote a piece in Broadview Magazine explaining why I disagree: broadview.org/elon-musk-em...
#empathy #scicomm
25.03.2025 19:09 — 👍 6 🔁 4 💬 0 📌 0

Shows two overlapping distributions of compassion, empathy efficacy, emotion sharing, personal distress, and perspective taking. On the left, those low in Single Item Trait Empathy, who don't consider themselves an empathic person, are lower in all but distress. On the right, those high in SITE who think of themselves as empathic have right-shifted distributions of empathy, but not distress. Underscores that lay conceptions of empathy tend not to include personal distress as a key component.
Received news that my paper with @minzlicht.bsky.social was accepted at Personality and Social Psychology Bulletin🥳. In it, we examine how trait measures of empathy predict everyday state empathy, and what this teaches us about how we measure and experience empathy: osf.io/preprints/ps... #empathy
26.03.2025 00:53 — 👍 34 🔁 9 💬 1 📌 1
Happy to share this new piece on bridging differences in the US, just published in @thefulcrum-us.bsky.social and inspired by the report on #socialconnection recently released by @moreincommonus.bsky.social
#bridging #intergroupcontact
thefulcrum.us/bridging-com...
25.03.2025 14:14 — 👍 5 🔁 1 💬 0 📌 0
Americans want to connect across lines of difference (race/ethnicity, class, religion, politics) but lack the opportunity. New huge research on social connection (2-year study of >6,000 Americans, national, regional, quant + qual).
Happy to play a role on this project and celebrate its launch!
18.03.2025 14:58 — 👍 4 🔁 1 💬 0 📌 0
@fuhred.bsky.social deserves all the credit for this ShinyApp 👏 see our paper at doi.org/10.1177/2515...
20.02.2025 18:54 — 👍 15 🔁 2 💬 0 📌 0

An invite for Southeast Asian Social and Personality Psychologists gathering at SPSP conference in Denver. Detail: 2/20/25, 7pm at Assembly Hall Bar in Hyatt Regency
Are you a Southeast Asian social-personality psychologist attending #SPSP2025 in Denver? We are getting together on Thursday 2/20, 7pm local time at Hyatt Regency’s Assembly Hall Bar! RSVP on the Whova app in the meetup section (or just come through)! SEASAPP is back for our 5th year reunion!!
10.02.2025 02:05 — 👍 31 🔁 19 💬 1 📌 0
Berkeley professor, former Secretary of Labor. Co-founder of @inequalitymedia.bsky.social and @imcivicaction.bsky.social.
Substack: http://robertreich.substack.com
Buy my new book: https://sites.prh.com/reich
Visit my website: https://rbreich.com/
Asst Prof, UC Berkeley, Political Science. Study protests, stats & race: 1/ Agenda Seeding http://j.mp/agenda-seeding 2/ Race as a Bundle of Sticks http://j.mp/bundle-of
she/her
postdoc @ UvA (AISSR | Politics of Diversity) 🇳🇱
politics & gender • CEE • EU
mtplk.eu
psycholinguist by training, now working in public health. L1: American English (~Philly). any pronouns, they/she if that's too hard.
i do not post as my worksona. posts are mine and not my employer's.
https://linktr.ee/colorlessgrey
The Journal of Race, Ethnicity, and Politics is the official journal of the Race, Ethnicity, and Politics section of the American Political Science Association, published by @cambup-polsci.cambridge.org.
Prof of Ed Psych & Learning Sciences at UNC-CH | Scholar, speaker, consultant studying how people learn in the digital world | APA & AERA Fellow | Journal & Handbook Editor | Book Author | Views are my own. https://linktr.ee/jeffgreene
Political Science PhD @IPZ_ch
https://ct-p.github.io
Words, data, code. Senior data journalist with @today.yougov.com. Host of the French history podcast The Siècle (@thesiecle.com).
Founder & PI @aial.ie. Assistant Professor of AI, School of Computer Science & Statistics, @tcddublin.bsky.social
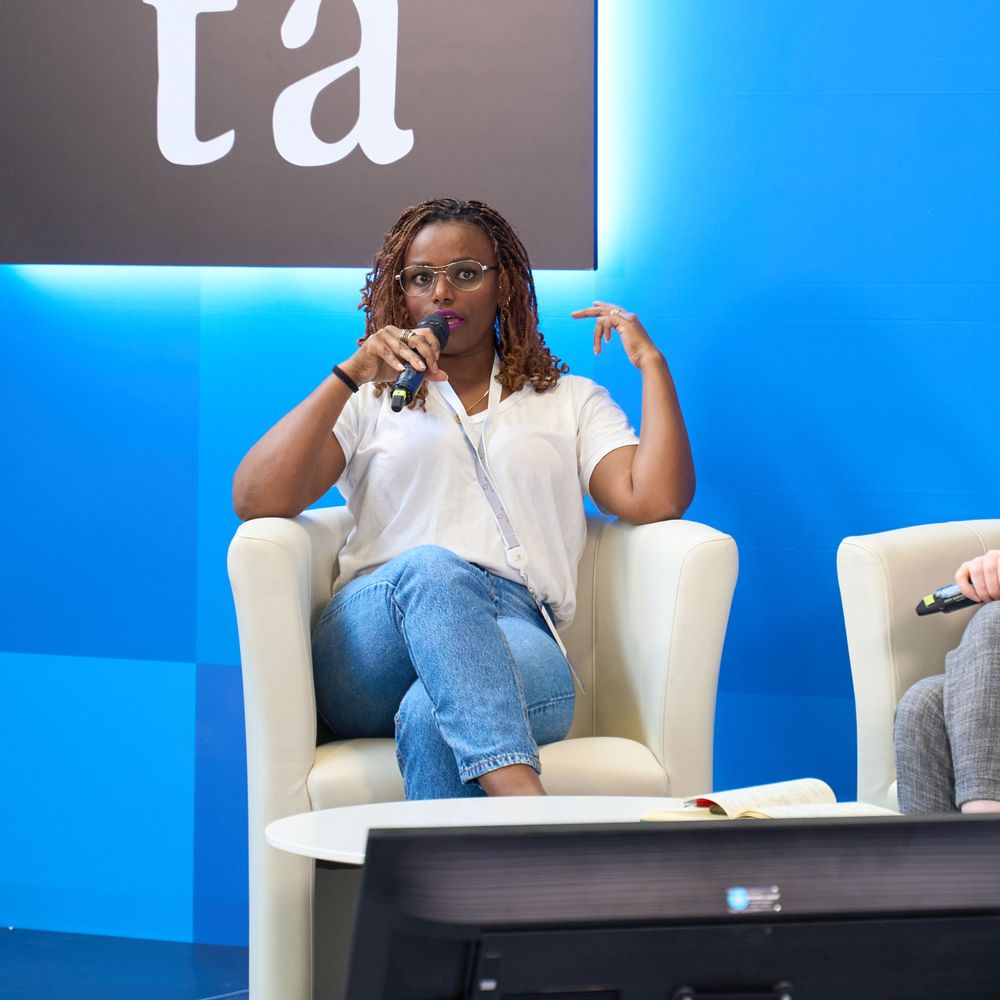
AI accountability, AI audits & evaluation, critical data studies. Cognitive scientist by training. Ethiopian in Ireland. She/her
Postdoc at Stanford Doerr School of Sustainability | Applied Math PhD
Political scientist at the University of Utah. Public policy, political institutions, media and politics
Tracking the latest polls in US politics
Public policy professor at the Hobby School. Enthusiastic about food, dogs, travel, and research. I write books about many failures of local democracy. Bad opinions my own.
Cultural evolution of the mind | Assistant Professor @ University of Chicago, Booth School of Business & Faculty Affiliate of UChicago Data Science Institute | He/his | https://joshuaconradjackson.com
ABC News Polling Director, former Postie, feminist, library fan, BRCA mutant. Nats! Caps! Terps! Kill them with kindness and methodological rigor. she/her signal: emgusk.04
Polling data archivist. Posting mostly about old polling and sometimes new politics. Also like reading about food, art, and quirky history. Oh, and I make collages.
www.etsy.com/shop/FataMorganaCollage
Researcher in Political Communication with the @rpa-cs-uva.bsky.social at @ascor.bsky.social | PhD in Political Science @sspunil.bsky.social | Elite Incivility, Marginalization, Violence
website: chiaravargiu.com
Associate Professor at the University of Amsterdam, ASCoR @ascor.bsky.social
Dark politics, Political communication & psychology, Negative campaigns, Leader personality
Editor-in-Chief at EJPR @ejprjournal.bsky.social
http://www.alessandro-nai.com
Assoc. Prof. Learning Sciences, Harvard GSE. Study learning in early childhood using computational modeling & empirical studies. Speaking for self only. She/her
polling aggregation and data-driven journalism from the former research team of fivethirtyeight. https://www.FiftyPlusOne.news