What Americans die from and the causes of death the US media reports on.
4 stacked bar charts. showing in short that while heart diseases and cancer constitutes 55% of the causes of death, they receive about 7% of the media coverages. Homicide is under 1% but receives between 42% and 52%. Terrorisme barely registers in the causes of death, but gets between 11% and 18%.
The first stacked bar is causes of death in the US in 2023
Heart diseases 29%
Cancer 26%
Accidents 9.5%
Stroke 6.9%
Lower respiratory diseases (6.2%)
Alzheimer's disease (4.8%)
Diabetes (4.0%)
Kidney failure (2.4%)
Liver disease (2.2%)
Suicide (2.1%)
COVID-19 (2.1%)
Influenza/Pneumonia (1.9%)
Drug overdose (1.8%)
Homicide (<1%)
Terrorism (<0.001%)
Media coverage of these causes of death in 2023 in...
New York Times
Heart disease (2.8%)
Cancer (4.1%)
Accidents (9.7%)
Suicide (3.8%)
COVID-19 (5.3%)
Drug overdose (7.5%)
Homicide (42%)
Terrorism (18%)
Washington Post
Heart disease (2.9%)
Cancer (4.7%)
Accidents (5.9%)
Suicide (3.3%)
COVID-19 (7.9%)
Drug overdose (9.5%)
Homicide (46%)
Terrorism (12%)
Fox News
Heart disease (2.3%)
Cancer (3.8%)
Accidents (6.1%)
Suicide (4.1%)
COVID-19 (6.0%)
Drug overdose (9.8%)
Homicide (52%)
Terrorism (11%)
Note: Based on the share of causes of death in the US and the share of mentions for each of the causes in the New York Times, the Washington Post and Fox News. All values are normalized to 100%, so the shares are relative to all deaths caused by the 12 most common causes + drug overdoses, homicides and terrorism. These causes account for more than 75% of deaths in the US.
A "media mention" is a published article in one of the outlets which mentions the cause (e.g. "influenza) or related keywords (e.g. "flu") least twice.
Data sources: Media mentions from Media Cloud (2025); deaths data from the US CDC (2025) and Global Terrorism Index.
Fox News
This is really one of the best charts by @ourworldindata.org 📊
Amazing how much research and work goes into creating a chart like this. And it's such a good insight into society.
08.10.2025 16:17 — 👍 44 🔁 16 💬 1 📌 3
So it turns out posting to social media is a PIA. But I'll get there. This piece is captioned: Still fun, 30 years later. #MyMatrescenceProject #Histogram #DataViz #Datavis #DataHumanism
09.09.2025 03:59 — 👍 1 🔁 0 💬 0 📌 0

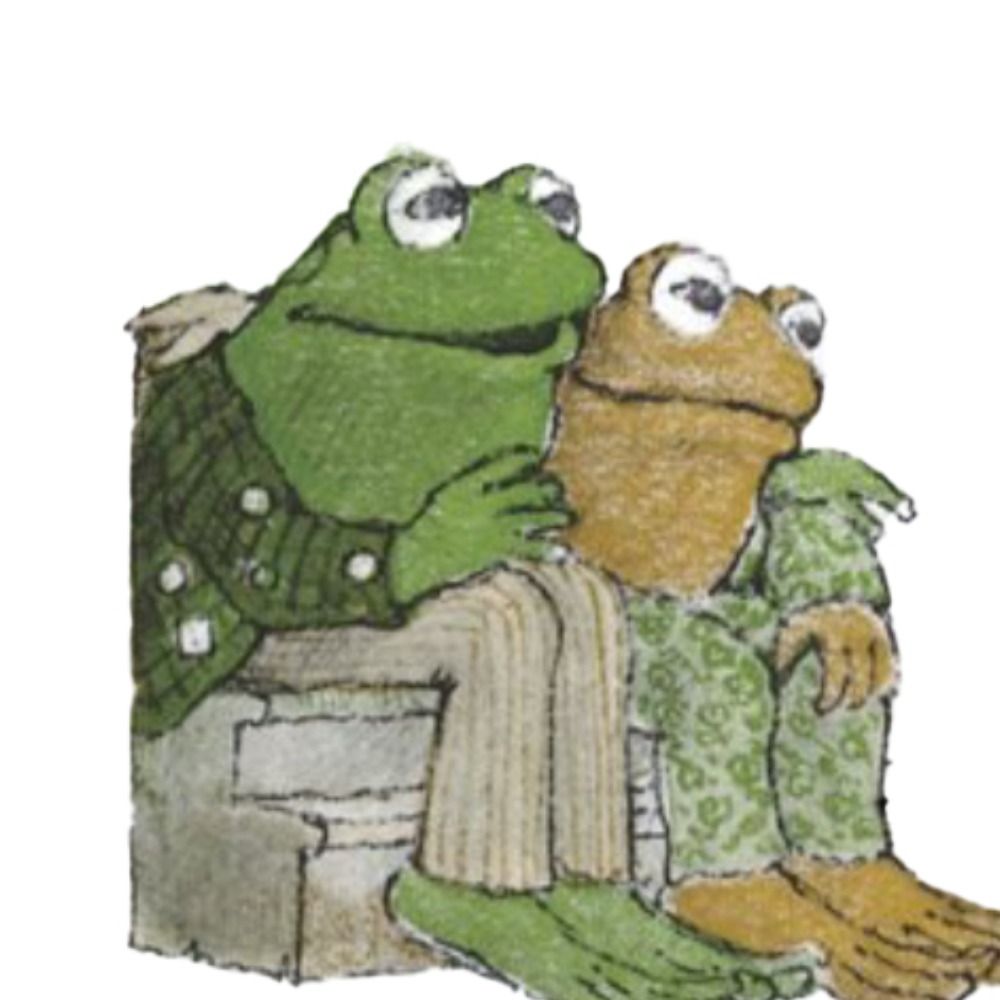
Toad is buried under the covers in bed.
From "Spring"
In *Frog and Toad Are Friends*
Toad went back into the house. He got into bed and pulled the covers over his head again.
08.09.2025 22:37 — 👍 800 🔁 202 💬 5 📌 42

Calvin: I'M FILLING OUT A READER SURVEY FOR CHEWING MAGAZINE.
SEE, THEY ASKED HOW MUCH MONEY I SPEND ON GUM EACH WEEK, SO I WROTE, '500.' FOR MY AGE, I PUT 43; AND WHEN THEY ASKED WHAT MY AVORITE FLAVOR IS, I WROTE GARLIC/ CURRY.
Hobbes: THIS MAGAZINE SHOULD HAVE SOME AMUSING ADS SOON
Calvin: I LOVE MESSING WITH DATA.
There’s a Calvin in every dataset.
29.08.2025 03:39 — 👍 28 🔁 10 💬 1 📌 0
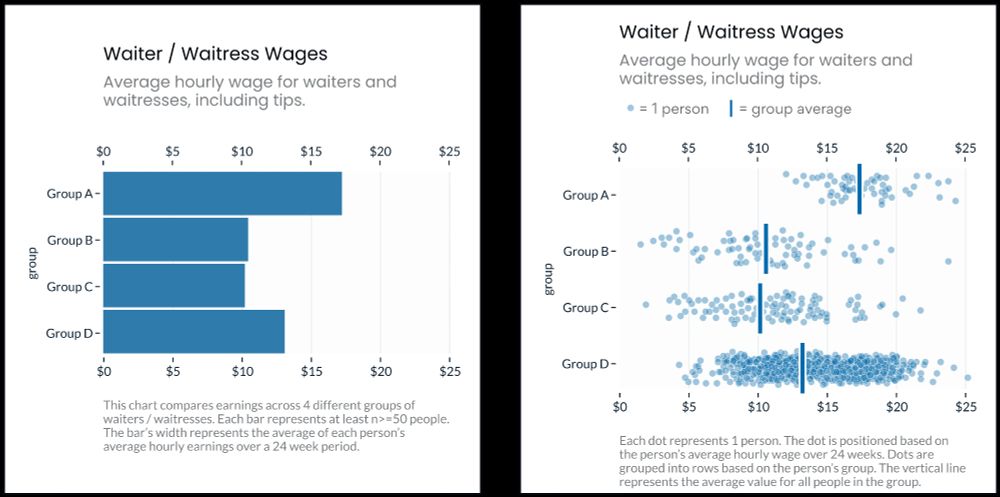
"In Experiment 1 we found that Jitter Plots reduced personal attribution (i.e. blame) by 7.0 points, relative to Bar Charts (p=0.0011)." @elibryan.bsky.social 3iap.com/dispersion-d...
30.07.2025 19:00 — 👍 11 🔁 3 💬 1 📌 0
I have to sing it, even in my head. #MyMatrescenceProject #Histogram #DataViz #Datavis #DataHumanism
26.07.2025 04:31 — 👍 1 🔁 0 💬 0 📌 0
Cosleeping saved us, but gosh it's chilly. #MyMatrescenceProject #TimeSeries #DataViz #Datavis #DataHumanism
23.07.2025 03:21 — 👍 0 🔁 0 💬 0 📌 0
I did/am doing a thing and then wrote about the doing!
15.07.2025 21:47 — 👍 3 🔁 0 💬 0 📌 0
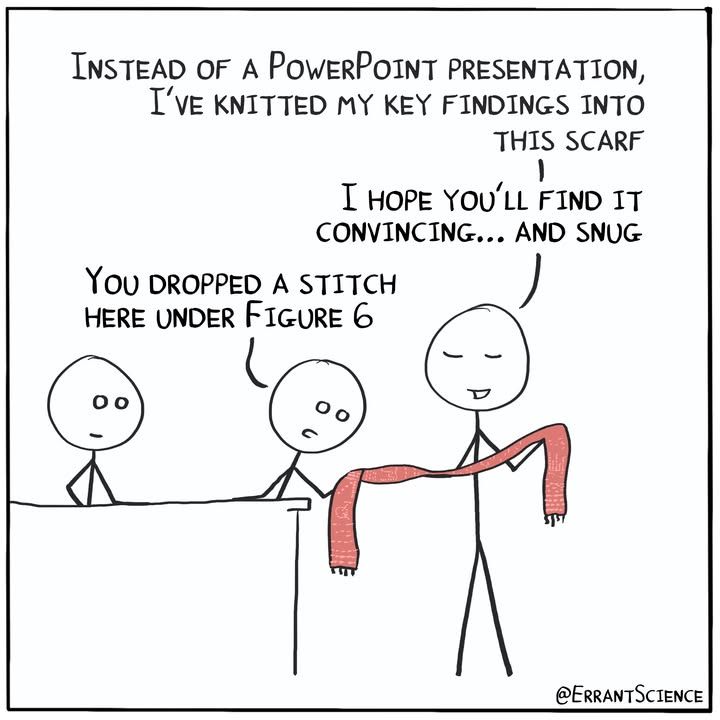
I really appreciate an alternative presentation but that's no excuse for sloppy work 🧣🧶
08.07.2025 11:59 — 👍 29 🔁 5 💬 0 📌 0
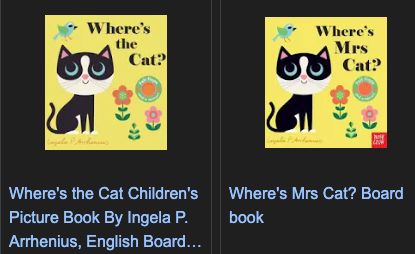
Screenshot of google image search results for "Ingela P. Arrhenius cat", showing two almost identical children's book covers with an illustration of a cat. One book is titled "Where's the cat?" and the other is titled "Where's Mrs Cat?"
I love it! It brings to mind Ingela Arrhenius' animal lift the flap books, which were originally non-gendered but are inexplicably released in some markets (*cough*Australia*cough*) with gendered honorifics.
08.07.2025 04:51 — 👍 3 🔁 0 💬 1 📌 0
I love this so much. Unsurprisingly kangaroo trends she/her. I'd love to see an Australian version of this dataset...
08.07.2025 04:02 — 👍 8 🔁 1 💬 0 📌 0
I think it's useful! I am doing a lot of work generating word document survey analysis summaries using quarto which has been a real headache. Being able to look at other approaches is really helpful!
06.07.2025 03:20 — 👍 1 🔁 0 💬 0 📌 0
My most extreme act of nesting behaviour. #MyMatrescenceProject #TimeSeries #DataViz #Datavis #DataHumanism
30.06.2025 05:31 — 👍 4 🔁 0 💬 0 📌 0
There's some things you just shouldn't say to people you don't know (or at all, honestly). #MyMatrescenceProject #Pictogram #DataViz #Datavis #DataHumanism
25.06.2025 02:43 — 👍 0 🔁 0 💬 0 📌 0

Show Your Stripes
Visualising how the climate has changed for every country across the globe
It's #ShowYourStripes day. Despite the freezing cold the last week or so, this has felt like a very warm dry winter and that's not a trend that brings me joy. #DataViz
20.06.2025 21:35 — 👍 4 🔁 0 💬 0 📌 0
I'd never washed literally every towel in the house in one day before. #MyMatrescenceProject #BarChart #DataViz #Datavis #DataHumanism
20.06.2025 12:09 — 👍 2 🔁 0 💬 0 📌 0
A simplification, but a useful one. #MyMatrescenceProject #DataViz #Datavis #DataHumanism
18.06.2025 04:08 — 👍 0 🔁 0 💬 0 📌 0
We’re thrilled to unveil the winners of the 2024 #IIBAwards! These works stand out not just for their mastery of #dataviz and storytelling, but for their impact and innovation. See the winners: www.informationisbeautifulawards.com/news/680-ann...
14.06.2025 21:40 — 👍 40 🔁 10 💬 1 📌 1
Thanks for a great presentation :) it made my day to get to watch something super relevant to what I'm working on at the moment during my standard working hours (unheard of!)
10.06.2025 11:45 — 👍 1 🔁 0 💬 1 📌 0
Too precious to waste. #MyMatrescenceProject #DataViz #Datavis #DataHumanism
05.06.2025 06:08 — 👍 0 🔁 0 💬 0 📌 0
There's no words for how deep this fear runs. #MyMatrescenceProject #SparkLine #TimeSeries #DataViz #Datavis #DataHumanism
03.06.2025 00:58 — 👍 0 🔁 0 💬 0 📌 0
We're two for two on purple projectile vomit at midnight. #MyMatrescenceProject #PieChart #SmallMultiples #DataViz #Datavis #DataHumanism
31.05.2025 01:26 — 👍 2 🔁 0 💬 0 📌 0
There would be a pop of the highlight for each language and would draw more attention to languages with most bfrequent letters that aren't E (or would be a wall of bright green Es 😅)
22.05.2025 12:15 — 👍 1 🔁 0 💬 0 📌 0
I like the experiment and the colour version more but maybe the colours could use some tweaking? It looks like the colours are an encoding of frequency across the entire dataset - maybe if the scale was frequency across the individual language the colour would add more to the visualisation?
22.05.2025 12:15 — 👍 1 🔁 0 💬 1 📌 0
A good night's sleep really does change everything. #MyMatrescenceProject #DivergentBarChart #DataViz #Datavis #DataHumanism
21.05.2025 23:56 — 👍 3 🔁 0 💬 0 📌 0
It was a super pleasant surprise to stumble on this the other night while hashtag surfing and get to read a whole set of Australian themed visualisations ❤️
17.05.2025 05:04 — 👍 1 🔁 0 💬 1 📌 0
I used to love getting in the car with a playlist and snacks. #MyMatrescenceProject #DivergentBarChart #DataViz #Datavis #DataHumanism
17.05.2025 04:56 — 👍 3 🔁 0 💬 0 📌 0
I guess you could call this a set of interdependent variables. #MyMatrescenceProject #PostpartumMentalHealth #TimeSeries #DataViz #Datavis #DataHumanism
14.05.2025 07:33 — 👍 2 🔁 0 💬 0 📌 0
It's a cliché for a reason. #MyMatrescenceProject #Love #DataViz #Datavis #DataHumanism
12.05.2025 20:49 — 👍 2 🔁 0 💬 0 📌 0
Scribbler and data journalist. https://joshnicholas.com
ft senior reporter. south london nationalist. articles with my byline get posted automagically on @cook.report
DataVis journalist @ The National (Abu Dhabi, UAE)
I dedicate —some of— my working hours to painting charts and maps.
I created this account because the datavis community moved here, and I miss them.
https://www.behance.net/isaacarroyov
…although it’s mostly Rob these days.
Official account of the Terry Pratchett Estate. The first place for Discworld, Good Omens & Terry Pratchett news.
Our union works collectively to ensure workers are safe at work & have fair rights, pay & conditions.
The official Bluesky account of Last Week Tonight with John Oliver. youtube.com/lastweektonight
Writer of games, books, TV, film and comics. Co-Director of Narrativia. Cat Spooner. Flibbertigibbet. https://rhiannapratchett.com
Annual Workshop Organised by the Monash Business Analytics Team.
29th-30th September 2025
wombat2025.numbat.space
Former Washington Post columnist
Writing: pbump.net
Book: "The Aftermath"
Newsletter: https://howtoreadthisch.art
Email: philip@pbump.com
Signal: pbump.11
An anti-MAHA movement. Because every person deserves not only cake but also a life full of the things that cake represents, including joy, creativity, and care.
Our motto: Let US eat cake!
An account full of daily silly science cartoons
Drawn by @drmceep.bsky.social
Data Analyst mainly posting work-arounds for #PowerBI #PowerQuery #Excel etc, but also posting about #DataVisualisation in general.
#ThirdSector #Charity #DataViz.
I'm an #ActualPerson – my pseudonym is due to my job's social media policy
Cozy random passages from Arnold Lobel's Frog and Toad books. Posts auto-delete.
Asst Prof @ University of Washington Information School // PhD in English from WashU in St. Louis
I’m interested in books, data, social media, and digital humanities.
They call me "Eyre Jordan" on the bball court 🏀
https://melaniewalsh.org/
National Tertiary Education Union (NTEU) in the ACT. The union for all higher education staff.
Authorised by Dr Lachlan Clohesy, NTEU ACT Division, Acton.
Surprised historian, not surprised eels.
Doctor of medieval history, talking’ about eels, history, and maps. Spaniel mourner. Alt-text artist.
I draw custom maps on commission:
https://surprisedeelmaps.com/
Support me here: patreon.com/SurprisedEel
Data Scientist @ ourworldindata.org
Interested in environmental change, biodiversity and health.
Data Visualisation Manager at a health think tank 👩💻 Mostly talk about data, #dataviz, #opendata, #maps, #python and #data4good 📈 Into cycling, yoga, sourdough, puns and more. Views my own.
Also active on Mastodon + Linkedin