Congratulations to @d1egoramo5.bsky.social Winner of the 2025 AGU GeoHealth Data Visualization Competition for his work, “Examining Household Air Conditioning Usage in Southern California.”
24.11.2025 03:03 — 👍 0 🔁 1 💬 1 📌 0
I'm seeing claims that progress was made at #COP30, but it really wasn't. Each passing year with no fossil fuel phaseout comes at great opportunity cost as we further burn through the vanishing carbon budget that remains for averting dangerous warming. See my commentary: michaelmann.net/bad-cop/
23.11.2025 20:55 — 👍 272 🔁 112 💬 15 📌 8
welcome to where the skies are bluer, Joe! ;)
18.10.2025 01:39 — 👍 1 🔁 0 💬 1 📌 0
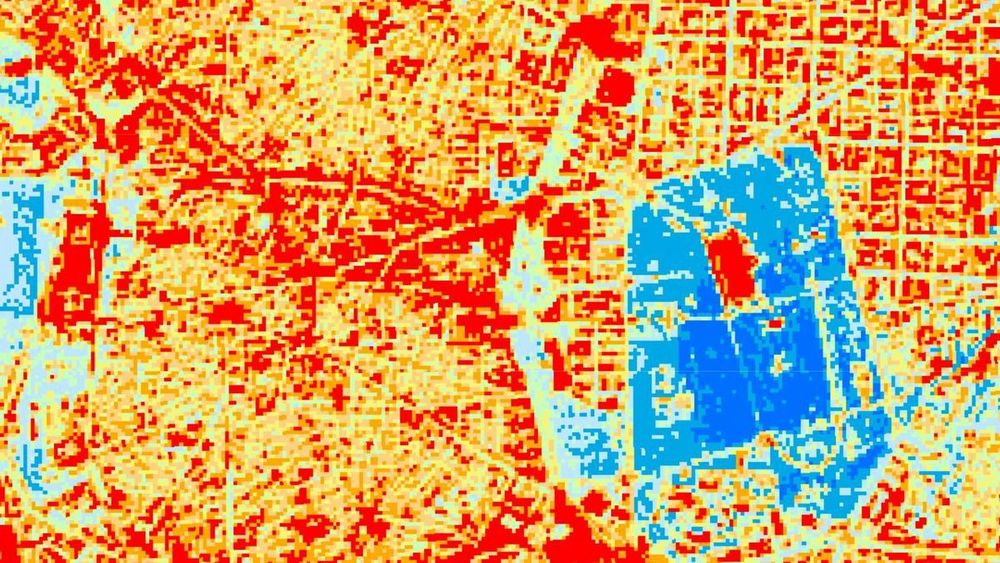
El mapa de calor de Madrid muestra claramente que, exceptuando el Retiro (que está cerrado), el resto de la ciudad es un puto infierno por falta de árboles.
Ala, a seguir votando a Almeida.
07.07.2025 15:23 — 👍 279 🔁 143 💬 15 📌 7
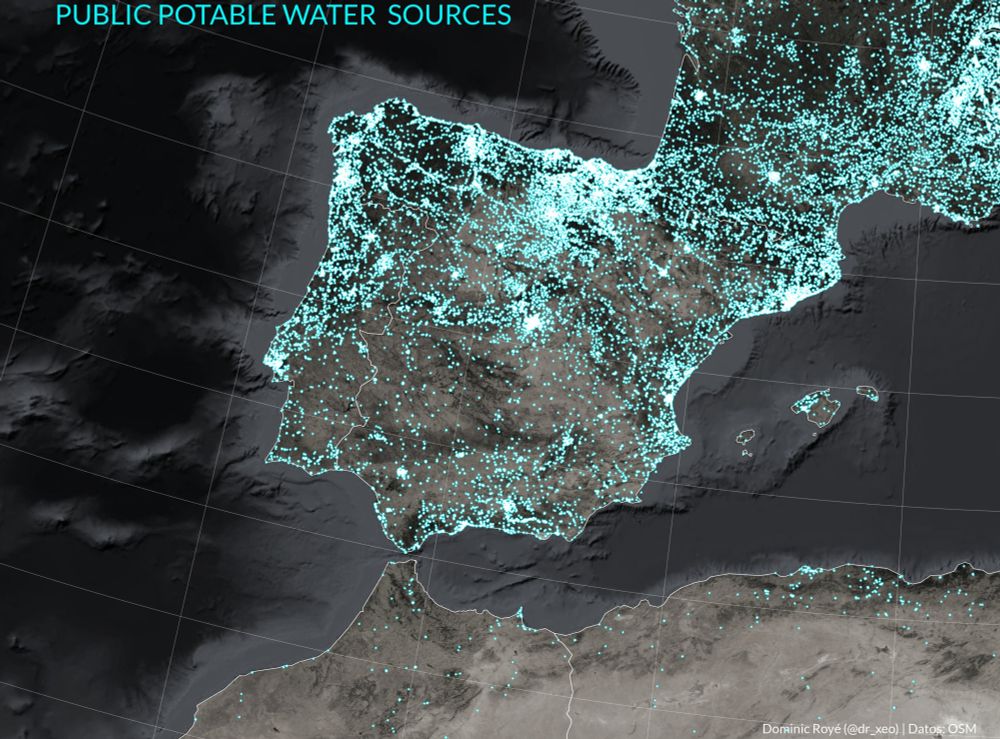
In the face of the #heatwave on the Iberian Peninsula, I have updated the map of drinking water sources based on data from @openstreetmap.bsky.social. #rstats #dataviz
01.07.2025 11:12 — 👍 65 🔁 19 💬 1 📌 2
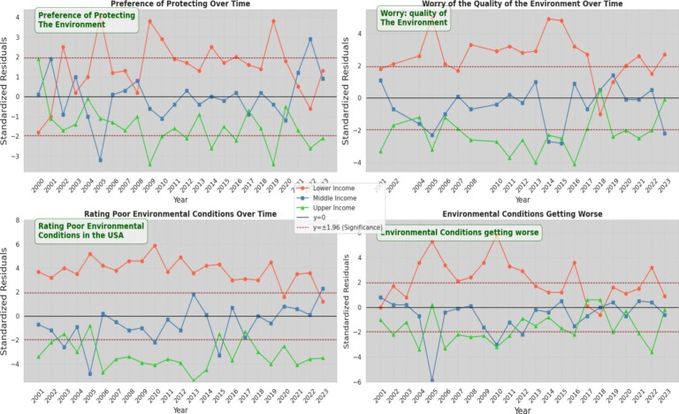
This fascinating new research overturns longstanding assumptions. It finds that lower-income groups are more concerned about the environment and prefer environmental protection over economic growth, compared to higher-income groups. Data from the USA.
02.06.2025 10:55 — 👍 907 🔁 342 💬 37 📌 43
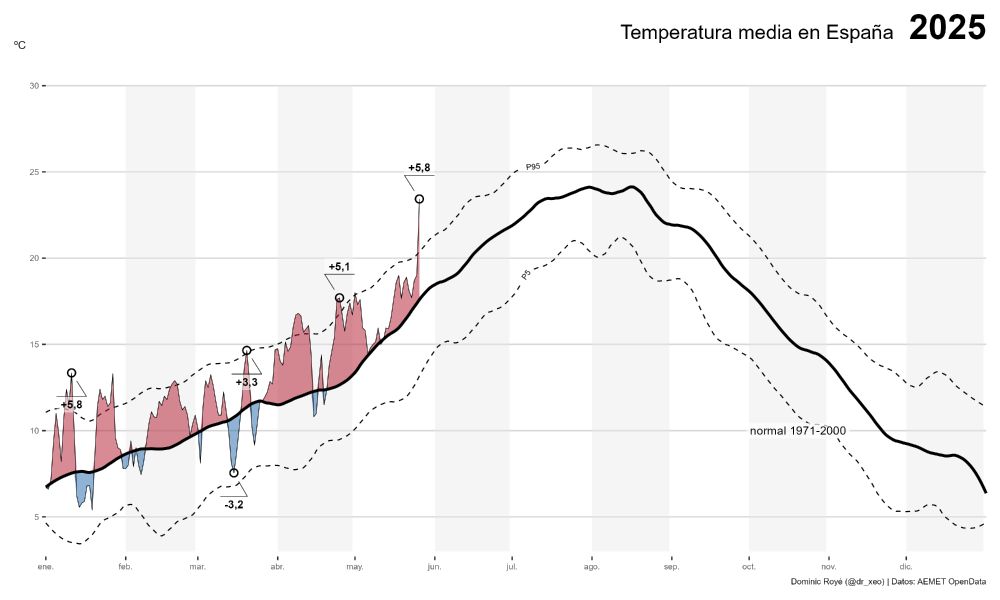
Esta es la imagen actual, de momento llevamos 114 días con anomalías positivas y 25 días extremos en España en 2025. Después del episodio de altas temperaturas veremos cómo quedará. 🥵
#dataviz #meteo
28.05.2025 15:00 — 👍 48 🔁 36 💬 0 📌 0
What is the climate probability of a summer day with a maximum temperature of more than 25ºC? You can see it throughout the year. Central Europe reaches at most 50%, while the south, Spain, Portugal, and Italy, for example, achieve 100% on many days.
#climate #meteo #dataviz
12.05.2025 08:41 — 👍 28 🔁 12 💬 3 📌 0
Thanks to everybody who chimed in!
I arrived at the conclusion that (1) there's a lot of interesting stuff about interactions and (2) the figure I was looking for does not exist.
So, I made it myself! Here's a simple illustration of how to control for confounding in interactions:>
11.05.2025 05:34 — 👍 1133 🔁 273 💬 68 📌 18
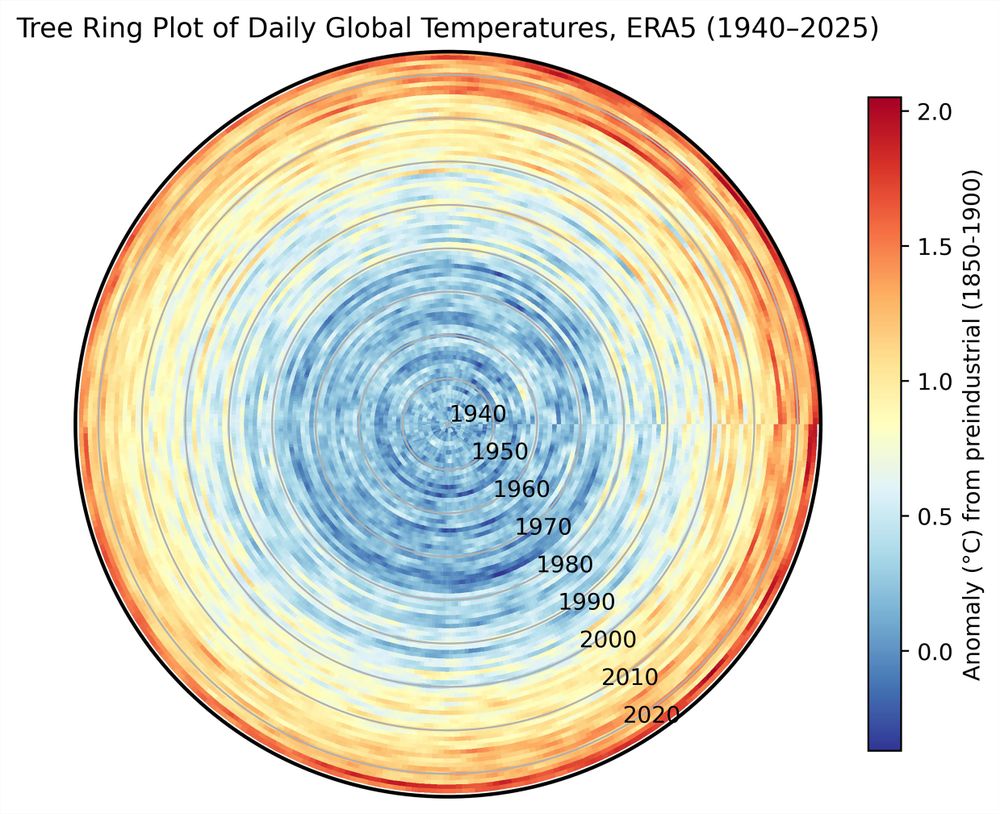
Introducing the "tree ring plot": a new way to visualize global surface temperatures. Each ring is a year, and each colored cell represents a day in global average temperatures (compared to a 1850-1900 preindustrial baseline).
25.04.2025 21:33 — 👍 305 🔁 107 💬 7 📌 4
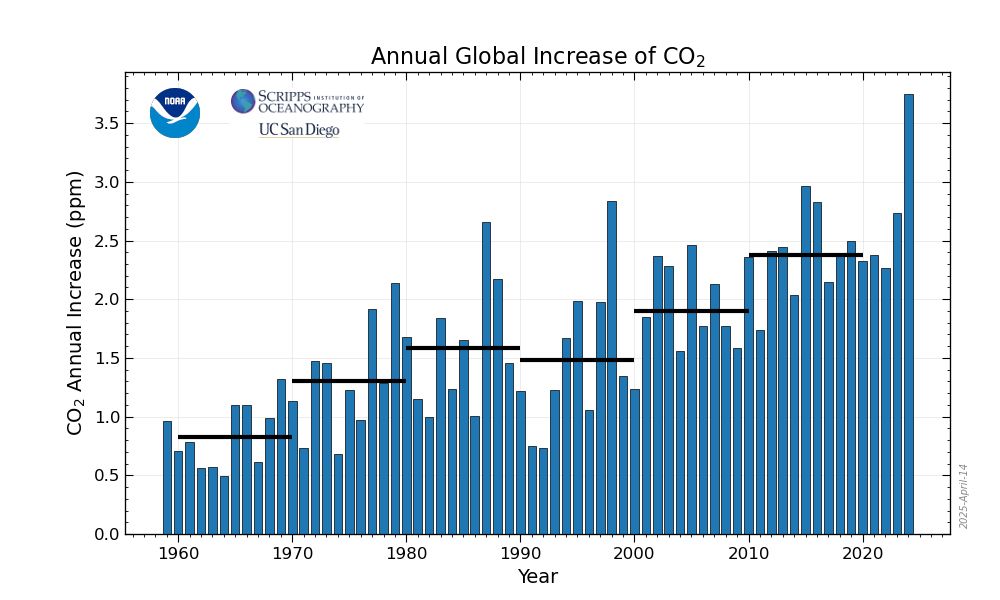
Bar graph with blue bars showing annual global increase of CO2. 2024 had the highest growth of any year back to 1959.
You might be thinking, "Tom, 3.75 ppm means nothing to me. What does that actually mean?" Here's some context:
A growth of CO2 of 3.75ppm from January 2024 to December 2024 was the largest annual increase on record and 25% larger than the previous record set in 2015. 2/7
24.04.2025 19:55 — 👍 6 🔁 1 💬 1 📌 0
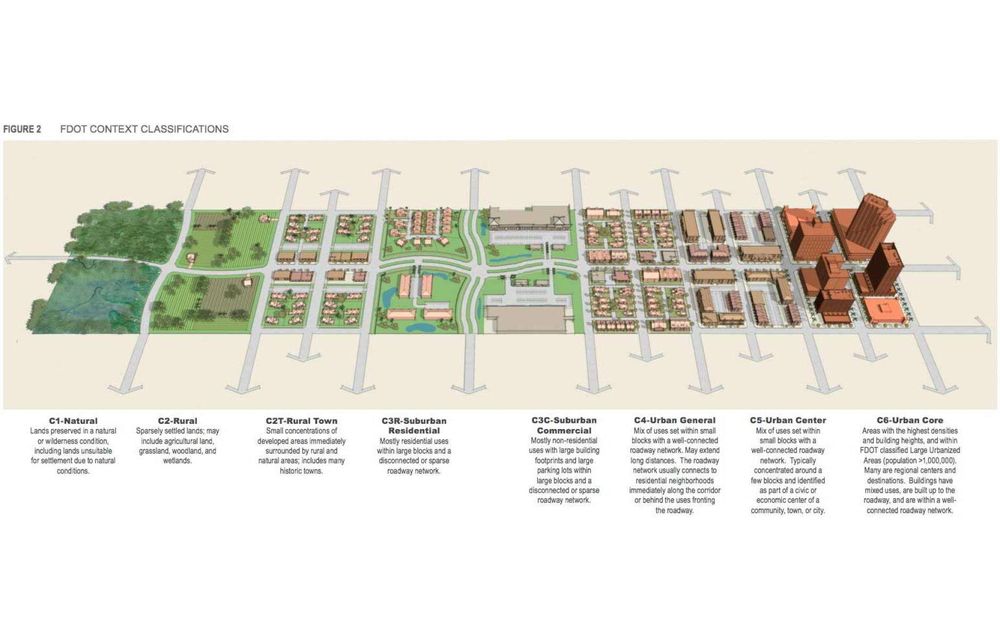
Classifying human development
A general classification of human development from natural areas right up to urban cores
While linear and general in nature it still informs urban geography, planning, and spatial planning
06.03.2025 22:24 — 👍 6 🔁 3 💬 1 📌 1
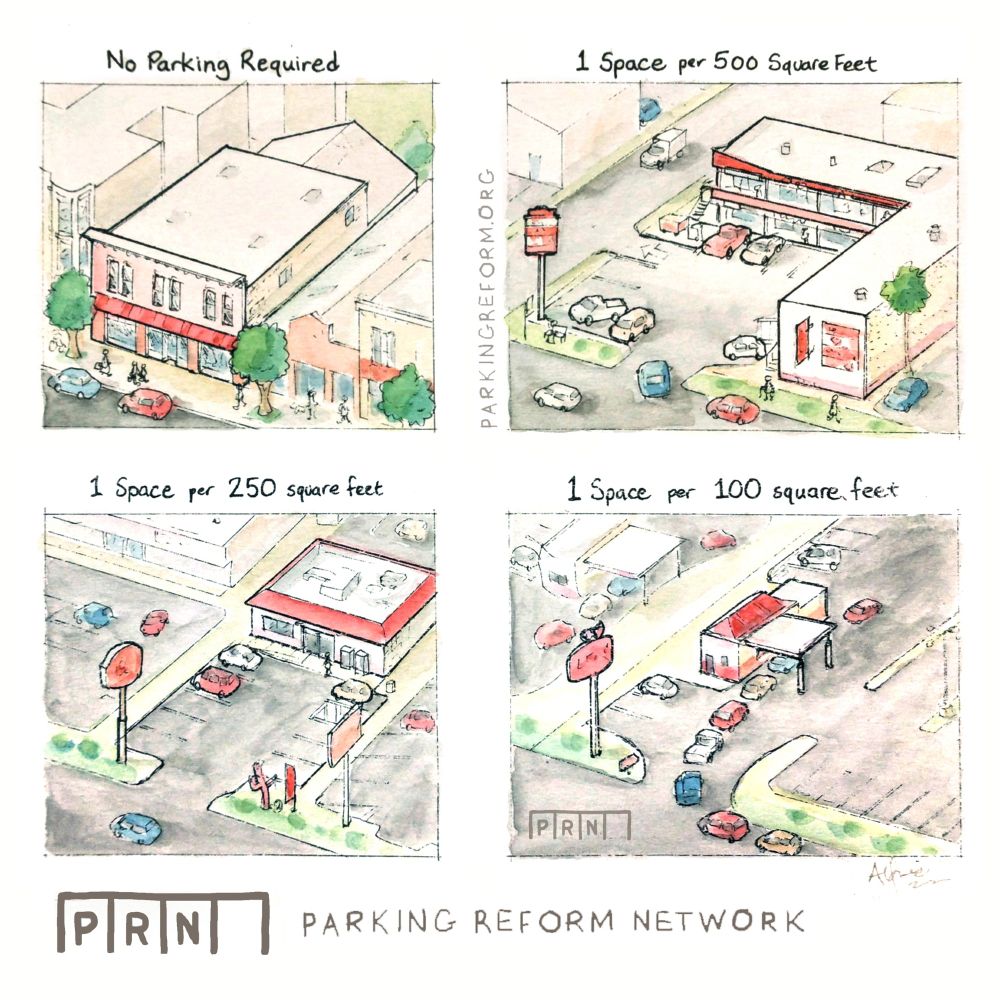
An illustration showing the impact of parking requirements on land use. From left to right, the image depicts a gradient of increasing parking mandates: 'No Parking Required' allows for dense, walkable development; '1 Space per 500 Square Feet' introduces some parking; '1 Space per 250 Square Feet' adds more parking lots; and '1 Space per 100 Square Feet' results in sprawling, car-centric infrastructure with large parking lots dominating the landscape. The logo 'PRN' and 'PARKING REFORM NETWORK' are visible at the bottom.
“The right to have access to every building in the city by private motorcar, in an age when everyone possesses such a vehicle, is actually the right to destroy the city.”
- Lewis Mumford
10.03.2025 20:04 — 👍 1283 🔁 365 💬 13 📌 11
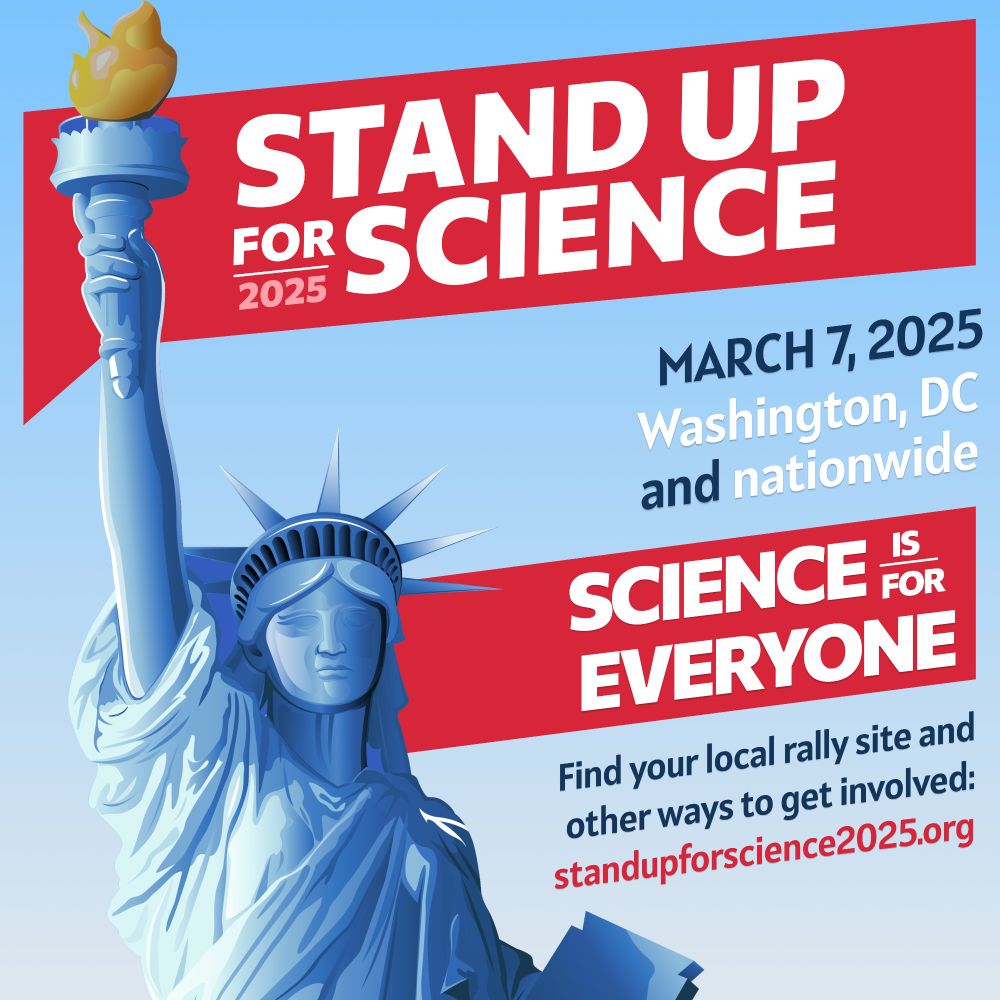
Stand up for science flyer, happening on March 7th in DC & nationwide with more information at www.standupforscience2025.org
WHERE WILL YOU BE TOMORROW?
06.03.2025 15:11 — 👍 797 🔁 343 💬 35 📌 83
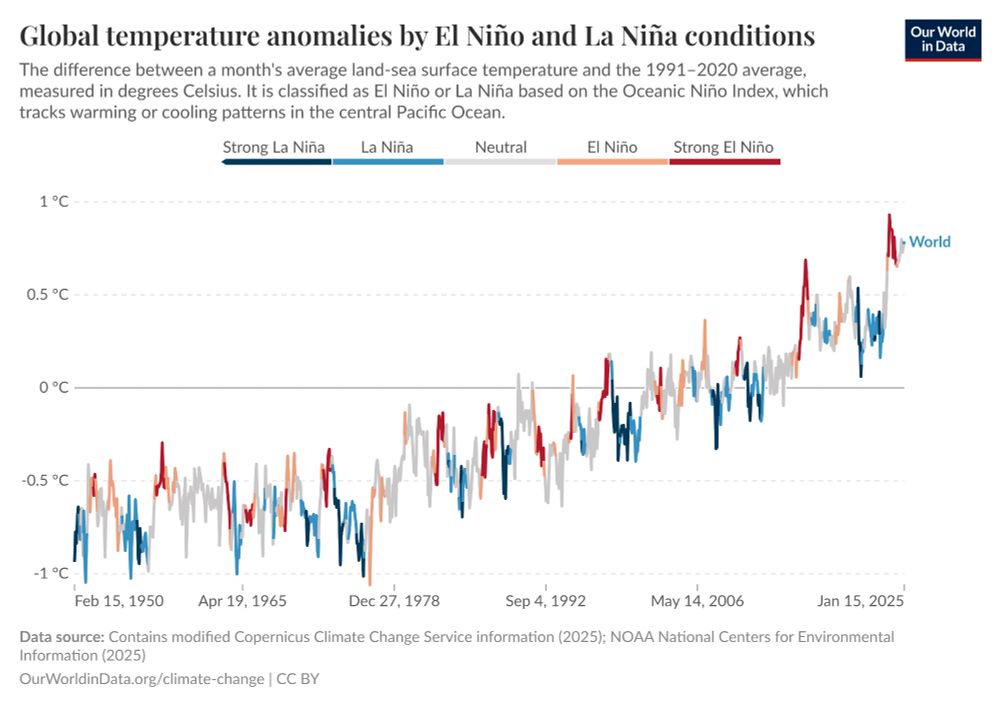
🌡 New on @ourworldindata.org:
We added global temperature anomaly charts *coloured by El Nino / La Nina periods*.
Today's "cool" years are warmer than "warm" years of the past.
[New article and charts by my colleague Veronika Samborska and I: ourworldindata.org/global-tempe... ]
03.03.2025 15:20 — 👍 424 🔁 176 💬 9 📌 6
i declare myself a fan of public libraries, and all they represent 🤗
01.03.2025 21:27 — 👍 3 🔁 2 💬 0 📌 0
american masculinity is so amazing. caring about clothes as a man apparently makes you "gay" but our position on geopolitics totally depends on whether you wear a suit
01.03.2025 08:03 — 👍 50587 🔁 7561 💬 810 📌 225
🚨 #NOAA is essential for weather forecasting, climate research, and public safety.
AGU stands with the scientific community in urging Congress to protect and strengthen NOAA, not dismantle it.
Our economy, environment, and safety depend on it.
28.02.2025 12:30 — 👍 407 🔁 156 💬 9 📌 5
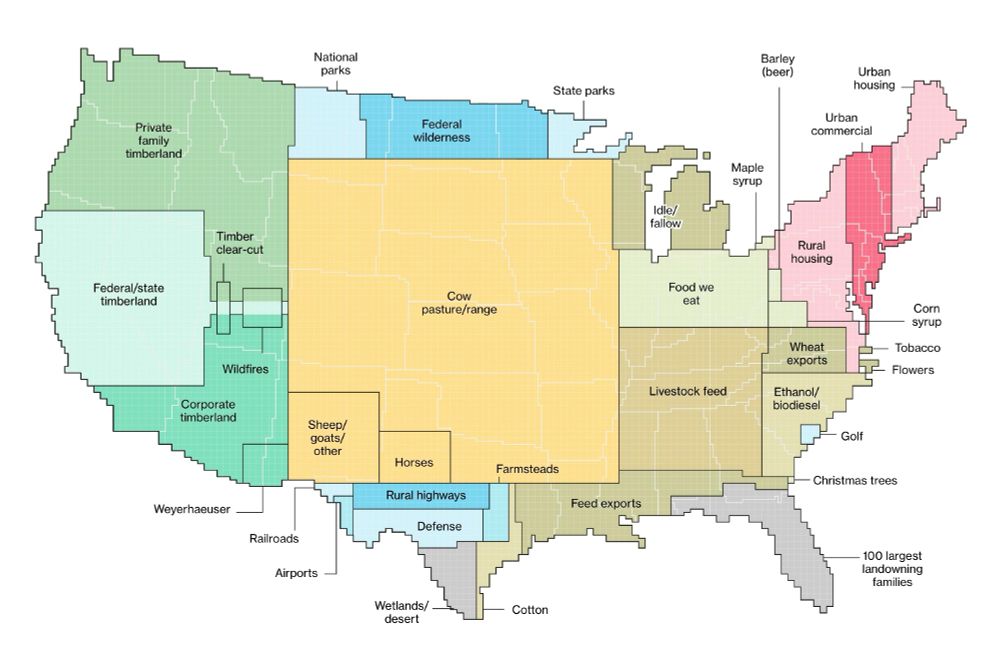
This is a cartogram map of the United States depicting land use by different categories. The map distorts state shapes to represent proportional land usage. Key land use types include cow pasture/range (covering much of the central U.S.), private and federal timberland in the Pacific Northwest, corporate timberland in the Southeast, and urban housing/commercial areas in the Northeast. Other categories include agriculture (livestock feed, wheat exports, ethanol/biodiesel, cotton), protected lands (national parks, federal wilderness, state parks), and infrastructure (railroads, airports, highways). Additional specialized land uses include wildfires, golf courses, Christmas tree farms, and maple syrup production.
I think about this map a lot.
www.bloomberg.com/graphics/201...
27.02.2025 17:26 — 👍 2744 🔁 656 💬 162 📌 140
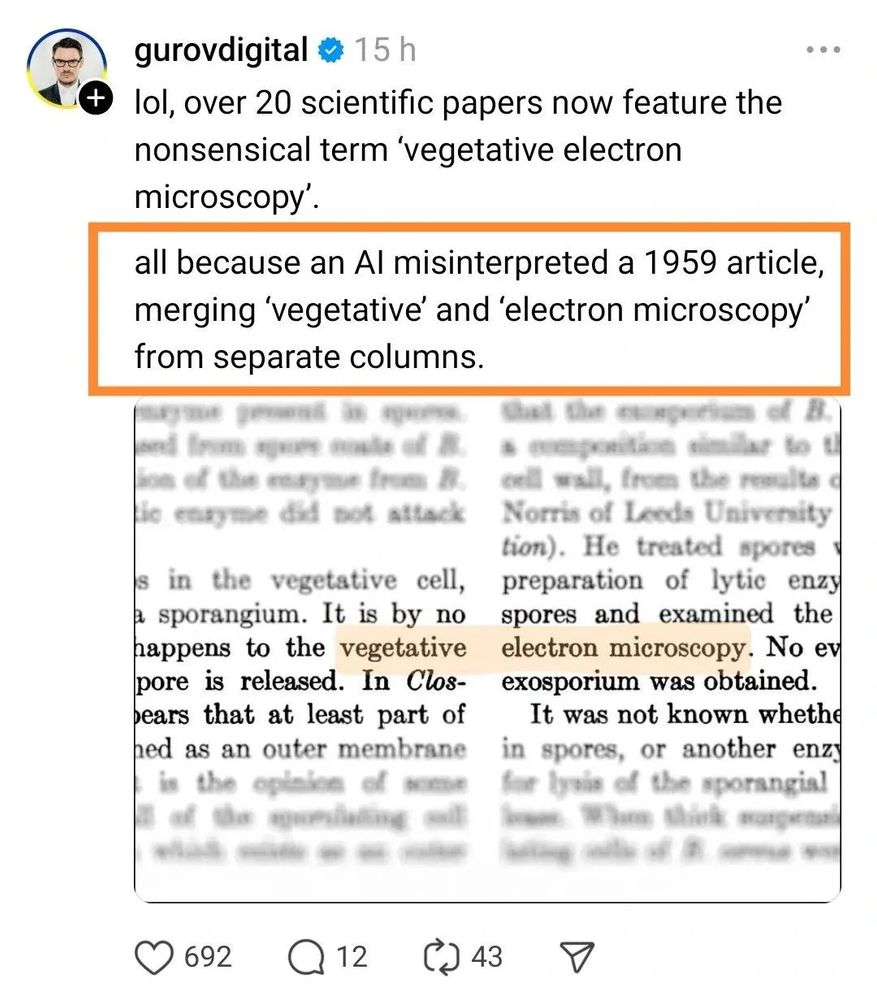
Facepalm, AI...
20.02.2025 16:06 — 👍 102 🔁 25 💬 6 📌 0
Lets put this in "business" terms.
If you have an arm of your firms that costs $50k to operate, but it produces $500k in profits, and you cut it, you don't save $50k, you lose $450k.
By cutting billions, they have the potential to reduce future growth by the trillions.
19.02.2025 15:35 — 👍 334 🔁 105 💬 9 📌 2
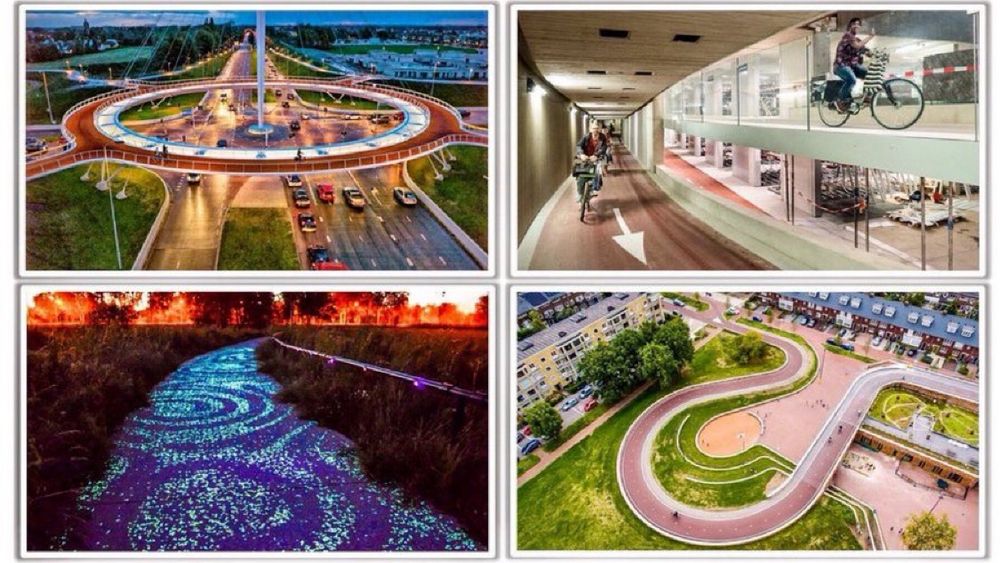
Images of Dutch cycling infrastructure
IMPORTANT: The Dutch invest €595 million annually on urban biking, resulting in €19 BILLION saved in public health care costs alone. That’s how smart govts do the math on investing in better mobility.
Let’s be clear— it wastes public money to NOT do it.
#CityMakingMath HT @modacitylife.bsky.social
18.11.2024 21:59 — 👍 925 🔁 299 💬 22 📌 31
Now is the time for a genuinely non-evil, open-source, privacy-focused ecosystem -- operating system, email and other basic services, mobile OS, phone -- that would allow consumers to entirely defect from the enshittifying exploitation systems controlled by today's increasingly fascist tech bros.
13.02.2025 05:59 — 👍 648 🔁 109 💬 28 📌 12
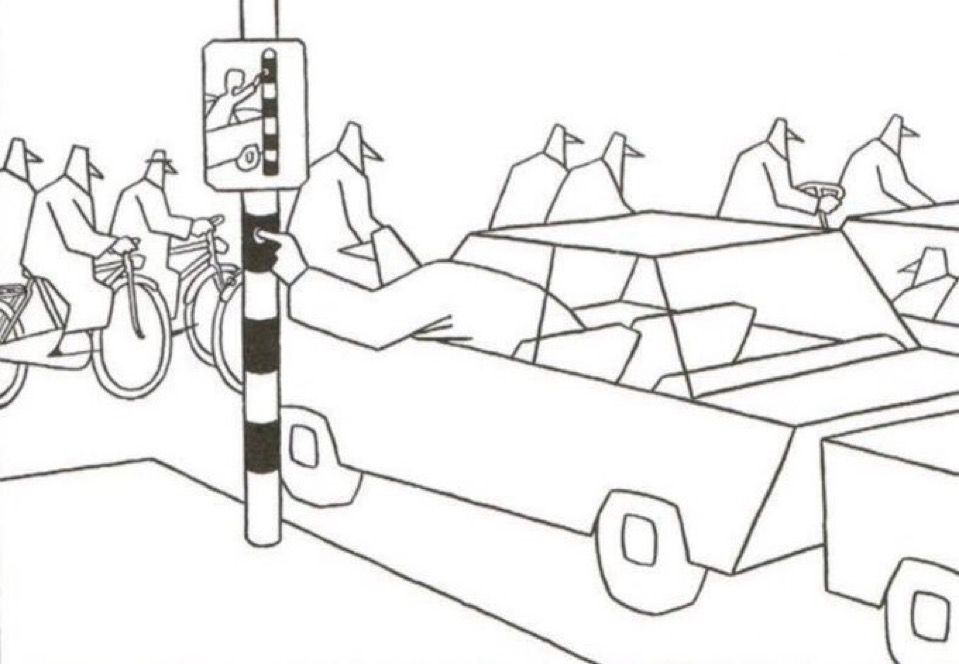
A driver in a car having to press a “beg button“ to change the lights, instead of pedestrians or people on bikes, illustrating the correct prioritization.
Time for another reminder — our values & priorities are revealed in countless small but key details in our city design, deliberate decisions that have prioritized cars over people for decades.
It will take equally deliberate decisions to change.
HT #Dutch cartoon by Verwey, 1980
25.01.2025 00:17 — 👍 266 🔁 44 💬 6 📌 4
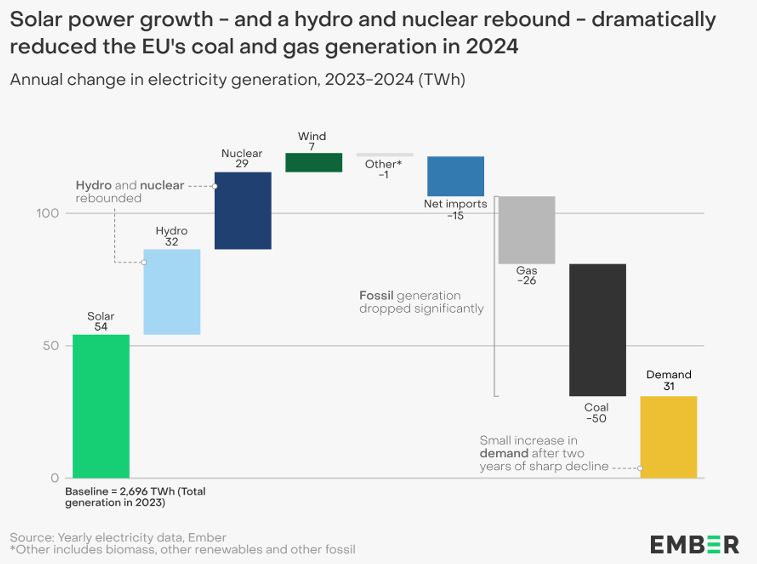
How did the EU's electricity mix change in the last year?
☀️ Big growth in solar
☢️ 🌊 Rebound in nuclear & hydro
💨 Not so much growth in wind
🏭 Large drop in fossil fuels (both coal and gas)
🔌 Demand up
From @ember-energy.org's new European Electricity Review: ember-energy.org/latest-insig...
23.01.2025 17:09 — 👍 310 🔁 83 💬 8 📌 10
vaya piruetas ha dado la sra. ministra para evitar hacer autocrítica… muy decepcionante #asínosva
23.01.2025 00:44 — 👍 0 🔁 0 💬 0 📌 0
The White House climate page is now gone. Climate change is not. www.whitehouse.gov/climate
21.01.2025 20:44 — 👍 287 🔁 155 💬 10 📌 26
In the paper, I note that its probably a bit of both. Some scenarios – like RCP8.5 – were never intended to represent median "business as usual" outcomes but were misinterpreted by much of the community as such.
15.01.2025 18:18 — 👍 46 🔁 3 💬 1 📌 0
M.Sc. Graduate, KNT University
Photogrammetry | Remote Sensing
Remote Sensing → Environmental Monitoring, Forest Ecology, Wildfire
Photogrammetry → Bundle Adjustment, UAV, Canopy Cover
#RemoteSensing #Photogrammetry #UAV #Drone #DeepLearning #GIS
Postdoc at LEAP / Columbia University at the intersection of atmospheric science and AI for science. Currently studying ice clouds ❄️☁️
housing + environmental health.
Asst. Professor of urban planning @gsd.harvard.edu
Formerly OECD, Paris planning, Ad’A ~
i write i teach i build i deconstruct
www.magdamaaoui.com
currently working on hospitals x housing, any lead/personal story welcome
The Department of Environmental & Occupational Health Sciences (DEOHS) in the University of Washington's School of Public Health builds healthy communities and safe workplaces.
https://deohs.washington.edu/
We're a news service that helps you understand climate change and what you can do about it. Get climate solutions in your inbox: yaleclimateconnections.org/sign-up-for-our-weekly-e-newsletter/
The GeoHealth section of AGU
Climate researcher @UFZ with focus on climate extremes and compound events. http://www.afsribeiro.com/
Aussie climate scientist specialising in compound heatwaves/extreme heat/humid heat. Previously at WSU Vancouver and Monash University. Opinions are my own 🌏 (she/her)
Climate, energy & compound events
@ ARC Centre of Excellence for Climate Extremes
@ UNSW Sydney
https://github.com/dougrichardson
Climate scientist interested in how weather systems and their impacts are changing in a changing climate
Professor, Climate Science | heatwaves | ANU Fenner School | Deputy Director Engagement & Impact, @21centuryweather | convening lead author @IPCC AR7 | co-host totally cooked podcast | @AMOS president | Climate Comms | Mother | Runner | #ADHD
Advancing transformative climate solutions. Analysis, insight, and research on climate change from the Climate, Economics and Finance team at the World Resources Institute.
We're a network for anyone interested in compound events, where we can share our work and discuss all things compound events.
Our sites:
www.compoundevents.org
https://www.risk-kan.org/working-group-compound-events-and-impacts/
@Compound_Event on Twitter
Web Design Museum exhibits thousands of screenshots and videos of websites, apps, software, and Flash games from the 1990s to the 2000s.
Dataviz designer, psychiatrist, PhD student
https://karaman.is
Dataviz blogger, author and Hall of Fame Tableau Visionary. Was @theneilrichards on here and the horrible other place.
Data Fluency @JLL
questionsindataviz.com
https://routledge.pub/Questions-in-Dataviz
Graphics Editor at The New York Times 🇺🇸| former Reuters 🇸🇬 | South China Morning Post 🇭🇰 | La Nacion 🇨🇷
Ministro de Derechos Sociales, Consumo y Agenda 2030. Las ideas se miden en sus efectos.
https://t.me/pbustinduy
Atmospheric Scientist (via CSUx2 & UGA). Enjoyer of ⛈️❄️🐱🏔️🏃♀️
(personal account)