a graph of US solar generation by month
Official data is in today, and American solar power remained near a record high in August, with generation up 25% compared to last year!
24.10.2025 22:46 — 👍 486 🔁 82 💬 7 📌 5
@conorwalsh.bsky.social
Columbia Business School Assistant Professor. Growth, firms, cities.
a graph of US solar generation by month
Official data is in today, and American solar power remained near a record high in August, with generation up 25% compared to last year!
24.10.2025 22:46 — 👍 486 🔁 82 💬 7 📌 5
Open call for papers, Energy Markets and the Macroeconomy Conference. Meeting to be held in Cambridge on December 10–11, 2026. Submit papers by 11:59pm EDT on November 19, 2025. More information: https://www.nber.org/calls-papers-and-proposals/energy-markets-and-macroeconomy-conference
22.09.2025 21:00 — 👍 4 🔁 3 💬 0 📌 1
Here's an awesome guide to navigating the changes in federal clean energy tax cuts after passage of the Republicans' budget bill, from the NYU Tax Law Center:
taxlawcenter.org/blog/navigat... 🔌💡
Cover of new REPEAT Project report, "A Fork In The Road: Impacts of Federal Policy Repeal On The U.S. Energy Transition."
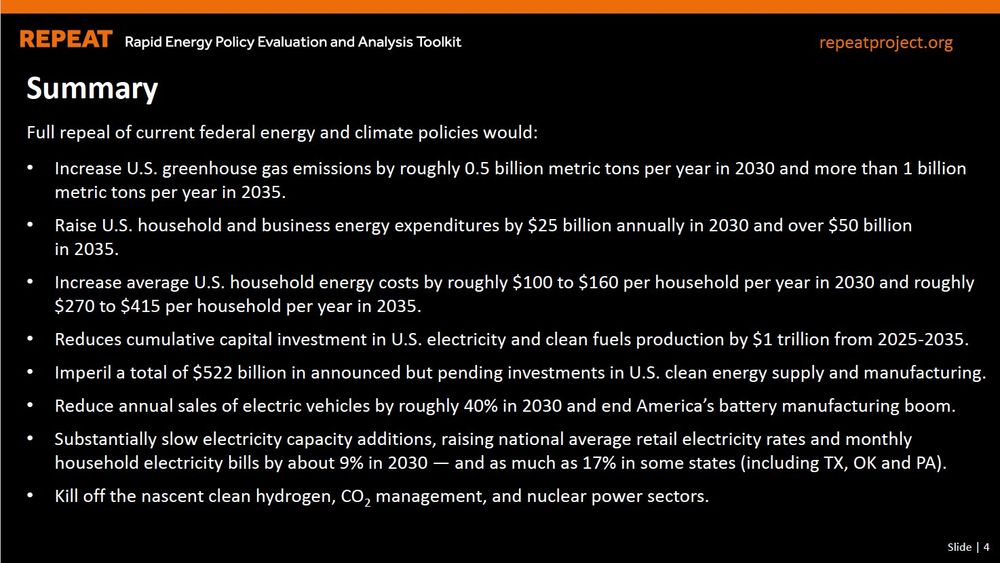
Summary Full repeal of current federal energy and climate policies would: • Increase U.S. greenhouse gas emissions by roughly 0.5 billion metric tons per year in 2030 and more than 1 billion metric tons per year in 2035. • Raise U.S. household and business energy expenditures by $25 billion annually in 2030 and over $50 billion in 2035. • Increase average U.S. household energy costs by roughly $100 to $160 per household per year in 2030 and roughly $270 to $415 per household per year in 2035. • Reduces cumulative capital investment in U.S. electricity and clean fuels production by $1 trillion from 2025-2035. • Imperil a total of $522 billion in announced but pending investments in U.S. clean energy supply and manufacturing. • Reduce annual sales of electric vehicles by roughly 40% in 2030 and end America’s battery manufacturing boom. • Substantially slow electricity capacity additions, raising national average retail electricity rates and monthly household electricity bills by about 9% in 2030 — and as much as 17% in some states (including TX, OK and PA). • Kill off the nascent clean hydrogen, CO2 management, and nuclear power sectors.
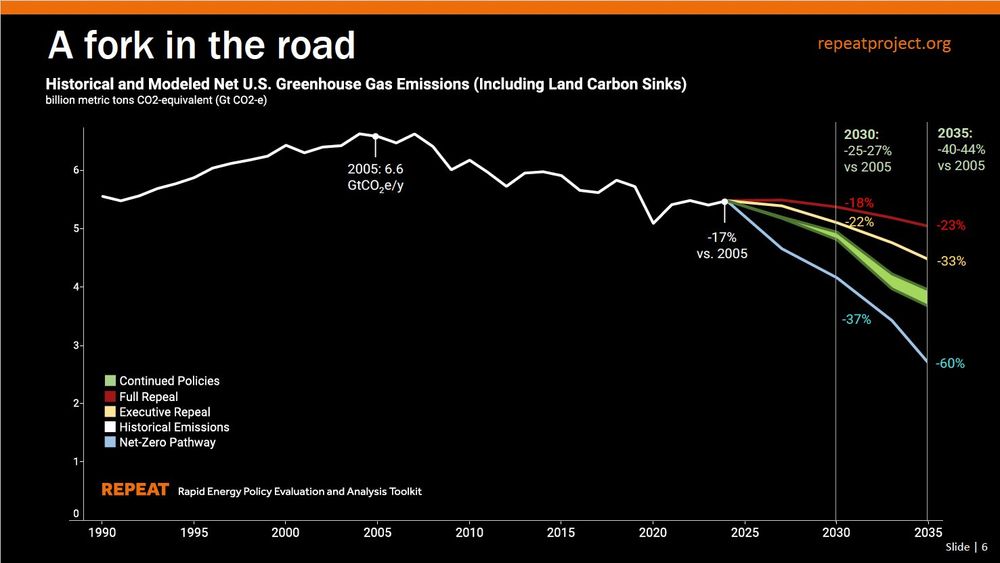
Graphic showing historical and modeled US greenhouse gas emissions, with substantial increase if current federal policies are repealed.
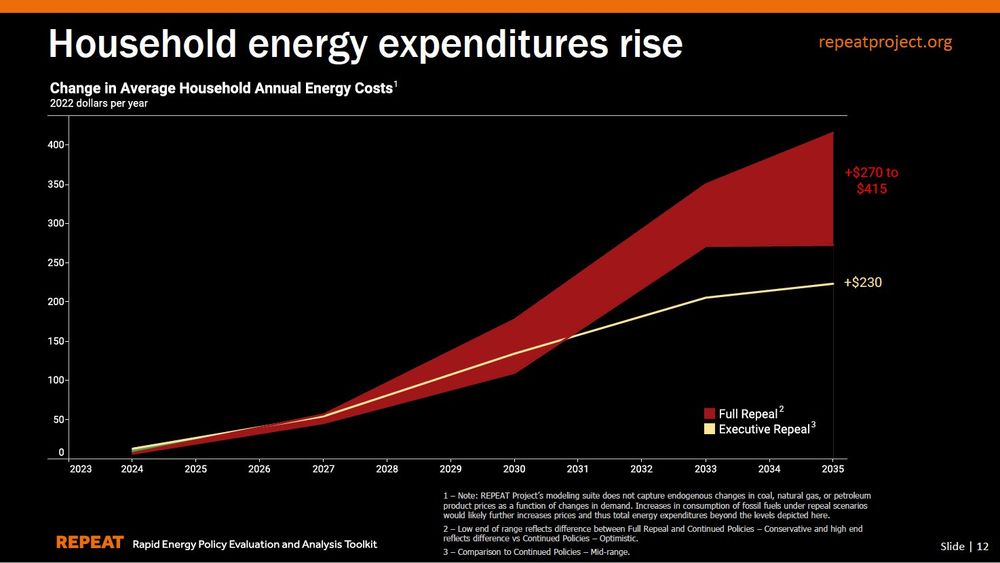
Graphic showing modeled average household US energy costs, with substantial increase if current federal policies are repealed.
What does the GOP Megabill passed by the House this morning mean for the US energy transition, energy prices, emissions and the economy? REPEAT Project's new analysis has you covered. Read the new report or listen to our recent SHIFT KEY episode diving into the details. 🔗 ⤵️
🔌💡
Yet another reason not to wall ourselves off from competition
25.04.2025 00:05 — 👍 4 🔁 0 💬 0 📌 0Quite amazing...the US and China are undergoing the energy transition at roughly the same pace.
21.04.2025 14:17 — 👍 2 🔁 0 💬 0 📌 0This is an excellent idea.
27.03.2025 13:54 — 👍 7 🔁 3 💬 0 📌 0We are pleased to announce an experiment intended to stimulate academic discussion and exchange, centered on papers published in Econometrica 1/5
27.03.2025 12:36 — 👍 121 🔁 38 💬 2 📌 15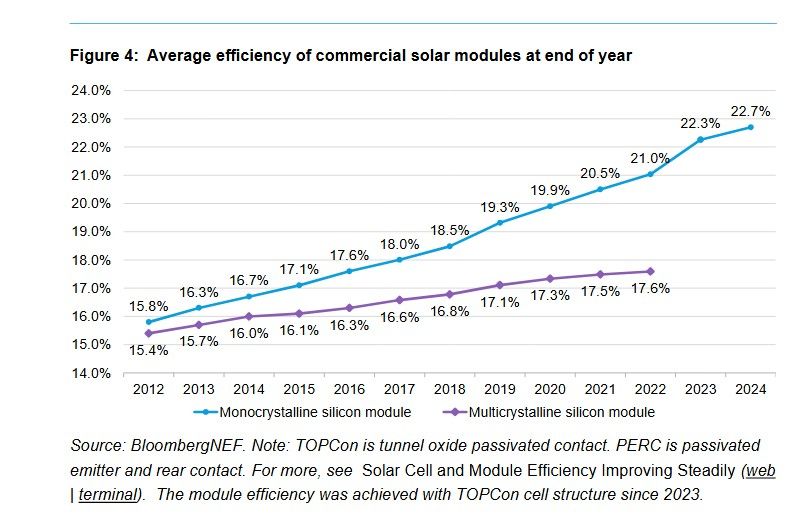
A chart from BloombergNEF showing average efficiency of commercial solar modules at end of year from 2012 to 2024. From 2012 two series are shown, for multicrystalline silicon and monocrystalline silicon. Both increase each year; the multi time series stops in 2022 (due to the product being essentially replaced by mono). The multi efficiency is 15.4% in 2012, and 17.6% in 2022; the mono efficiency is 15.8% in 2012 and 22.7% in 2024.
A typical photovoltaic module sold in 2024 was mono TOPCon with 22.7% efficiency, at a price below $0.10/W.
A typical solar module sold in 2012 was multi AlBSF with efficiency of 15.4% and a price of about $0.87/W.
That's not right. Measuring fossil fuels by their energy content is wrong, since so much of the energy is wasted. You want electrons delivered, which the link I posted shows.
04.01.2025 08:26 — 👍 0 🔁 0 💬 0 📌 0
Where are you getting 3% from?
Australia achieved a 38.9% renewable share of electricity last year.
explore.openelectricity.org.au/energy/nem/?...
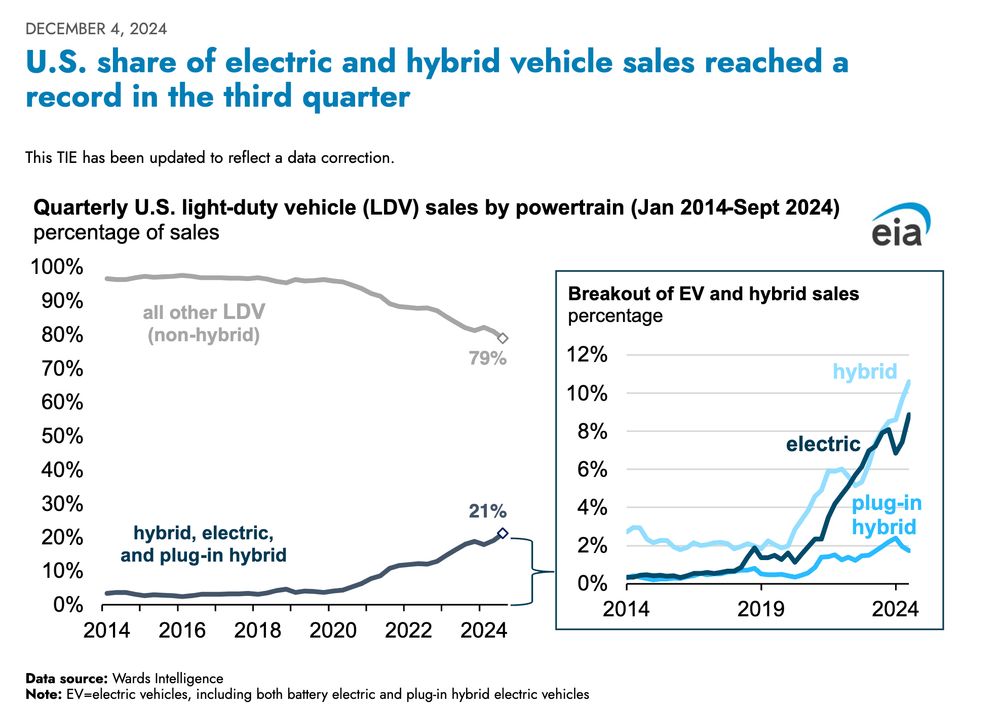
The EV/hybrid transition is continuing in the US. Greater model availability seems to be driving sales.
20.12.2024 22:51 — 👍 5 🔁 0 💬 0 📌 0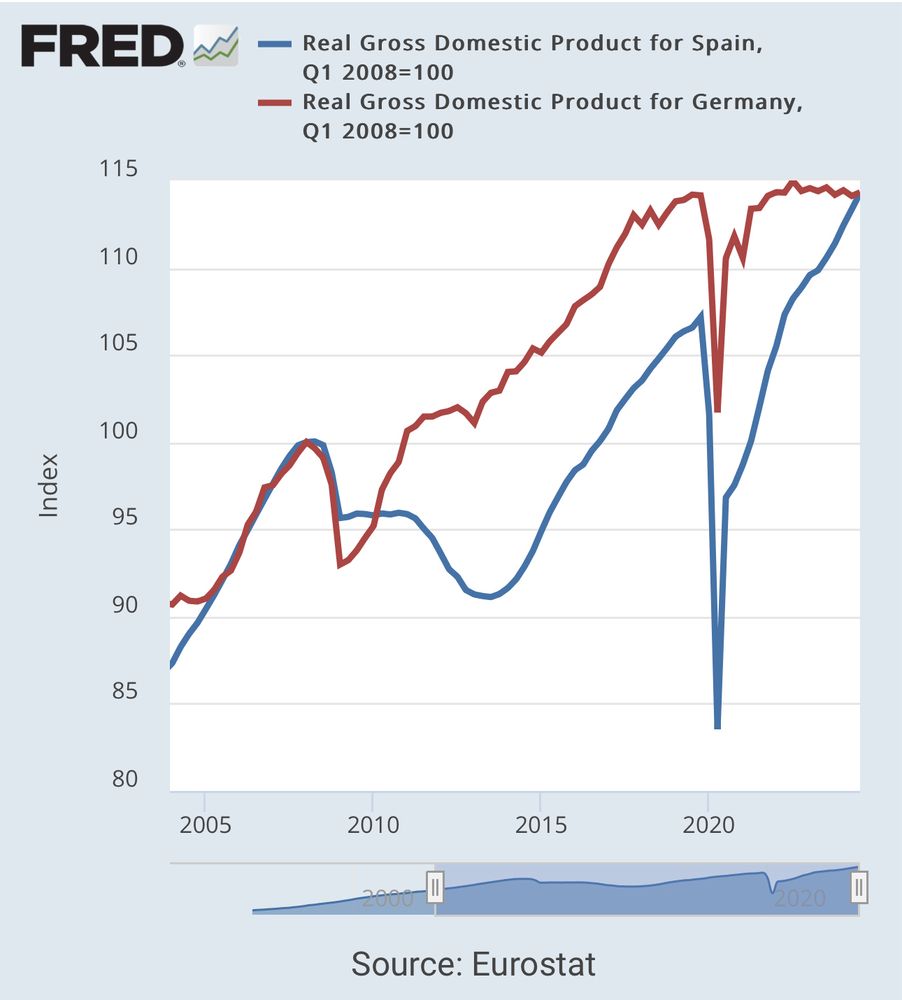
A graph comparing Spanish and German gdp, which diverge in 2008 but reconverge between 2017-2024
Here’s a crazy fact for you: Spain and Germany have now seen basically the exact same amount of economic growth post-2008. Would have been unthinkable to people during most of the 2010s. Spain has seen ~10 percentage points more cumulative growth since 2017.
23.11.2024 09:26 — 👍 1459 🔁 279 💬 49 📌 50
The road from Australia to Italy runs one bad idea at a time...
www.smh.com.au/politics/fed...
Great overview of a rapidly growing field!
15.11.2024 11:46 — 👍 10 🔁 0 💬 0 📌 0