YouTube video by FOX 2 St. Louis
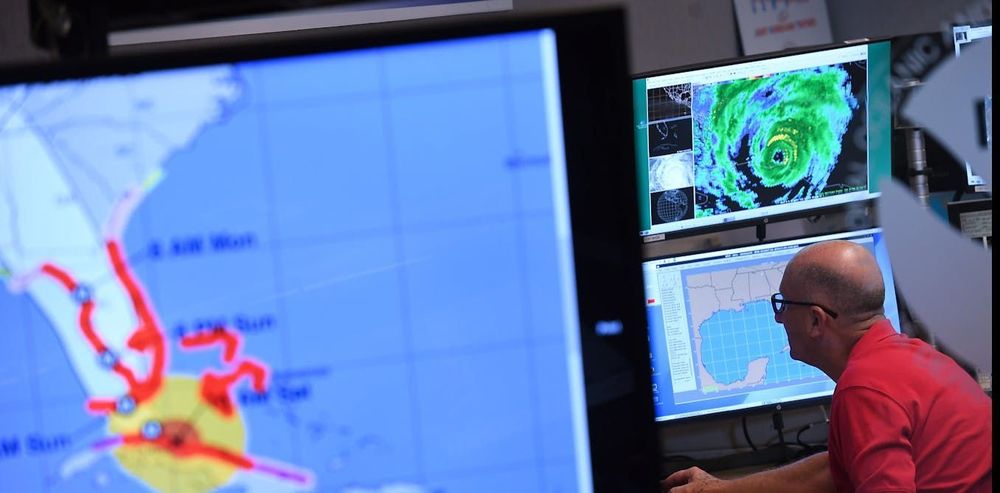
Weather Extra: St. Louis' historic 2022 flooding
I had a career first this week - I was on the news! I talked about the extreme rain event in St. Louis in July 2022 and how my recent publication estimates that it is about twice as likely as we previously thought.
YouTube link to the interview: www.youtube.com/watch?v=MZ7n...
13.05.2025 14:37 — 👍 6 🔁 0 💬 0 📌 0
-"So, like, remember that crazy St. Louis flood back in July 2022? TBH, it was wild. Everyone was saying it was a “1-in-1,000-year” event. Can’t even imagine dealing with that. But hold up, fam. Turns out, maybe it wasn’t that extra."
09.05.2025 17:17 — 👍 0 🔁 0 💬 1 📌 0
-"It’s not just random chance, fam. Climate change is the ultimate puppeteer, pulling the strings on our weather patterns, and the results are, well, not cute."
09.05.2025 17:17 — 👍 0 🔁 0 💬 1 📌 0
Here are some of my favorite highlights:
-"The data’s just not thicc enough."
-"If we’re building for a “1-in-1,000-year” storm when it could be more frequent, that’s a major vibe check fail."
-"Sparse data is a major vibe kill."
09.05.2025 17:17 — 👍 0 🔁 0 💬 1 📌 0
A new twist to science communication: AI-generated articles trained on science press releases.
One of these was written about my recently published study on extreme precipitation in the Central US.
The training prompt must have been, um, interesting...
09.05.2025 17:17 — 👍 1 🔁 0 💬 1 📌 0
NOAA’s vast public weather data powers the local forecasts on your phone and TV – a private company alone couldn’t match it
NOAA operates fleets of satellites, sensors on airplanes and ocean-going buoys, as well as radar, providing the data used by weather forecasters nationwide – and freely available to anyone.
"NOAA is taxpayer-funded, so it is a public good – its services provide safety and security for everyone, not just those who can pay for it." CIRES' @cwiedinm.bsky.social and Kari Bowen explain @noaa.gov's role in U.S. weather forecasts. @us.theconversation.com @colorado.edu
11.02.2025 16:15 — 👍 82 🔁 44 💬 1 📌 5
I love this synopsis of our paper 😆
10.02.2025 17:53 — 👍 2 🔁 0 💬 1 📌 0
The paper can be found here: journals.ametsoc.org/view/journal...
10.02.2025 17:45 — 👍 7 🔁 1 💬 0 📌 0
Finally, this project from my postdoc facilitated a pivot in terms of my research interests that culminated in me landing my current job at CIRES/CU Boulder working with NOAA PSL on high-resolution modeling for modernizing estimates of probable maximum precipitation! (end)
10.02.2025 17:04 — 👍 8 🔁 0 💬 2 📌 0

Return period estimate for the July 2022 rainfall event: red boxplot indicates the event will happen more frequently in the future (2022-2100) relative to other historical periods (black, blue, orange boxplots).
This new approach also included enough historical and modern/future data to estimate that the rainfall amount from this extreme event is about 2-4 times more likely to occur now and in the future compared to the preceding ~1,000 years. (5/6)
10.02.2025 17:04 — 👍 6 🔁 0 💬 1 📌 0

Top two rows show the NOAA Atlas 14 width of 90% confidence interval in designating a 1-in-1,000-year rainfall event at individual rain gauges. Bottom five rows show more precise estimates based on this study’s various methods.
This new “blended dataset” allowed me to refine the estimate of the storm’s rainfall over St. Louis and Kentucky to a ~1-in-530-year and ~1-in-280-year event, respectively, and reduced the uncertainty bars in this calculation by ~24-94% (4/6)
10.02.2025 17:04 — 👍 7 🔁 0 💬 1 📌 0

Blended dataset for St. Louis (STL) and eastern Kentucky (EKY) includes over a century of observation data and 1,250 years of climate model ensemble data.
I sought to improve the assessment of this storm by developing a new method that combined over a century of rainfall observations from dozens of rain gauges with 1,250 years of climate model simulations spanning 850 to 2100 CE, thus greatly lengthening the data record. (3/6)
10.02.2025 17:04 — 👍 6 🔁 0 💬 1 📌 0

Estimates of 24-hr precipitation depth constituting events of differing frequencies. Red and green lines show 90% confidence interval, which spans more than 7 inches at the 1-in-1,000-year event level.
This event was declared a 1-in-1,000-year event and caused quite a stir in the media, but a deeper look into the historical rainfall data revealed HUGE uncertainty bars on making such a declaration - mainly because it was made using only a few decades of observations (2/6)
10.02.2025 17:04 — 👍 8 🔁 1 💬 2 📌 0
🌧️ Science Alert 🌧️ I am pleased to share newly published work that blends precipitation from both observations and climate models to more precisely assess an extreme precipitation event that took place in July 2022 and caused major flooding across St. Louis, MO and eastern Kentucky (1/6)
10.02.2025 17:04 — 👍 31 🔁 8 💬 2 📌 5
Let me know if you'd like to see the same report for a different location
16.01.2025 23:56 — 👍 1 🔁 0 💬 1 📌 0

Daily high temperature in Boulder, CO for 2024 compared to the historical range of daily high temperatures between 1893 and 2023
Year-end report for 2024 daily high temperature from the station at Boulder's NOAA lab: days warmer than the historical mean (1893-2023) outnumbered colder days by ~2.3 to 1
16.01.2025 23:54 — 👍 5 🔁 1 💬 1 📌 0
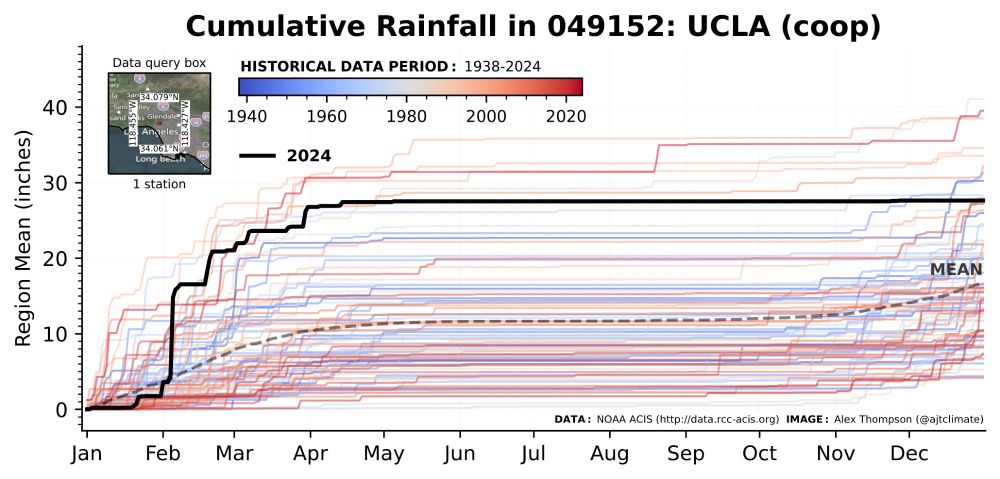
Cumulative daily rainfall for 2024 from a precipitation station at UCLA. Data is shown for each year (individual lines) between 1938 and 2024. Older lines are blue and more recent lines are red.
In the lead up to the #PalisadesFire and #EatonFire (using data from a nearby station at UCLA), Southern California experienced one of its wettest periods on record during Jan-Apr 2024 and has not had meaningful rainfall since 🤯 Mindblowingly favorable meteorological conditions for large wildfires
10.01.2025 17:57 — 👍 64 🔁 22 💬 2 📌 3

Cumulative rainfall history since 1912 overlaid by 2023 cumulative rainfall for a single station in Death Valley National Park.
15.12.2023 15:53 — 👍 1 🔁 0 💬 0 📌 0

Annual cycle of rainfall from Death Valley National Park overlaying 2023 daily rainfall onto the five wettest calendar days for the period 1912-2022.
The last ClimateDataVisualizer example for AGU is the August 20, 2023 rainfall event in Death Valley NP from remnants of Hurricane Hilary. This event was the single highest recorded day since 1912 and accounted for an entire year's worth of 🌧️ in a single day
15.12.2023 15:52 — 👍 6 🔁 0 💬 1 📌 0

Cumulative rainfall history since 1920 overlaid by cumulative rainfall for years 2020-2023 for a region encompassing Western Maui.
Today’s ClimateDataVisualizer example for AGU is annual rainfall for Western Maui in the years preceding 2023’s devastating wildfire. Some of the lowest annual rainfall totals since 1920 occurred in the last few years, drying out the region and priming it for a severe wildfire.
14.12.2023 16:59 — 👍 2 🔁 0 💬 0 📌 0

Cumulative rainfall history since 1885 overlaid by 2023 cumulative rainfall for a region encompassing Southern Vermont.
Today’s ClimateDataVisualizer example for AGU is the near-record 2023 cumulative rainfall year in Southern Vermont, which includes an extreme rainfall event on July 10-11. The lines are colored by year and show that as the climate warms, total annual rainfall tends to increase.
13.12.2023 15:30 — 👍 6 🔁 1 💬 0 📌 0

Daily high temperature history from 1874 to 2020 overlaid by 2021 daily high temperature for a region encompassing Portland, OR.
Today’s ClimateDataVizualizer example for AGU is the 2021 Pacific NW heat dome as shown in Portland, OR. NOAA ACIS observations show daily high temps on June 26-28, 2021 up to 9°F higher than any previous day since 1874. In fact, the Portland-wide avg from 4 stations topped out at 115°F on June 28!
12.12.2023 15:43 — 👍 1 🔁 0 💬 1 📌 0

Daily rainfall history from 1893 to 2021 overlaid by 2022 daily rainfall for a region encompassing St. Louis and St. Charles, MO.
This storm inspired me to create this web tool and I am also excited to share that I will be presenting a poster at the virtual AGU session in January on a new study of mine that analyzes the historical context of this event's rainfall! Hope to see you there! (6/6)
11.12.2023 14:52 — 👍 2 🔁 0 💬 0 📌 0
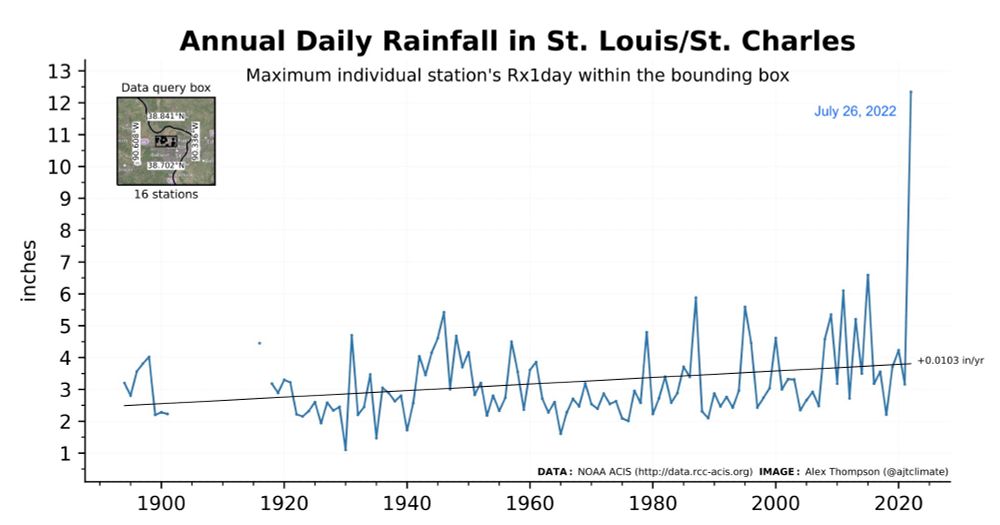
History of rx1 day (annual daily max) rainfall in a region encompassing St. Louis and St. Charles, MO.
This week, I'll share a few examples of recent extreme climate events and how you can use the web tool to explore them. First up is the extreme rainfall event on July 26, 2022 in St. Louis. Check out how extreme this event was relative to previous yearly max rain events! (5/6)
11.12.2023 14:51 — 👍 0 🔁 0 💬 1 📌 0
A user help guide is available to walk users through the steps of using the tool. I plan on adding new features to the website in the future like daily weather maps of temp and precip from the NOAA ACIS gridded dataset. (4/6)
11.12.2023 14:50 — 👍 0 🔁 0 💬 1 📌 0
I currently have two different types of data visualizations (annual cycle and time series) for four daily climate variables: maximum temp, minimum temp, rainfall, and snowfall. Annual cumulative plots are also available for rainfall and snowfall. (3/6)
11.12.2023 14:50 — 👍 0 🔁 0 💬 1 📌 0
Climate Data Visualizer is designed for users to visualize daily and extreme temp/precip within the context of local climate history. The tool queries data from NOAA ACIS - an amazing database of daily station-based observations going back to the late 1800s. (2/6)
11.12.2023 14:50 — 👍 0 🔁 0 💬 1 📌 0
Satellite hydrologist, ASU Global Futures Professor, water and climate science communicator, leader of the WISE Research Group @wisegrouporg.bsky.social. Formerly NASA JPL Senior Water Scientist and ‘What About Water’ podcast host.
Project Scientist at NCAR
Postdoc at Harvard HEB / EPS
Brown (PhD) '24, UCLA (MS) '18, Williams (BA) '13
Terrestrial + marine (paleo) climatologist | organic + carbonate (isotope) geochemist
Research Scientist @cires.colorado.edu and NOAA | Arctic paleoclimate | climate solutions | http://davidharning.com
science journalist covering climate, conservation, geology | words in New York Times, National Geographic, others | PhD in very old rocks
Lady who climates. Executive Director for Industry Proving Ground at NOAA: Director of the Fifth National Climate Assessment. View my own. She/her.
Investigative Journalist climate, energy, environment.
Rolling Stone politics contributing reporter.
"Gripping in its disgusting clarity." - my writing
Book Author. Lecturer. Pool shark.
http://www.AntoniaJuhasz.net
Professor studying cities, infrastructure, climate, energy, long bike rides, the Boston Celtics, & the drop serve. Personal account representing only me. Likes, reposts ≠ endorsements.
US Center Director and Senior Scientist, Stockholm Environment Institute | Former Adaptation at STAP/GEF | CLA IPBES Transformative Change Assessment | LA IPCC AR6 WGII | Masters T&F All-American | Hopelessly realistic optimist
www.edwardrcarr.com
engineering professor @ University of Colorado
power systems optimization AND power lifting
"energy as a personality" -my wife
<3 cats, playing guitar/bass/drums, rock/metal, fitness, video games, taking stuff apart. Views =my own and not my employer's
Climate policy wonk. Rogue biogeochemist. Assoc. Prof., Fmr. Congressional staff (AAAS_STPF). Obama EPA & Biden OMB alum.
climate, adaptation, decision analysis, flood risk, insurance, resilience, BCAs. planning & policy jack of all trades at the Water Institute. (personal account)
also sports, birds, हिंदी, cities, etc.
chicago via new orleans via chicago
Climate, energy, emerging tech, resilience, & policy professor. Carnegie Mellon Univ. Institute for Energy Innovation Director. Former Biden-Harris White House OSTP Chief Advisor for the Clean Energy Transition. Personal account. He/Him. costasamaras.com
Cannot jump high, highly motivated by clouds, vector enthusiast, fan of wilderness.
Erie, CO
Current reading: "1491: New Revelations of the Americas before Columbus" (Mann), "Introduction to Quantum Mechanics" (Griffiths and Schroeter)
Researcher of Clouds and Climate @CUBoulder and @NOAA CSL | PhD '20 @MiamiRosenstiel University of Miami | Satellite Data | Machine Learning | Geoengineering
Apple Weather Forecasting Lead. Machine learning, weather research and radar.
Professor in Meteorology and Computer Science, Director of the NSF AI Institute for Research on Trustworthy AI in Weather, Climate, and Coastal Oceanography (AI2ES), mom to @wrmf.bsky.social and @agileschnauzers.bsky.social
Atmospheric Data Scientist @ tomorrow.io | Atmos AI Engineer 🤖 | μ-wave Nephologist ☁️ | Atmos PhD UofIllinois | #BillsMafia #Illini | he/him | Opinions my own |
Ph.D. Atmospheric Scientist. Stay-at-home cat servant. Enjoyer of alpine lakes, thrift stores, cold brew, & Moscow mules.
Automatically updated plots about our climate.
https://climate-plots.github.io