
We need a global assessment of avoidable climate-change risks
To understand the urgency of emissions reductions, policymakers and citizens need a full analysis of what is at stake.
We need more than IPCC: The IPCC is crucial for assessing climate-change science but is a politically-constrained summary of ONLY the most inarguable core of the science. A GLOBAL RISK ASSESSMENT is needed to clarify the real range of risks & priorities for action.
www.euronews.com/2026/02/27/t...
27.02.2026 14:28 —
👍 7
🔁 7
💬 0
📌 0
Registration
💶 The @sedimentology.bsky.social sponsors the 5dwc with travel grants for IAS student members. If you would like to join, submit your abstract and your travel grant application as soon as possible because there is a limited amount of travel grants. More info 👇
www.marum.de/en/5th-Deep-...
22.02.2026 20:56 —
👍 4
🔁 3
💬 0
📌 0

Concerned about the Point of No Return? Today we published a paper on the risk of a hothouse Earth trajectory. You can read it here: authors.elsevier.com/c/1mbW49C~Iu...
11.02.2026 19:43 —
👍 96
🔁 63
💬 6
📌 13

Paleotemperatures through the Phanerozoic and the variation of measurement densities through time.
I'm glad to share our new study on the nature of distributions of gaps in empirical geochronologies of geological section as a function of time scale. Measurements of proxies are highly uneven if measured through time.
1/5
www.nature.com/articles/s43...
🧪 #Geology ⚒️ #Paleobio #EvoBio
29.01.2026 22:02 —
👍 43
🔁 18
💬 2
📌 0


Scientist in a white lab coat and gloves working with a laboratory instrument in a modern research lab filled with equipment and a laptop.

Two researchers in cold-weather gear examining samples on a rocky, snowy slope near a body of water.
Are you a UK researcher who wants to carry out a small-scale fieldwork project at our Antarctic research stations or on board our polar research ship?
📅 Deadline for applications is 4pm, 31 March 2026
Find out more on our website: https://ow.ly/aE5Q50Y3P5O
📸 Chris Walton & Nina Kinney
27.01.2026 22:00 —
👍 37
🔁 21
💬 2
📌 0

✨New GEOTRACES Science Highlight! ✨ 🌊
Conservative behavior of radiogenic neodymium isotopes in the South Pacific interior
👉 www.geotraces.org/conservative...
Paper first author: Zhouling Zhang @geomarkiel.bsky.social
@scor-int.bsky.social
#OceanScience #MarineScience #Pacific #neodymium
19.01.2026 09:49 —
👍 5
🔁 3
💬 0
📌 0

doi.org/10.1016/j.ep...
New study demonstrates conservative behaviour of seawater neodymium isotopes in the S Pacific.
15.01.2026 18:45 —
👍 5
🔁 3
💬 0
📌 0

Antarctic Intermediate Water Variability in the South Atlantic Over the Last 600,000 years - Soaga - 2025 - Paleoceanography and Paleoclimatology - Wiley Online Library
10.12.2025 19:25 —
👍 8
🔁 5
💬 0
📌 0

#Magellan3 workshop MANI_IN_PASTA now open for registrations 📣
📍 Where: Trieste, Italy, with online hybrid participation possible.
🗓 When: Monday 11th - Wednesday 13th May 2026
Further information and registration: iodp3.org/new-magellan...
13.01.2026 15:22 —
👍 1
🔁 1
💬 0
📌 0

🌊 Plot of the Week! 🌊
In the NW Med, 7 active Argo floats captured the winter mixing in one of the few regions of the world where deep convection is observed.
These processes are crucial for climate regulation and are experiencing major shifts.
#OneArgo #Argofloat #Argofloats #Argo
13.01.2026 14:45 —
👍 12
🔁 2
💬 1
📌 1

Uni Bern: Postdoc position: Earth system model development
(3 years)
✨I have a vacant 3-yr postdoc position in biogeochemical Earth system model development. If you're interested in geochemical isotopes and their use as paleoceanographic proxies, please consider applying. For any questions on the position, just get in touch✨
ohws.prospective.ch/public/v1/jo...
12.01.2026 08:53 —
👍 19
🔁 23
💬 0
📌 0
Argo data python library documentation — argopy 1.4.0 documentation
🌊 Unlock the Ocean’s Hidden Chemistry!
Excited to announce #argopy 1.4.0! 🎉
Now predict nutrients (NO₃, PO₄, SiOH₄) and carbonate variables (AT, DIC, pHT, pCO₂) with CANYON-B and CONTENT models—directly from your #argofloats data. Perfect for @bgc-argo.bsky.social users !
argopy.readthedocs.io
06.01.2026 08:14 —
👍 12
🔁 9
💬 1
📌 0
Chair in Earth Sciences - AC2672
Chair in Earth Sciences - AC2672,
Earth and Environmental Sciences
Salary: Grade 9/Negotiable
Start Date: September 2026
,
<p style="margin-right: 22.7pt; text-align: justify;"><span style="color: bl...
🚨Professorship at St Andrews🚨
We are recruiting a Professor in Earth Sci (incl atmos, oceans, climate) @earthscista.bsky.social @uniofstandrews.bsky.social
Ideal candidate is a leading researcher with interests in impact/outreach. Deadline 23/3/26!
www.vacancies.st-andrews.ac.uk/Vacancies/I/...
05.01.2026 09:26 —
👍 18
🔁 23
💬 0
📌 1

An artist's drawing of the Ben Franklin submersible. The sub is shown with its side cut open to reveal the interior and technology of the submersible.

A temperature map of the Gulf Stream with the track of the Ben Franklin superimposed on it. Beginning on July 14, 1969 off Florida, ending on August 14 off Nova Scotia.
Wow, why have I never heard of the Ben Franklin mesoscaphe? Like human argo floats, 6 men descended to ∼600m and drifted submerged in the Gulf Stream for 30 days. Along the drift, the crew mapped seafloor properties, biology, noises, and acted as a human occupied CTD analyzing the water column.
04.01.2026 16:40 —
👍 17
🔁 5
💬 3
📌 0

One of the most fascinating views as an oceanographer: RRS Discovery, built in 1901.
23.12.2025 12:48 —
👍 0
🔁 0
💬 0
📌 0
I’m looking for a PhD student to join my lab @ NC State starting Fall 2026!
Lots of room to develop projects, esp. around paleoceanography, ocean deoxygenation & foraminiferal ecology. Field, lab & computational angles all possible.
Please share with anyone who might be a good fit!
26.09.2025 17:27 —
👍 16
🔁 15
💬 0
📌 1

Time series of standardized streamflow anomaly for the Ganga River from year 700 to 2020 (derived from a hydrological model and from the Monsoon Asia Drought Atlas built from tree rings). The plot shows mostly balanced wet (blue/green bars) and dry (brown bars) years until the 20th century, when the black moving-average line dips sharply after 1990. The 1991–2020 mean (blue horizontal line) is well below the range of previous 1,300 years. Orange dots mark major documented historical droughts, but the recent drying is clearly the most severe.
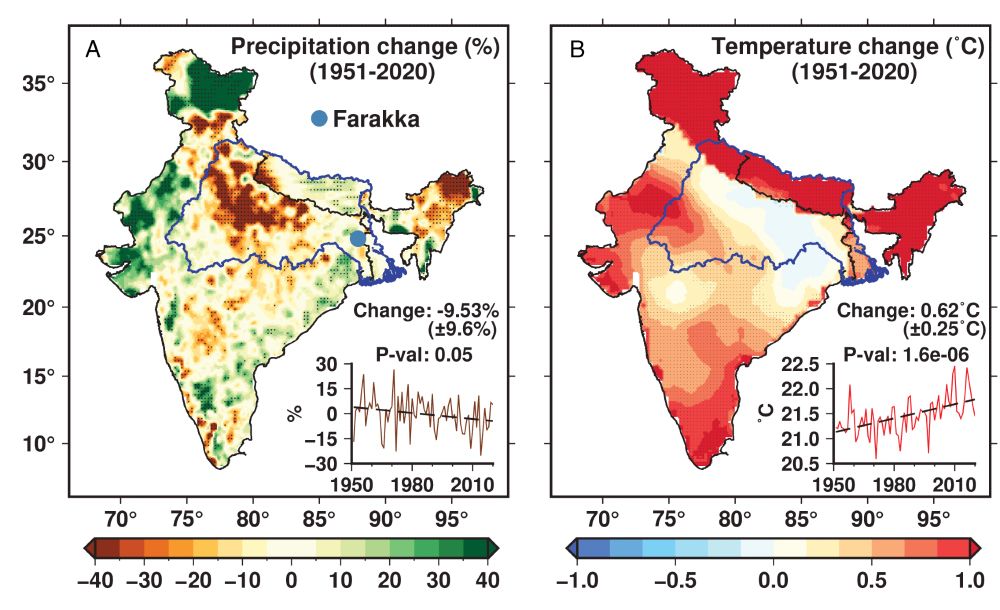
Observed changes in precipitation and temperature between 1951 and 2020. Spatial distribution of change in (A) annual precipitation (%) and (B) annual mean temperature (°C) between 1951 and 2020 based on the Sen’s slope calculation. Grids with statistically significant trends (P <= 0.05), based on the Mann–Kendall test, are highlighted with stippling. The Inset panels in (A) and (B) represent the interannual variability in precipitation anomaly (%) and temperature (°C) averaged
for the Ganga River Basin (blue boundary). The total change in average precipitation and temperature over the GRB during 1951−2020, estimated using the Sen’s slope, is statistically significant (P-value <= 0.05) based on the Mann–Kendall test.
🚨New work🚨 led by Ph.D. student Dipesh Chuphal (IIT Gandhinagar), shows that the recent drying of the Ganga River basin is unprecedented in 1,300 years—more severe than historical famines. This ~multidecadal drying appears forced, but many models do not capture it. ☔️ 🌧️
www.pnas.org/doi/10.1073/...
22.09.2025 19:45 —
👍 29
🔁 10
💬 0
📌 0

Carbonate chemistry fitness landscapes inform diatom resilience to future perturbations
Diatom growth rates are determined by concentrations of CO2 and H+ across broad carbonate chemistry landscapes.
1/n
This study led by @aaronferderer.bsky.social tested how 5 diatom species respond to broad ranges of seawater carbonate conditions. Goal was to determine carbonate chemistry niches and to inform Ocean Alkalinity Enhancement (OAE) and Ocean Acidification (OA)
🌊
www.science.org/doi/10.1126/...
19.09.2025 01:10 —
👍 25
🔁 15
💬 2
📌 1


