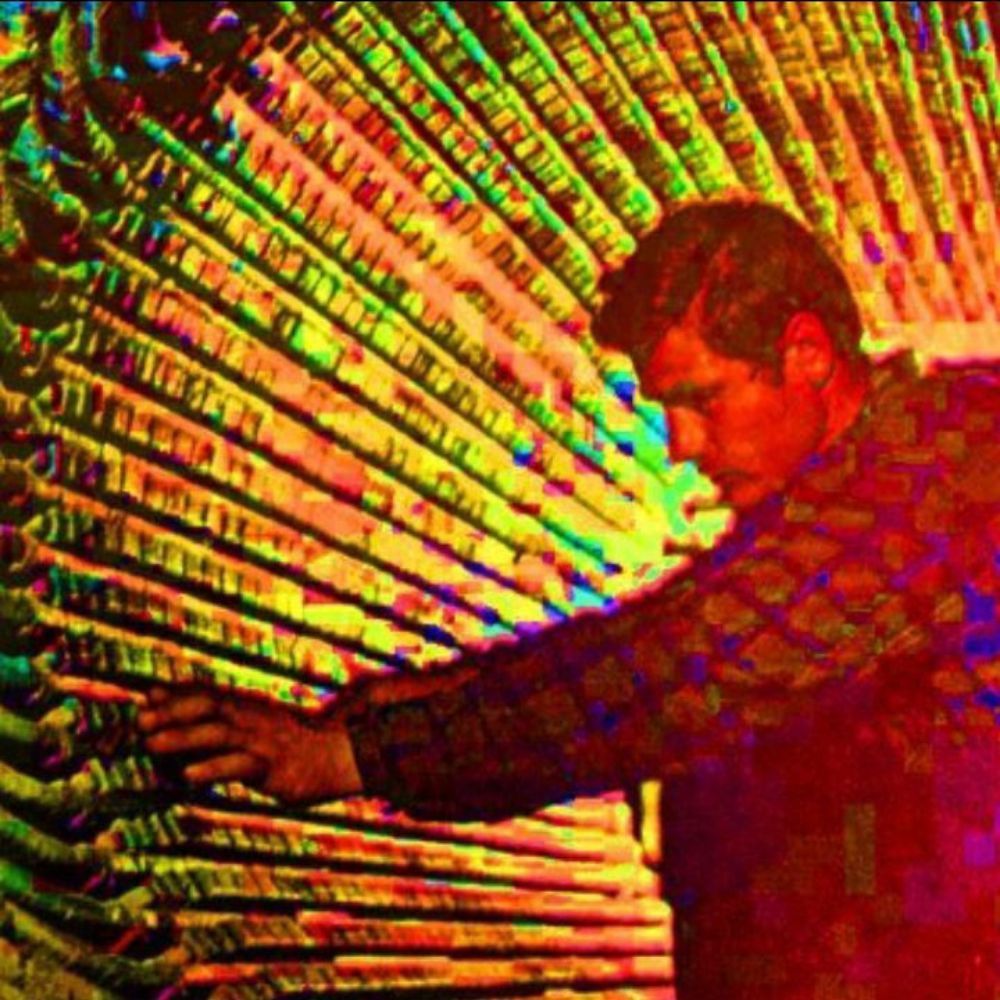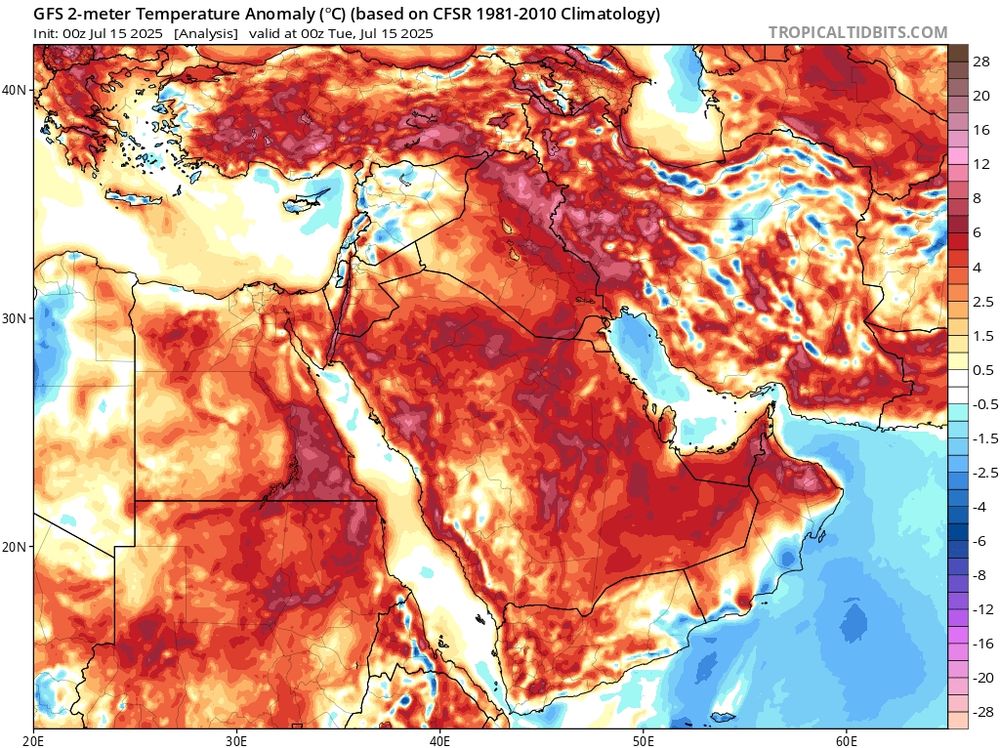
INSANE HEAT IN MIDDLE EAST
Crazy MINIMUM TEMPERATURE 38.3C Tuz IRAQ
Dozens of stations allover Middle East (Iran,Iraq,Kuwait,Emirates) with Minimums >35C
Max. temperatures expected up to 52C. Nights up to 40C !
Historic heat wave,one of the worst ever seen anywhere worldwide
it 'll last weeks
15.07.2025 10:01 — 👍 274 🔁 181 💬 14 📌 30
Grazie mille x il suo lavoro. Ho letto volentieri 'come muoiono le democrazie' super prezioso. Se ha altri (anche in inglese ) consigli di libri.....e' sempre piu' importante leggere e uscire dall' informazione preconfezionata.
15.07.2025 10:22 — 👍 0 🔁 0 💬 0 📌 0
Mi può consigliare qualche libro anche in inglese sul tema. Grazie
10.07.2025 15:56 — 👍 1 🔁 0 💬 1 📌 0

Western Europe is experiencing its second heatwave of the summer. For the continent as a whole, this June is likely to be one of the five warmest on record.
Read the press release: climate.copernicus.eu/ecmwf-weathe...
@ecmwf.int @oceanterra.org @carlobuontempo.bsky.social
01.07.2025 12:45 — 👍 25 🔁 21 💬 1 📌 2

Global map showing surface air temperature anomalies for the March 2025 to May 2025 period across the entire planet. Most all areas were warmer than average, especially in the Arctic. This data set is from NOAA's NOAAGlobalTempv6.0.0 using anomalies with a 1971-2000 climate baseline. Red is shown for warmer than average temperatures, and blue is shown for colder than average temperatures.
Here is a map of the mean temperature departures over the last three months... find your location 👀
🟥 warmer than average
🟦 colder than average
Dataset (NOAAGlobalTempv6) described in doi.org/10.1175/BAMS...
22.06.2025 12:57 — 👍 85 🔁 30 💬 2 📌 1
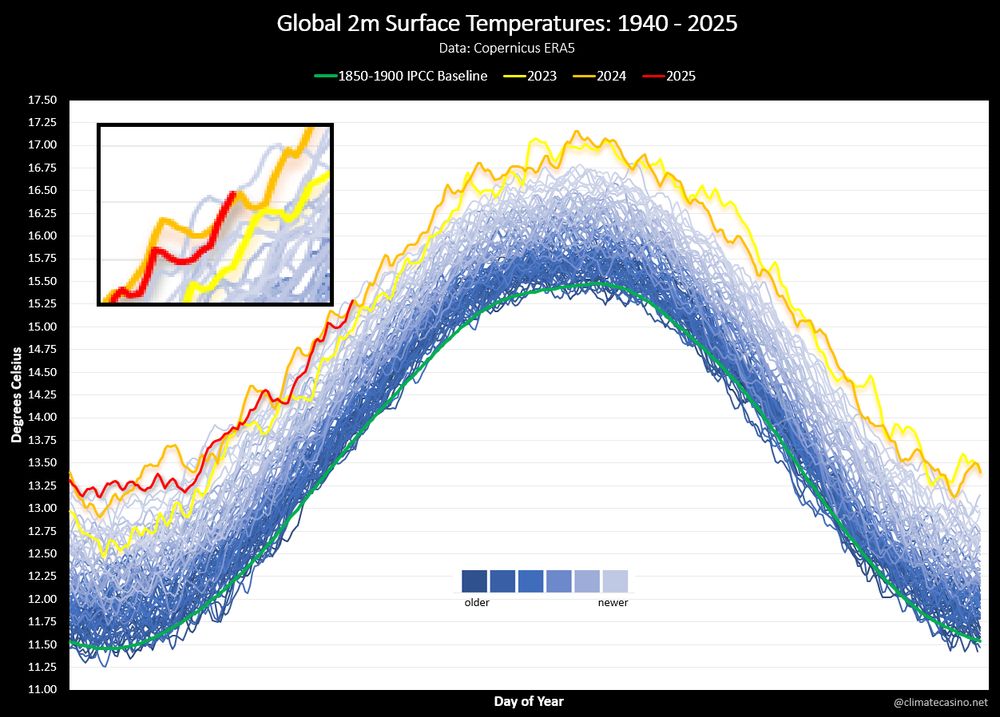
And it hardly even seems newsworthy, but the global mean surface temperature two days ago, on April 24th, hit a new record daily high according to ERA5 data.
The Climate 8-ball doesn't know who is in charge and is refusing to make predictions.
26.04.2025 13:33 — 👍 351 🔁 127 💬 14 📌 8
As a result, we can expect:
* Cons leaning harder to the far right.
* Someone even worse after Poilievre.
* Tax cuts for the wealthy.
* Subsidies and tax breaks for corporations and tax havens.
* Pipelines, baby! Climate an afterthought.
* No more things like dental/pharma plans.
29.04.2025 12:25 — 👍 201 🔁 19 💬 1 📌 5
Good:
* Poilievre isn't Prime Minister.
* Poilevre lost his own seat.
Bad:
* Everything has shifted substantially rightward.
* 40% of popular vote and +20 seats for Cons.
* Basically a two-party parliament of centre right and far right.
* Left leaning parties wiped out.
29.04.2025 12:20 — 👍 1235 🔁 310 💬 3 📌 49
Ahimè c’entra poco. Ma ti lascio nelle tue convinzioni.
29.04.2025 15:04 — 👍 0 🔁 0 💬 1 📌 0
Si tratta di liberali. La sinistra non c’entra nulla. Anzi in Canada e’ marginale.
29.04.2025 14:41 — 👍 0 🔁 0 💬 1 📌 0
Scrivi qui.Volevo ringraziarti. Ho letto electric state. Immagini straordinarie.Non bazzico i fumetti (queste sono opere)ma se hai altro da consigliare.accetto con piacere
12.04.2025 18:26 — 👍 0 🔁 0 💬 0 📌 0
Get ready for the European State of the Climate 2024 release on April 15, covering a great range of climate variables for Europe and the Arctic—temperature, flooding, wildfires, glaciers, renewable energy, and more!
Stay tuned!
#ESOTC2024 #C3S
01.04.2025 08:31 — 👍 61 🔁 21 💬 0 📌 0
I live in europe, but follow the news from United States. Project 2025 is the programme of repubblican party? Thanks
05.04.2025 20:57 — 👍 0 🔁 0 💬 1 📌 0
Grazie. Vorrei farti leggere questo articolo lontano dai dazi. Forse avevi gia' letto qualcosa . Secondo me è importante . cosa ne pensi ?
united-states-world.com/2025/03/11/n...
03.04.2025 14:21 — 👍 0 🔁 0 💬 0 📌 0
Leggevo il calcolo per arrivare a questi dazi. E sono rimasto senza parole. Sembra proprio il re che applica le tasse come gli pare e piace....
03.04.2025 10:28 — 👍 0 🔁 0 💬 1 📌 0
🔴The #StateOfClimate report, released today, reveals key climate change indicators again reached record levels in 2024.
Check out the full report: wmo.int/publication-...
19.03.2025 08:00 — 👍 316 🔁 239 💬 5 📌 39

Global map showing surface air temperature anomalies for February 2025 across the entire planet. Most all areas were warmer than average, especially in the Arctic. This data set is from NOAA's NOAAGlobalTempv6.0.0 using anomalies with a 1971-2000 climate baseline. Red is shown for warmer than average temperatures, and blue is shown for colder than average temperatures.
Looking back at temperature departures in February 2025 - find your location...
🟥 [red] warmer than average
🟦 [blue] colder than average
Dataset (NOAAGlobalTempv6) described in doi.org/10.1175/BAMS...
15.03.2025 17:02 — 👍 145 🔁 53 💬 3 📌 8

plot of sea surface temperature trend over past two years and current pattern
Global sea surface temperatures are at their lowest since June 2023 as weak La Nina-like pattern persists. However, we didn't see the greater cooling expected from what was predicted to be a more substantial La Nina event.
The problem remains the steady long-term warming!
pulse.climate.copernicus.eu
10.12.2024 19:04 — 👍 214 🔁 66 💬 8 📌 5
Grazie
13.12.2024 19:28 — 👍 0 🔁 0 💬 0 📌 0
Leggo da altro utente che i casi sono 21.403 quindi 10 volte quelli forniti. Dato Respirvirnet Iss. Quali sono i dati più reali?
13.12.2024 18:06 — 👍 0 🔁 0 💬 1 📌 0
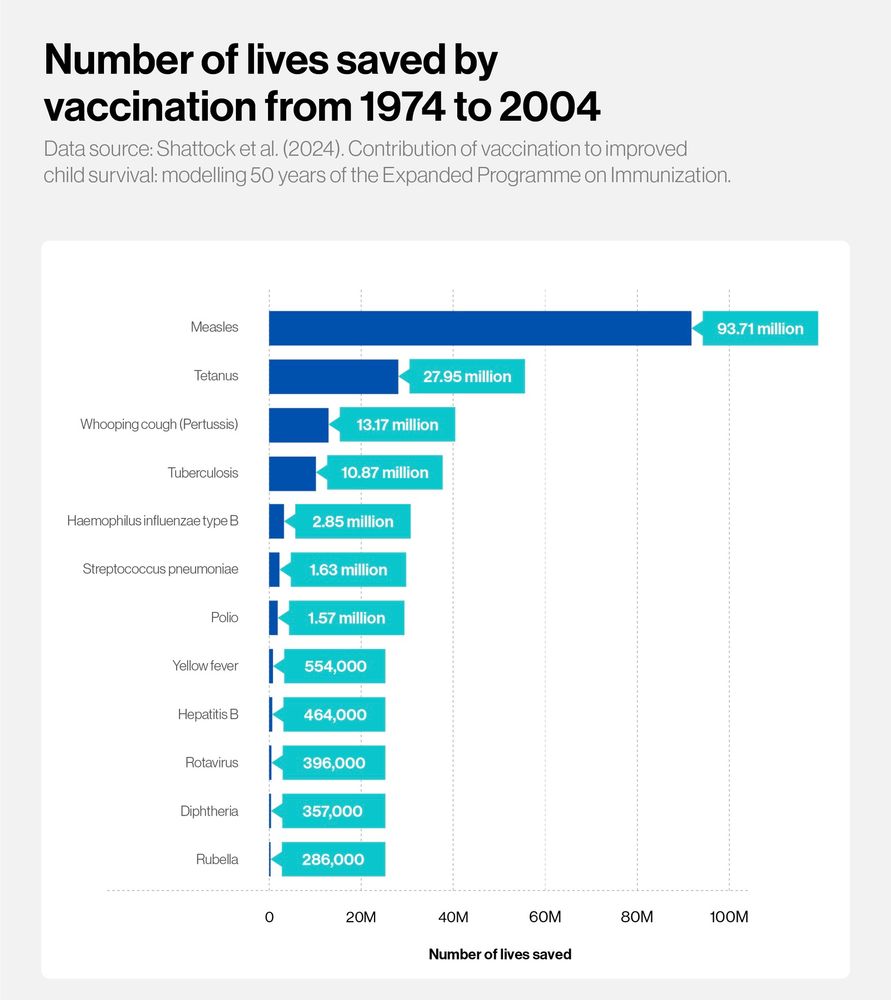
Chart: Number of lives saved by vaccination from 1974 to 2004
Data source: Shattock et al. (2024). Contribution of vaccination to improved child survival: modelling 50 years of the Expanded Programme on Immunization.
Credit: Gavi Alliance
Vaccines are one of the most important inventions humans have ever made. Period.
15.11.2024 04:49 — 👍 4263 🔁 1137 💬 74 📌 32

9 of the first 10 months this year, and 15 of the last 16 months exceeded 1.5°C global average surface air temperature compared to pre-industrial levels.
More information on the 1.5°C limit: climate.copernicus.eu/why-do-we-ke...
18.11.2024 11:09 — 👍 96 🔁 56 💬 2 📌 12

Estensione dei ghiacci marini, situazione al 16 novembre. Nelle aree cerchiate di nero la concentrazione di banchisa è ben inferiore al 15%, questo significa che rispetto alla media climatica 1981-2010 mancano circa 1.8 mln di kmq di ghiaccio. Il ricongelamento autunnale è ogni anno più lento... 1/2
18.11.2024 09:51 — 👍 278 🔁 45 💬 8 📌 1

Graph showing ECMWF ERA5 global temperature data. Monthly anomalies relative to 1850-1900 preindustrial baseline.
It has the text:
"Global warming reached an estimated 1.45°C in October 2024.
If the 15-year warming trend leading up to then continued, global warming would reach 2°C by August 2039"
And shows the trend line reaching above IPCC projections.
🌍🌡📈
"Global warming reached an estimated 1.45°C in October 2024.
If the 15-year warming trend leading up to then continued, global warming would reach 2°C by August 2039"
The trend line reaches above IPCC projections.
@copernicusecmwf.bsky.social ERA5 temp data relative to 1850-1900.
16.11.2024 12:45 — 👍 171 🔁 61 💬 7 📌 7

Line graph time series of global mean surface temperature anomalies for each September from 1850 through 2024. There is a long-term increasing trend and large year-to-year variability. The mean surface temperature anomaly in October 2024 was 1.32°C globally. Anomalies are computed relative to a 1901-2000 climate baseline. Data from NOAAGlobalTemp v6.0.0.
🚨 Last month was the 2nd warmest October on record globally. It was the *warmest* if only considering land areas. Yikes!
+ Data from NOAAGlobalTemp version 6.0.0: www.ncei.noaa.gov/products/lan...
+ Check out the NOAA State of the Climate Report for last month: www.ncei.noaa.gov/access/monit...
15.11.2024 13:00 — 👍 539 🔁 156 💬 22 📌 16

Polar stereographic map showing 2-m air temperature anomaly trends for Novembers from 1979 to 2023. All areas are warming in the Arctic.
November has observed some of the largest temperature trends in the #Arctic, especially over areas with decreasing sea ice cover. Arctic amplification is largest in the boreal fall.
If you see red, that means it's warming.
Data: @copernicusecmwf.bsky.social ERA5. More info: doi.org/10.1175/BAMS...
14.11.2024 13:16 — 👍 121 🔁 39 💬 2 📌 4
Seva Gunitsky, associate professor of political science, University of Toronto. http://individual.utoronto.ca/seva/. book: http://amzn.to/2oRD2yG. substack: https://hegemon.substack.com/
Retired Professor of Inclusion and Diversity in Education. Worked in a comprehensive school, PRU, special school, FE college as a manager and various universities.
IL MONDO SAREBBE PIU'PACIFICO SE FOSSIMO TUTTI ATEI. (J. Saramago) 01/01/1947, ANTIFASCISTA, AMO I GATTI NERI, SCRIVO IN MAIUSCOLO, MA NON URLO. FREE PALESTINA, SI LGBTQ+NO WAR, NO TRUMP, NO MUSK, SUB, https://www.instagram.com/emilio.puccio.beretta/#
Analista del Sistema globale e le sue crisi (climatica, geopolitiche, sociopolitiche). Ex giornalista freelance. Per contatti: italiafuturo2040@gmail.com
Historian @ruhistorydept.bsky.social
Immunologist & science communicator based at UoM fascinated by our immune response to threats (pathogens, pollution) & microbiome & how this exposome affects health. Also quite likely to share random dog and nature pics 🧪👩🔬 #AcademicSky #SciCom
Energy, Environment & Transport journalist for Euractiv in Paris
stefano.porciello@euractiv.com | opinions are my own + usual disclaimers
Menswear writer. Editor at Put This On. Words at The New York Times, The Washington Post, The Financial Times, Esquire, and Mr. Porter.
If you have a style question, search:
https://dieworkwear.com/ | https://putthison.com/start-here/
1) Income inequality; 2) Politics; 3) History; 4) Soccer.
Author of "Global inequality" and "Capitalism, Alone" (2019).
Stone Center, CUNY; LSE, London
Climatologist & Weather Historian.
www.mherrera.org/temp.htm
https://en.wikipedia.org/wiki/User:Maxcrc
Weather news. Climatic statistics and records. By M. Herrera
@extremetemps in all networks
🏝️ isleño. canary islander. international affairs. commons. post/de/anti-colonial. anti-racism. Free Palestine. 🗣️ views are strictly mine.
✍️ Español / English / Français / Português
Sito web di cultura e società
Full professor - history of psychology and Modern History - Università del Molise
Columnist “Huffington post Italia” “il patriottismo è l’ultimo rifugio dei mascalzoni”
Single mom to EDS zebra. Pro snuggler of kittens, reluctantly stuck in the south. Bryn Mawr, TempleU, Harvard.
Social psychology, political/social science research, author, foodie. Posts are cats; replies are 😉. Go birds! 🦅
Co-founder of @blue1by1.org
Financial writer. Markets & charts. Open to freelance or full-time work. 2 Corinthians 5:21
Fiscal policy wonk at Center on Budget & Policy Priorities| Former Biden-Harris White House National Economic Council | Former Senate Aide | CAP/JEC Alum | Brock Purdy Fan Club Founder
Scottish historian & art historian; @EmpirePodUK.bsky.social podcaster & Jaipur Lit Fest co-director. Visiting Fellow at All Souls, Oxford. Writes the occasional book.
Reporter at @Gizmodo.com.
I’ve been writing about the history of futurism at @Paleofuture.com since 2007.
Email: mnovak@gizmodo.com
Signal: mattnovak.11
Appellate lawyer at Wright, Close & Barger in Houston, with a Fifth Circuit and TX appellate practice. So-called Dean, #appellatetwitter. Host of The Appellate Wanderer podcast
Temerty Professor of Modern European History, Munk School, University of Toronto; Permanent Fellow, IWM Vienna; Emeritus Levin Professor, Yale. Author of "On Freedom," "On Tyranny," "Our Malady," "Road to Unfreedom," "Black Earth," and "Bloodlands"