grant proposal actual research
20.02.2026 12:50 — 👍 6 🔁 3 💬 0 📌 1

Supporting exciting biological sciences ideas and impacts on AI and biotechnology
If anyone is interested in writing an NSF PRFB applications on the intersection of AI, disease forecasting, and understanding drivers of transmission (or related topics), please reach out! I think it would be a great fit with the work happening in our lab: www.nsf.gov/bio/updates/...
19.02.2026 22:23 — 👍 3 🔁 2 💬 0 📌 0
Thanks @sbfnk.bsky.social, yes there does seem to be some traction progress in a few places which is great news.
19.02.2026 11:12 — 👍 0 🔁 0 💬 0 📌 0
Great talk on composable infectious disease modelling. Making real-time outbreak modelling more principled and flexible has been a long-standing challenge, and Sam has been leading the charge on solving it. With a growing group of people keen on this it feels like we're finally getting somewhere.
19.02.2026 10:43 — 👍 12 🔁 4 💬 1 📌 0

Design and analysis to estimate diagnostic test accuracy without universal verification at University of Bristol on FindAPhD.com
PhD Project - Design and analysis to estimate diagnostic test accuracy without universal verification at University of Bristol, listed on FindAPhD.com
📣 PhD studentship - Biostatistics 💻
University of Bristol, UK
Help improve methods for something that affects us all - how accurate are tests for disease?
Learn, apply & develop Bayesian models to estimate accuracy from varying study designs, synthesise evidence & optimise design of future studies
18.02.2026 21:40 — 👍 8 🔁 5 💬 1 📌 0
Thanks! Totally agree.
17.02.2026 22:50 — 👍 1 🔁 0 💬 0 📌 0
I think composable models are the future, and it would be great to have more tools for building composable models. This is a nice talk about the benefits
17.02.2026 15:15 — 👍 20 🔁 4 💬 2 📌 0
Really cool that @kaitejohnson9.bsky.social is giving a keynote at the next Stan conference!
17.02.2026 14:40 — 👍 5 🔁 1 💬 0 📌 0
How the processes of recuperation vitiate apparent methodological advances in medical research, from meta-analysis to Mendelian randomization
17.02.2026 08:26 — 👍 15 🔁 7 💬 1 📌 1
As ever I was actually thinking of some specific examples here but hard to nicely discuss or study at the individual level
17.02.2026 09:49 — 👍 0 🔁 0 💬 0 📌 0
You would have so major censoring issues (as the real extreme casss won’t show up) but presumably you could do a study on this using lab GitHub orgs and some measure of output quality (always very tricky)
17.02.2026 09:48 — 👍 0 🔁 0 💬 1 📌 0
On the other hand maybe the vibing off of graphs skills are what we need in the age or perhaps llms improve code quality in these labs as those doing the code are usually pretty junior/untrained with little to no positive reinforcemen.
17.02.2026 09:48 — 👍 0 🔁 0 💬 1 📌 0
I have always thought that is a serious issue as it leaves so much room for errors and ambiguity. This would mean with llms we might expect reduced study quality from these folks.
17.02.2026 09:48 — 👍 0 🔁 0 💬 1 📌 0
The example I am thinking about here is the stereotype mid to senior academic who hasn’t looked at code in a decade and judges studies by vibing off of the graphs and the high level summaries.
17.02.2026 09:48 — 👍 0 🔁 0 💬 1 📌 0
My dog walk thought for the day: LLM coding tools must hit very differently for different levels of seniority(kind of obvious)
17.02.2026 09:48 — 👍 0 🔁 0 💬 1 📌 0
🤩 unfortunately it doesn’t include the discussion which I was pretty good but I think there’ is going to be a follow up.
16.02.2026 23:44 — 👍 1 🔁 0 💬 0 📌 0
Posterior-SBC now also with peer-review stamp in Statistics and Computing doi.org/10.1007/s112... (update your bib files)
09.02.2026 17:00 — 👍 25 🔁 5 💬 1 📌 1
Peer review gets a lot of kudos, but often it's the feedback we get direct from people we know and trust before a paper is even submitted that feels like it has the most significant impact on our work. These people usually show up in the acknowledgements, where they get almost no recognition at all.
16.02.2026 12:41 — 👍 9 🔁 2 💬 1 📌 0
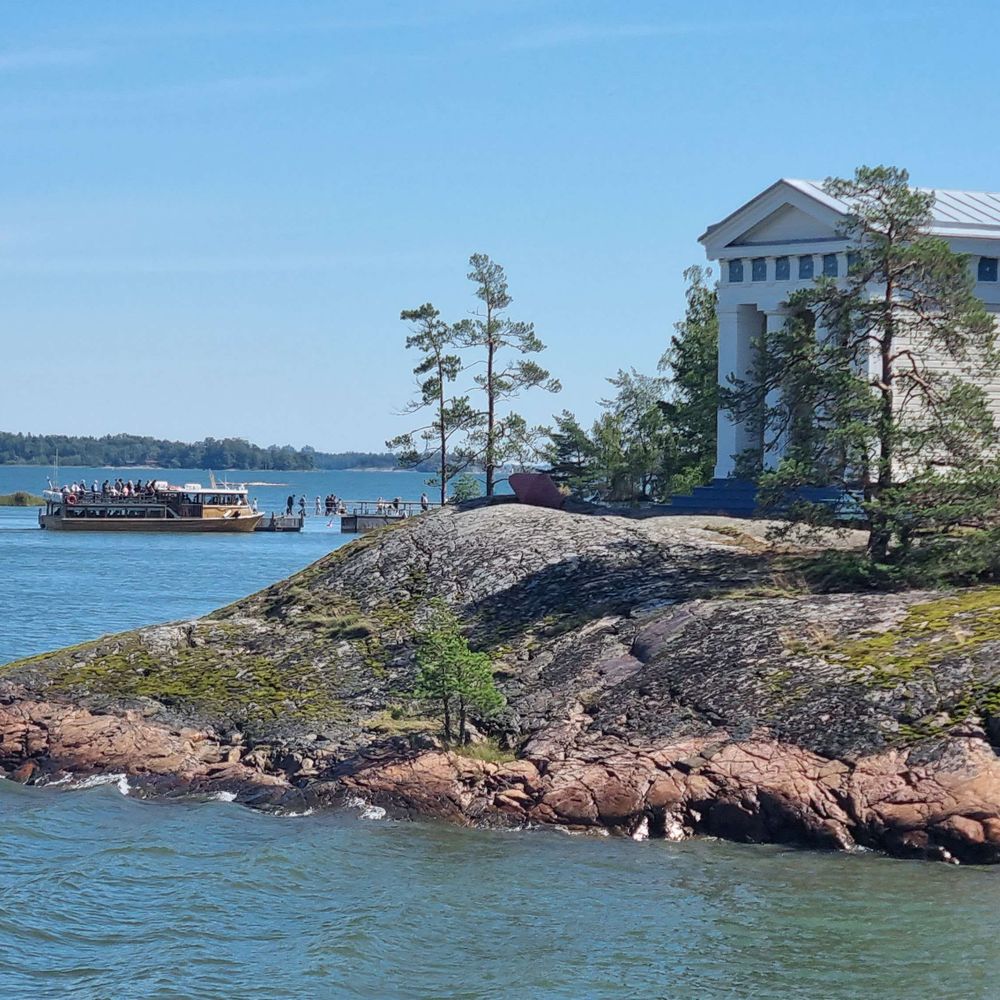
readme
If you want to read more about the work I presented on see: epiaware.org/ComposablePr...
16.02.2026 12:06 — 👍 3 🔁 0 💬 0 📌 0
YouTube video by Juniper Consortium Seminars
Sam Abbott (LSHTM): Composable probabilistic models can lower barriers to rigorous ID modelling
I had a great time talking at the Juniper seminar series last week about composable infectious disease models. Some very good discussion after the talk. The recording is now up!
youtu.be/FQYOqGnbJWA?...
16.02.2026 12:06 — 👍 24 🔁 3 💬 2 📌 2
🦹♂️ success
Slides and context for this here.
community.epinowcast.org/t/new-pre-pr...
Please be nicer about my figures than @josephlemaitre.bsky.social was as yes they don't look great but I tried hard 😢😉🥳
11.02.2026 16:24 — 👍 4 🔁 0 💬 0 📌 0
Modern Julia Workflows
Haha good to hear it!
I like modernjuliaworkflows.org a lot.
I also have a little list of stuff here: github.com/EpiAware/Cen... (github pages seems to be having problems!
There is some #julia stuff on here but I would also check out the julia discourse and slack both nice places
11.02.2026 16:22 — 👍 3 🔁 0 💬 1 📌 0
Claude and I are going to have lots of fun with this!
10.02.2026 17:32 — 👍 1 🔁 0 💬 0 📌 0
Thanks yes makes sense. In r land the standard is quarto which gives you both a notebook and running which I like but I do like the idea of literate being very light weight.
04.02.2026 19:32 — 👍 0 🔁 0 💬 0 📌 0
yes fair enough that makes sense.
04.02.2026 18:27 — 👍 1 🔁 0 💬 0 📌 0
*figure code
04.02.2026 18:22 — 👍 0 🔁 0 💬 0 📌 0

A conceptual figure outlining a protocol for using species distribution models to prioritize sampling for pathogens in wildlife

A scientific figure showing a case study of the protocol applied to Arenaviridae in rodents in India
🚨🐭🦠 New preprint!
Monitoring wildlife disease is expensive, so we need to be smart about where we sample to get as much useful info as possible.
We show how SDMs can guide adaptive sampling for zoonotic disease surveillance, using case studies in rodents.
15.12.2025 17:50 — 👍 14 🔁 8 💬 1 📌 0
PhD Student @ Univ. of Colorado Boulder (US) | DOE CSGF ‘25 | mostly bayesian stuff, quantitative ecologist, computer scientist | phenotypic plasticity, phenology, life history theory
http://milesalanmoore.github.io
The NIHR Health Protection Research Unit in Evaluation and Behavioural Science is a partnership between Bristol University and UKHSA, funded by NIHR.
ML & Data Engineer based in Helsinki. Expect Machine learning, AI and Big Data related posts. Also curious about astro and general maker related topics.
Groundbreaking foundational research in Big Data Management, Machine Learning, and their intersection. #AI #Research
www.bifold.berlin
📰News: www.bifold.berlin/news-events/news
🔑Data Privacy: www.bifold.berlin/data-privacy
Professor of Global Public Health | Head of Public Health l University of Glasgow | Infections | #Tuberculosis | #HIV | #epidemiology | #episky | #IDSky | #TBsky 🧪🛟
Biostatistics/bioinformatics at Charles University, 2nd faculty of Medicine. Bayesian in practice, but not a fan of Bayesian epistemology. Main on fedi: https://bayes.club/@modrak_m
Blog: https://martinmodrak.cz
AI correspondent at the Economist. I write about it, that is. I’m still human. One of literally dozens of people online who is not American.
Assistant professor of statistics at Dalhousie University. Stochastic processes and applications in ecology. https://theomichelot.github.io/
Associate Professor of Statistics at Università Cattolica del Sacro Cuore @unicatt.bsky.social. Doctor Europaeus 🇪🇺.
Mixture Models | Model-based clustering and classification | Health Analytics | Rstats
Website: http://andreacappozzo.rbind.io/
Engineer at Posit (fka RStudio), technical lead at quarto.org
Learning Brazilian Choro, the 7-string guitar, and to deal with the Minneapolis winter after 10 years in Tucson
Associate professor in Statistics at Uppsala University.
https://mansmeg.github.io/
Engineering Maths PhD student @ University of Bristol | MBiomed Integrated Master's degree @ Cardiff University | Infectious disease epidemiology🧪🧬🧠🌱
She/her
Postdoc at Bristol as part of the Henehan lab's PETRARCH project. Growing radiolarians for B and Si isotopes. Interested in all things marine silica.
Trees, AMR, Bayes.
Current: Postdoc @ Harvard Chan SPH
Prev: PhD @ Warwick
Interests: #machinelearning, #algorithms, #graphs, #networkscience
PhD Student at NetSI @ Northeastern University in London, UK
🔗 https://lalovic.com/
Bayesian modelling and computation - postdoc at MRC Biostatistics Unit, University of Cambridge
He/him/his. Associate Professor at Western University.
Work: #rstats, #psychometrics, #dyadic data, #MetaAnalysis, #closerelationships, Sexuality
Fun: All things cured, fermented, roasted, seared, smoked, shaken, stirred, and swizzled.
Strategic center, University of Bern.
Mission: study and mitigation of risks from infectious diseases