Happy children's day to all
14.11.2024 06:03 — 👍 0 🔁 0 💬 0 📌 0
Done
14.11.2024 05:57 — 👍 0 🔁 0 💬 0 📌 0
Looks like a base ball bat
14.11.2024 05:56 — 👍 1 🔁 0 💬 0 📌 0
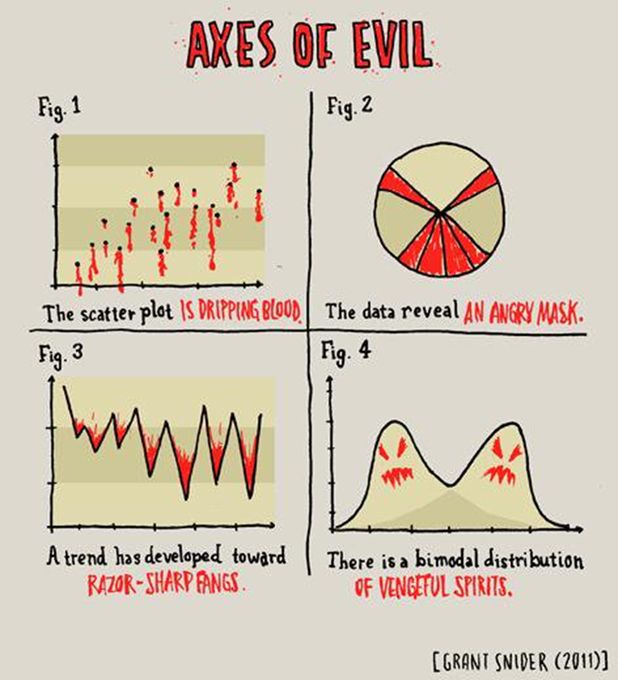
#stats #chartoon 📊
A day or two late for Halloween, but it's still worth remembering the Axes of Evil
03.11.2024 01:37 — 👍 33 🔁 8 💬 0 📌 0
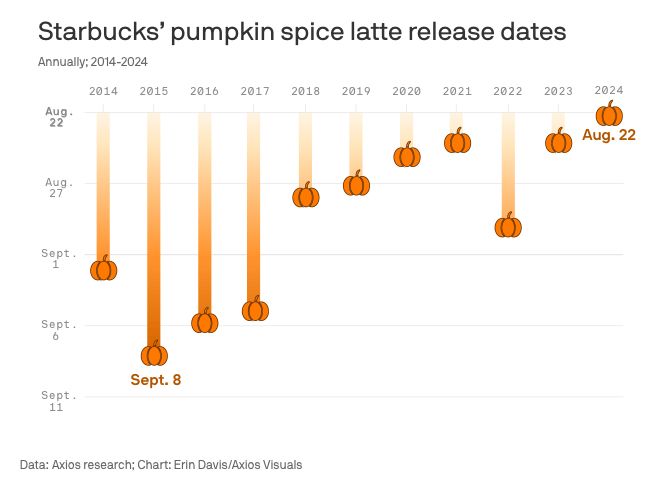
An orange column chart that shows the release date for Starbucks' pumpkin spice latte for each year from 2014 to 2024. 10 years ago, Starbucks didn't release the flavor until early September, but in most recent years, they've been releasing earlier in August. In 2024, the PSL will be available starting August 22.
For no reason whatsoever, please enjoy this PSL chart by @erindataviz.bsky.social. 📊
21.08.2024 16:46 — 👍 11 🔁 3 💬 1 📌 0
Review: Data Visualization with Microsoft Power BI: How to Design Savvy Dashboards - Nightingale
Design dashboards with 'Data Visualization with Microsoft Power BI,' a practical guide for business analysts by Kolokolov and Zelensky.
📊 "Dashboards are not just tools for data discovery; they are also for facilitating communication among people."
In Clare Harvey's latest review, she dives into Data Visualization with Microsoft Power BI by Alex Kolokolov and Maxim Zelensky.
nightingaledvs.com/review-data-...
12.11.2024 15:58 — 👍 23 🔁 3 💬 0 📌 1
Please add me
14.11.2024 05:55 — 👍 1 🔁 0 💬 0 📌 0
🇮🇳 #DataAnalyst | 2x #TableauAmbassador | #NewbiesTUG Co-Lead | #MumbaiTUG Lead | #BusinessAnalyst | #BusinessIntelligence | Music Lover | ❤️#datafam | #dataviz | #datasky | #databs | #TableauNewbies
Data visualization researcher. Associate Prof of CS at the University of Utah. Lab website: https://vdl.sci.utah.edu. Co-founder of
datavisyn: https://datavisyn.io
Designer, journalist, and professor.
Author of 'The Art of Insight' (2023) 'How Charts Lie' (2019), 'The Truthful Art' (2016), and 'The Functional Art' (2012). NEW PROJECT: https://openvisualizationacademy.org/
Writing about tech, power, data visualization, social media, disability. Assistant prof of computational media @ MIT. 🇹🇼
crystaljjlee.com
Assoc Prof Computer Science and Communication Studies at Northwestern. Infovis, HCI. Author of tidybayes & ggdist R pkgs. he/him. 🏳️🌈 https://mjskay.com/
Co-director https://mucollective.northwestern.edu
Co-founder https://journalovi.org
Visualisation and graphics @posit.co
Classic Generative Art Weirdo using 🖤 and R: http://thomaslinpedersen.art and http://deca.art/thomasp85
he/him
Digital humanities, data science, AI, eating, professor of Data & Decision Science and English. Coauthor #DataFeminism w/ @kanarinka. PI #AIAInetwork. Views my own.
Visualization toolmaker. Founder of Observable. Creator of D3. Former NYT Graphics. Pronounced BOSS-tock.
Asst Professing at MIT CSAIL. Data visualization, ML interpretability, accessibility, cognitively convivial information.
Ginni Rometty Prof @NorthwesternCS | Fellow @NU_IPR | Uncertainty + decisions | Humans + AI/ML | Blog @statmodeling
Professor of Visual Analytics who does datavis, visualization storytelling and natural travel. Did I mention visualization?
Interested in all things visual and data, like data visualization. ISOTYPE collector, synth dabbler, runner.
Data Visualization & Biomedical Science. PhD in biology, trained in art, Associate Prof
Writes here: https://helenajamborwrites.netlify.app/
Principal Engineer at Posit (fka RStudio), technical lead at quarto.org
Learning Brazilian Choro and the 7-string guitar
ASA Fellow; #rstats developer of graphical methods for categorical and multivariate data; #datavis history of data visualization; #historicaldatavis; Milestones project
Web: www.datavis.ca
GitHub: github.com/friendly
Visualization, data, AI/ML. Professor at CMU (@dig.cmu.edu, @hcii.cmu.edu) and researcher at Apple. Also sailboats ⛵️ and chocolate 🍫.
www.domoritz.de
🦬🏔️ @cuboulder.info science prof
Vis / HCI - Designing data for the public.
📊❤️ PI @informationvisions.bsky.social
Previously: Bucknell CS prof, Tufts CS PhD
🔗 https://peck.phd/
#HCI researcher, assistant professor of computer science at the university of waterloo. previously {tableau | microsoft} research. interested in #visualization and ubietous information experiences. https://mattbrehmer.ca | https://ubixgroup.ca
Data Visualization researcher and Professor of Computer Science at the University of San Francisco. Research interests - Visualization Literacy, Mobile Data Visualization. Anti-Racist. Immigrant.
web: https://www.cs.usfca.edu/~apjoshi
Michigan faculty, http://www.cond.org