The viewof import syntax error is fixed here. I’ll publish a new release in the next day or two. Thanks for the bug report! github.com/observablehq...
03.08.2025 20:45 — 👍 2 🔁 0 💬 0 📌 0
@ocks.org.bsky.social
Visualization toolmaker. Founder of Observable. Creator of D3. Former NYT Graphics. Pronounced BOSS-tock.
The viewof import syntax error is fixed here. I’ll publish a new release in the next day or two. Thanks for the bug report! github.com/observablehq...
03.08.2025 20:45 — 👍 2 🔁 0 💬 0 📌 0You can also use import attributes (which allows you to self-host compiled notebooks):
import {figure, viewof$rotation} from "https://api.observablehq.com/@rreusser/drawing-3d-objects-with-svg.js?v=4" with {type: "observable"};
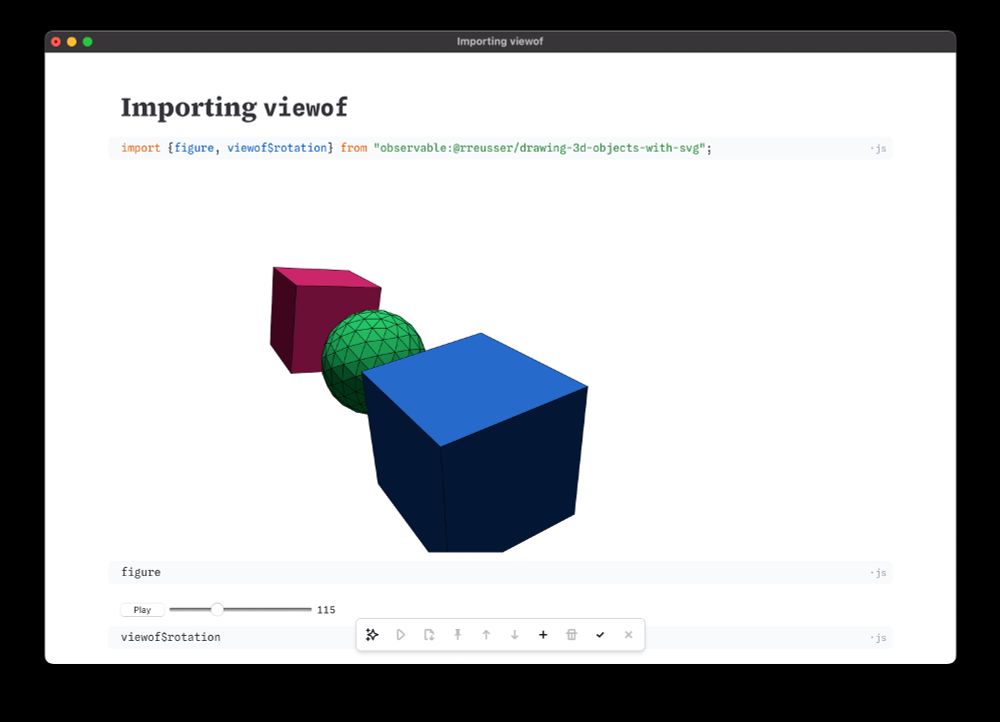
You can import a viewof in a vanilla JavaScript cell like this:
import {figure, viewof$rotation} from "observable:@rreusser/drawing-3d-objects-with-svg";
I can look into the ojs syntax error, but definitely recommend adopting vanilla JavaScript wherever possible! Thanks for the write-up.
I've been playing with the new Observable Notebooks 2.0 over the past days and I'm amazed. While still a preview I think it's already a serious alternative to R or Jupyter notebooks. Love that it works locally now and that notebooks are just HTML files with vanilla JS observablehq.com/notebook-kit/
02.08.2025 10:26 — 👍 37 🔁 8 💬 0 📌 1Yes, you can use page templates with Notebook Kit: observablehq.com/notebook-kit... You can see the one we made for our documentation site here: github.com/observablehq...
31.07.2025 18:27 — 👍 3 🔁 0 💬 1 📌 0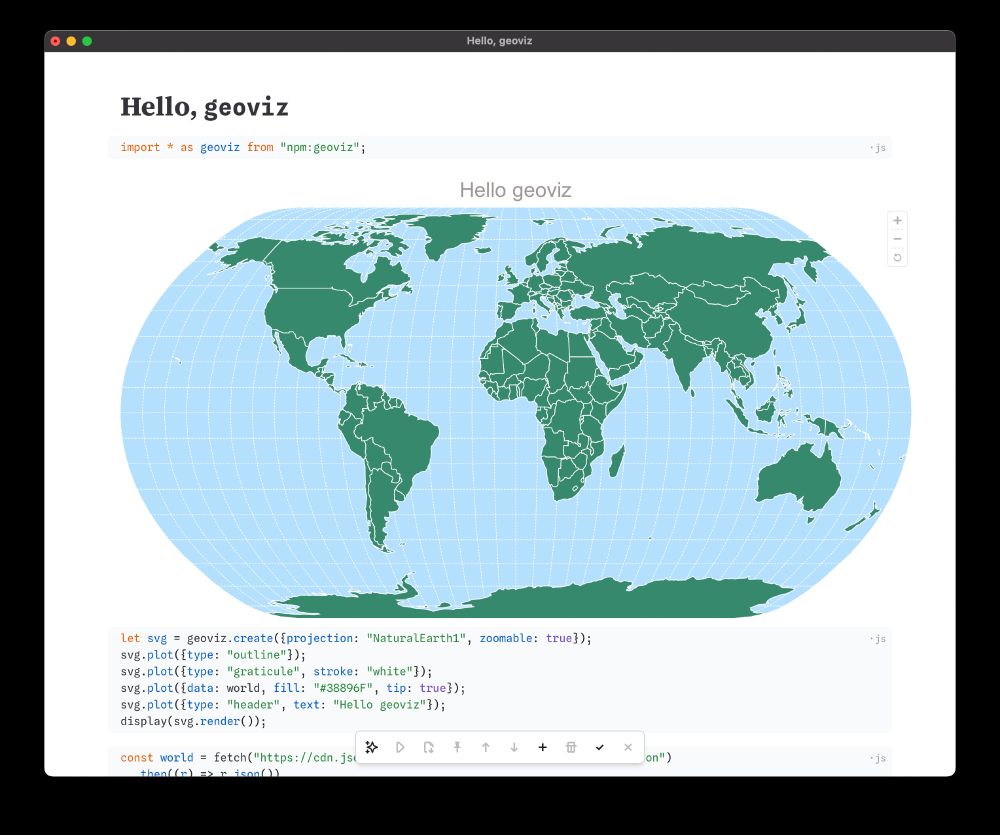
A screenshot of Observable Desktop showing a JavaScript cell importing the geoviz library, followed by a JavaScript cell rendering a world map.
Thanks for sharing, Nicolas! One tip, if you like you can use static imports in (vanilla) JavaScript cells now:
import * as geoviz from "npm:geoviz";
Mutable is still there, just as a function rather than a nonstandard operator. It’s the same as in Framework (though not currently importable; just available by default). observablehq.com/framework/re...
31.07.2025 13:02 — 👍 1 🔁 0 💬 0 📌 0Thanks for the suggestions. We recommend our editor (Observable Desktop, and a future web-based editor) if you want an easy way to edit notebooks.
31.07.2025 13:00 — 👍 1 🔁 0 💬 0 📌 0Happy to help, reach out if you have any questions about the Notebook Kit API. Would also love any contributions back.
30.07.2025 15:08 — 👍 3 🔁 0 💬 1 📌 0You don’t have to use Observable Desktop to author notebooks. We designed the file format (HTML) to be easily edited in standard editors. Desktop is just a specialized editor intended to be best in class for this purpose.
30.07.2025 15:07 — 👍 1 🔁 0 💬 0 📌 0Notebook Kit calls this the “build” command which likewise produces runnable HTML. It’s about half self-hosted currently, but if we add some more npm: import resolution to the Vite plugin we could make it fully self-contained. Being built on Vite gives a lot of leverage.
30.07.2025 15:06 — 👍 2 🔁 0 💬 0 📌 0Notebook Kit exposes a low-level Build and Runtime API which can help with this.
30.07.2025 15:03 — 👍 1 🔁 0 💬 0 📌 0
Please try out Observable Desktop and Observable Notebook Kit today. We’d love your feedback, bug reports, ideas, etc.! github.com/observablehq...
29.07.2025 14:38 — 👍 10 🔁 0 💬 1 📌 0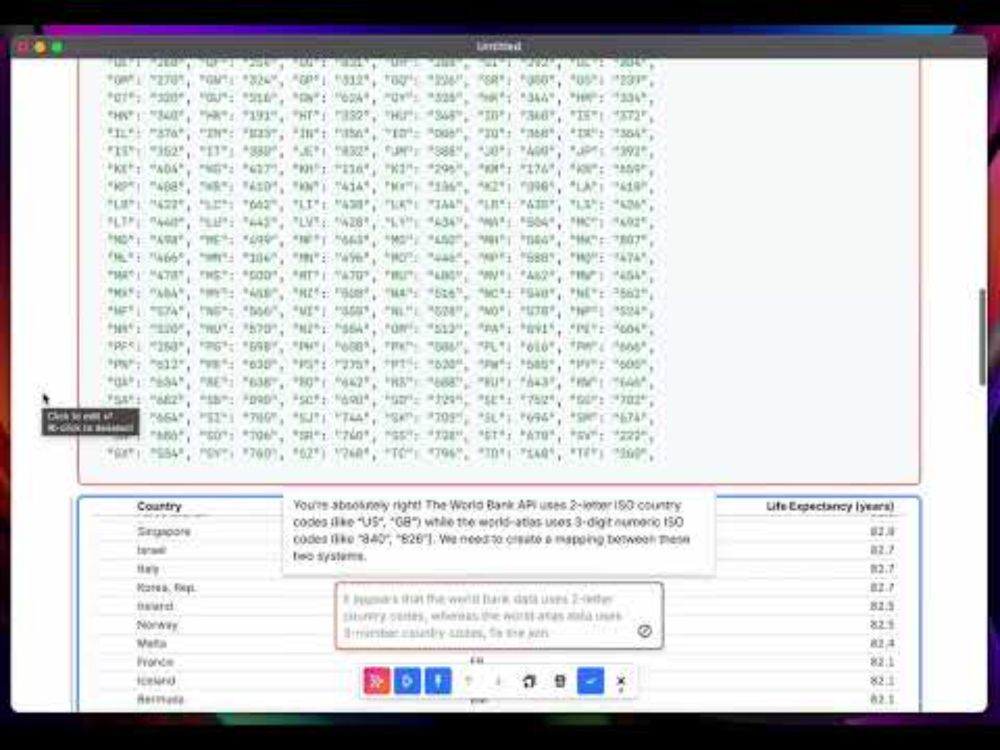
And last, the new editor’s AI is pretty mind-blowing 🤯, focused on quick ideation and iteration… www.youtube.com/watch?v=BeH6...
29.07.2025 14:38 — 👍 15 🔁 0 💬 1 📌 0Third, we’ve built a whole new streamlined editor for Notebooks, focused on a clean interface and a great developer experience. observablehq.com/notebook-kit...
29.07.2025 14:38 — 👍 5 🔁 0 💬 1 📌 0Second, Notebooks 2.0 is now (finally) vanilla JavaScript! It’s the standard syntax that works everywhere and like you expect. Say goodbye to quirky Observable JavaScript, and hello to const, let, static import, etc. observablehq.com/notebook-kit...
29.07.2025 14:38 — 👍 8 🔁 0 💬 1 📌 0First and foremost, we’re unlocking file-based workflows for notebooks — edit them locally, check them into git, build them in CI, self-host them as superfast static sites, integrate them into custom apps, etc. etc. We’re doubling down on file over app.
29.07.2025 14:38 — 👍 9 🔁 0 💬 1 📌 0Notebooks 2.0 is here! 📓🔮 Previewing today: Notebook Kit, an open file format for notebooks with open-source tooling for generating static sites; and Observable Desktop, a macOS desktop application for editing notebooks as local files, with a radical new approach to AI. observablehq.com/notebooks/2/
29.07.2025 14:38 — 👍 58 🔁 25 💬 2 📌 4Our goal is to make visual exploration (+ AI) sufficient for common use cases, but also fully embrace code if you want or need it. It’s unusual to be pushing on both ends of the power spectrum like this, but this is how we make canvases cross-functional, bringing data team & business users together.
15.04.2025 15:14 — 👍 3 🔁 0 💬 1 📌 0I wouldn’t characterize it as no-code. You can use as much code as you want (SQL or JavaScript), and seamlessly mix code with direct-manipulation visual exploration.
15.04.2025 15:10 — 👍 3 🔁 0 💬 1 📌 0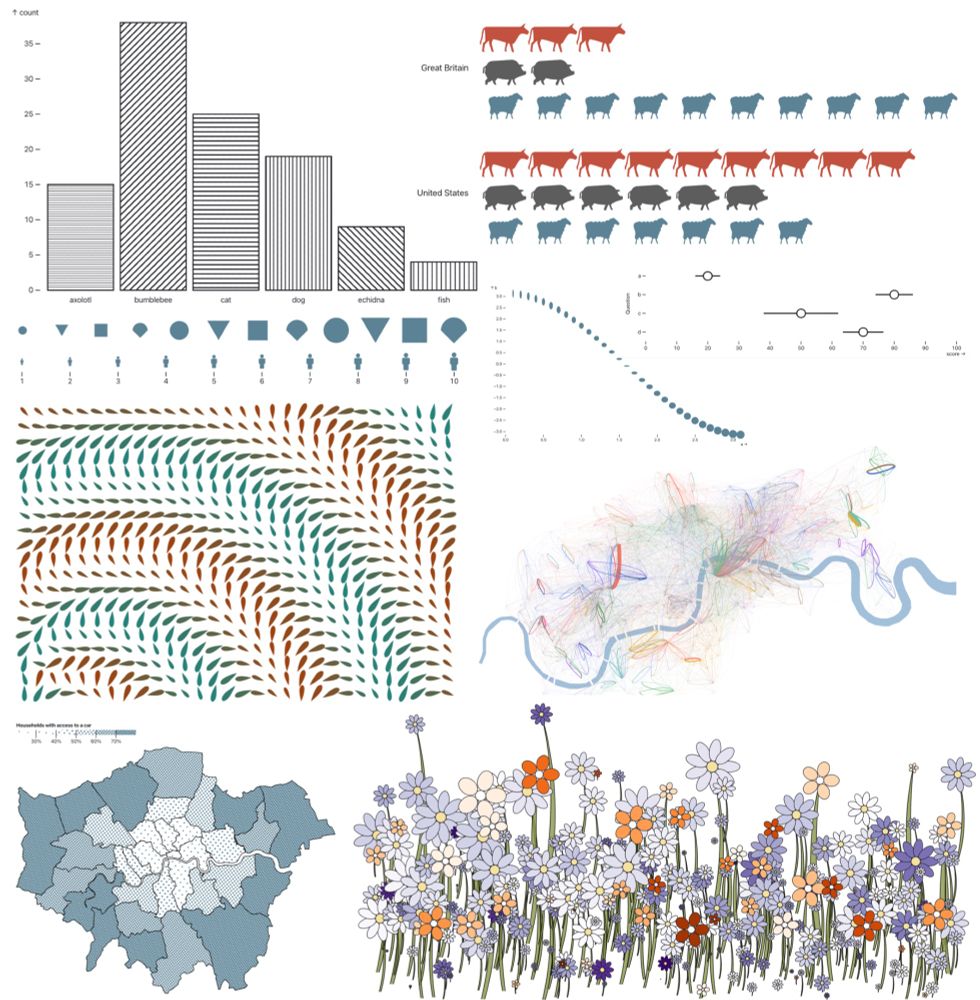
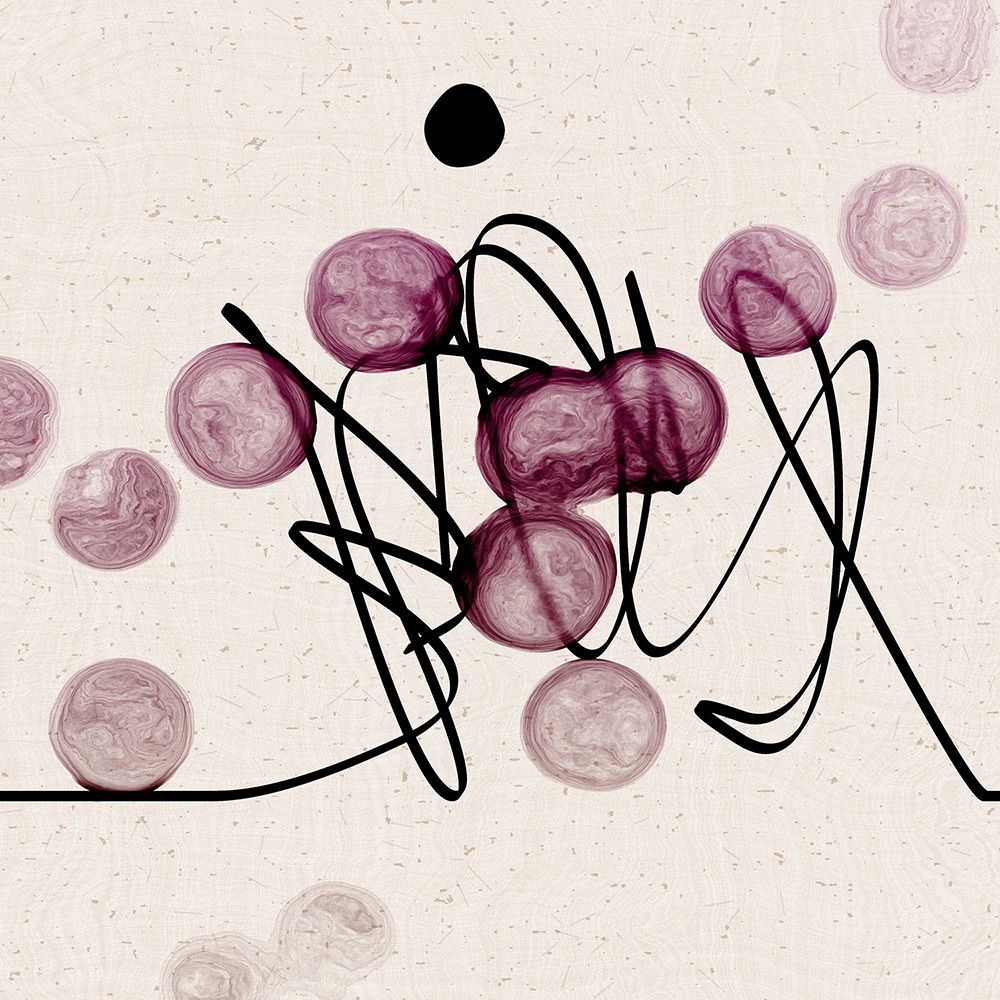
A selection of custom marks generated with Observable Plot. From top to bottom: A categorical bar chart with black hachured patterns in 6 different directions; A faceted bar chart using Isotope symbols showing cattle, pigs and sheep in red, grey and blue; a sequence of geometric symbols in blue gradually increasing in size: circle, triangle, square and fan, repeating 3 times, below which is a sequence of 12 human-like figures also increasing in size; A curve made up of ellipses that transition from vertical to horizontal to cicrcular shapes; a set of thee dot and whisker symbols in black and white; an abstract geometric arrangement of teardrop shapes in green to brown colours forming concentric bands away from the bottom left; a map of cycle hire journeys in London represented by asymmetric curves in a range of colours, overlaid over the river Thames; a map on London boroughs symbolised with dots of varying density with the highest density of dots towards the outside, lowest in the centre; a 'chart' of flowers of different shades of purple and orange.
Want to create your own custom marks in @observablehq.com Plot, but don't want to go full D3?
I've created a guide with 6 approaches of varying sophistication for specifying reusable custom marks:
observablehq.com/@jwolondon/h...

AMA about my love of maps
observablehq.com/blog/maps-an...
thanks @allisonhorst.bsky.social for the cosy chat
Kinda cryptic, but here’s a quick take on a “pivot longer” transform in Plot: observablehq.com/d/1913762d16...
17.12.2024 02:22 — 👍 3 🔁 0 💬 0 📌 0I’d love if you wrote more approachable guides to Plot though!
16.12.2024 23:08 — 👍 0 🔁 0 💬 0 📌 0FWIW we attempted to document the common expected shape of data here:
observablehq.com/plot/feature...
observablehq.com/plot/feature...
(Though the tip semantics change when you use multiple marks: you end up with one tip per series rather than one tip across series…)
16.12.2024 23:01 — 👍 1 🔁 0 💬 0 📌 0Totally valid to use multiple marks, too. You can avoid repeating yourself or hard-coding colors by mapping an array, e.g., ["AAPL", "GOOG", "IBM", "AMZN"].map((y) => Plot.lineY(stocks, {x: "Date", y, stroke: () => y})). observablehq.com/d/471ba8fb2e...
16.12.2024 22:59 — 👍 0 🔁 0 💬 1 📌 0Plot prefers “tidy” data. (And Plot doesn’t really “prefer” array-of-objects; it uses columnar data internally. The most performant approach is to pass arrays of values to each channel, but array-of-objects is ubiquitous in JavaScript, so we make that easy.) vita.had.co.nz/papers/tidy-...
16.12.2024 22:59 — 👍 5 🔁 2 💬 1 📌 0The attention to detail is impressive. Good work!
27.11.2024 05:56 — 👍 4 🔁 0 💬 0 📌 0
@fil.rezo.net and I are working on further improvements to the waffle mark, including better tooltips, better stroke, and a better default unit for very large or very small values. github.com/observablehq...
20.11.2024 20:47 — 👍 3 🔁 1 💬 0 📌 0