Beer prices of popular brands have seen a steady rise from 2015 to 2025 🍺
Visual Capitalist explores the data: https://www.voronoiapp.com/category/The-Rising-Beer-Prices-of-Popular-Brands-20152025-7587

@voronoiapp.bsky.social
Where data tells the story. The new app from now available on iOS and Android.
Beer prices of popular brands have seen a steady rise from 2015 to 2025 🍺
Visual Capitalist explores the data: https://www.voronoiapp.com/category/The-Rising-Beer-Prices-of-Popular-Brands-20152025-7587

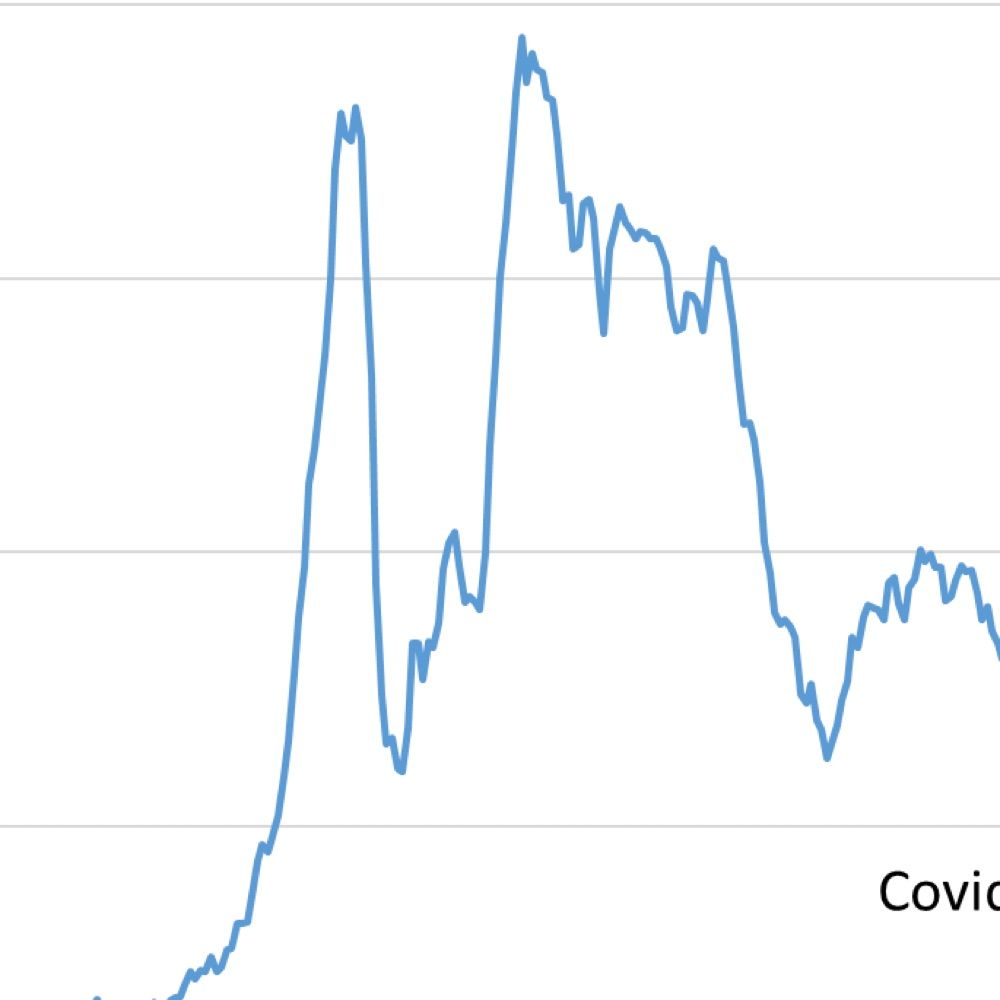
Charting the complex data behind the devastating Syrian Civil War 📊
World of Data explores the details and examines the statistics: https://www.voronoiapp.com/category/Charted-The-Data-Behind-the-Devastating-Syrian-Civil-War-7631

Discover the landscape of Applicant Tracking Systems by market share 📊
Shodhan Shetty breaks down the crucial data here: https://www.voronoiapp.com/category/Applicant-Tracking-Systems-by-Market-Share-7625

Venture into the accelerating world of Global R&D Spending Growth from 2000 through 2024 📈
Visual Capitalist uncovers the key statistics: https://www.voronoiapp.com/category/Global-RD-Spending-Growth-20002024-7586

Explore trends in the price of a Big Mac in different countries from 2000 to 2025 🍔
Datylon Data Visualizations unveils the insights at https://www.voronoiapp.com/category/The-Big-Mac-Index-Price-Trends-by-Country-2000---2025-7618

1 in 4 American households are now classified as "No Income" 🏠
Visual Capitalist breaks down the data behind this concerning trend: https://www.voronoiapp.com/category/25-of-US-Households-Considered-No-Income--7572

Bullying affects 13-15 year old students: what's the statistical reality? 🎒
Arciom Antanovič delves into the data of this troubling trend: https://www.voronoiapp.com/category/Percentage-of-students-aged-13-15-who-reported-being-bullied-in-the-past-30-days-7623

Curious about the world’s wealthiest in 2026? Get insights into the top 20 billionaires' ranking now! 💰
Visual Capitalist unpacks the data for you here: https://www.voronoiapp.com/category/Ranked-The-Worlds-Top-20-Billionaires-in-2026--7569

Discover First Eagle's high-conviction new buys for Q4 2025 🦅
Jimmy Swaggart breaks down the key data: https://www.voronoiapp.com/category/First-Eagles-Q4-2025-HighConviction-New-Buys-7624

Explore the 25 most hectic and reliable airports across the U.S. ✈️
Chris Consigli dives into the details with this data-rich snapshot: https://www.voronoiapp.com/category/Most-Reliable-Airports-Top-25-Busiest-Airports-in-the-US-7595

Ready to get a glimpse of who's powering global economic growth in 2026? 🌍
Visual Capitalist takes a look at the key data here: https://www.voronoiapp.com/category/Whos-Powering-Global-Economic-Growth-in-2026-7585

As the Indian Government spends ₹1, where does each paisa go?💰
Finance Sutras breaks down the flow: https://www.voronoiapp.com/category/Indian-Governments-Money-Flow--1-Explained-7606

Explore the transformation in Gross National Income per capita from 2004 to 2024 across the world's leading nations 💸
Harris Saleem uncovers the shifts in the economic landscape: https://www.voronoiapp.com/category/Ranked-The-Top-15-Countries-by-GNI-Per-Capita-2004-vs-2024-7593

Discover which nations are experiencing the most dramatic increases in life expectancy ⬆️
Visual Capitalist analyzes the data here: https://www.voronoiapp.com/category/Countries-With-the-Biggest-Gains-in-Life-Expectancy--7573

Uncover the realities of U.S. median income across different household sizes 🏠
Visual Capitalist breaks it down for us right here: https://www.voronoiapp.com/category/US-Median-Income-by-Household-Size-7520

Ever wondered what keeps a billionaire awake at 2 am in 2026?💼
Visual Capitalist breaks down this intriguing question: https://www.voronoiapp.com/category/Whats-Worrying-Billionaires-the-Most-in-2026-7602

Uncover the landscape of self-employment rates in each U.S. state 🌐
Visual Capitalist breaks down the data here: https://www.voronoiapp.com/category/Mapped-Self-Employment-Rates-by-US-State--7561

Discover the globe's most bustling air routes by region ✈️
Visual Capitalist breaks it down in detail: https://www.voronoiapp.com/category/The-Worlds-Busiest-Flights-by-Region--7558

In a massive leap forward, the UAE is now leading the world in AI adoption 🚀
Visual Capitalist unpacks this trend with some intriguing data: https://www.voronoiapp.com/category/The-UAE-Leads-Globally-in-AI-Adoption--7560

Ever wondered about grocery costs relative to income across the U.S.? 🛒
Visual Capitalist takes a look at the data: https://www.voronoiapp.com/category/Grocery-Costs-as-a-Share-of-Income-by-US-State--7563

Check out the hits and misses in the world of currencies in 2025 💱
Vikas Gautam breaks down the data for you here: https://www.voronoiapp.com/category/The-Best-and-Worst-Performing-Currencies-of-2025-7597

Witness the surprising ascend of major currencies against the USD in 2025 💵
Visual Capitalist unpacks the data that shows this unexpected trend:
https://www.voronoiapp.com/category/The-Rise-of-Major-Currencies-Against-the-USD-in-2025--7566

Witness the change in the top 15 countries' standings based on GNI per capita from 2004 to 2024 🌍
Harris Saleem breaks it down for us: https://www.voronoiapp.com/category/Visualized-The-Top-15-Countries-by-GNI-Per-Capita-2004-vs-2024-7593

S&P 500 reaches new heights - 6,979 Index Level and $62.3 Trillion Market Capitalization 📈
Ehsan Soltani reveals the insights at https://www.voronoiapp.com/category/-SP-500-Sets-New-Records-6979-Index-Level-and-623-Trillion-Market-Capitalization-3005

Curious about Household Debt across different nations? 💸
Iswardi Ishak breaks it down for you in his new analysis: https://www.voronoiapp.com/category/Household-Debt-by-Country-7575

Explore who are China's biggest trade surplus partners in 2025 🌐
Aneesh Anand breaks it down: https://www.voronoiapp.com/category/Chinas-Biggest-Trade-Surplus-Partners-in-2025-7588

Unearth the complex web of the U.S.' role in Venezuela's crisis through its court system ⚖️
Cristina Iani breaks down the intricacies: https://www.voronoiapp.com/category/The-Debt-Funnel-How-US-Courts-are-Filtering-Venezuelas-Crisis-7592

Curious about the global economic forecast? Take a peek into the world's largest economies by 2026 💼
Visual Capitalist crunches the numbers for us: https://www.voronoiapp.com/category/The-Worlds-50-Largest-Economies-by-GDP-in-2026-7526

Meet the biggest contributors to innovation with the highest number of patents to their name 🖋️
Shodhan Shetty examines the facts at https://www.voronoiapp.com/category/Top-Persons-With-Most-Patents-7580

Observe how life expectancy varies within major economies around the globe 📊
Visual Capitalist breaks down the data for us: https://www.voronoiapp.com/category/Comparing-Life-Expectancy-in-Major-Economies--7564