GitHub - ragnhildlaursen/NNMF: Neighborhood Non-Negative Matrix Factorization
Neighborhood Non-Negative Matrix Factorization. Contribute to ragnhildlaursen/NNMF development by creating an account on GitHub.
We are really proud of this work. Please try out NNMF on all of your gene count spatial transcriptomics data, whether you need hard clusters or scalable, interpretable, spatially aware dimension reduction! Feedback welcome!! github.com/ragnhildlaur...
29.04.2025 22:21 — 👍 1 🔁 0 💬 0 📌 0
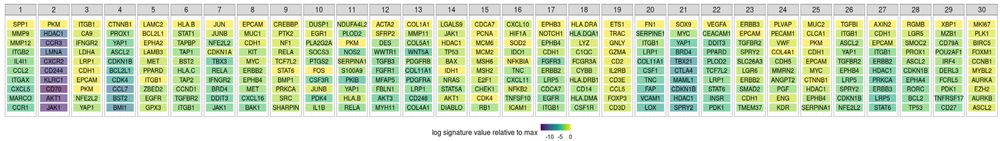
genes characterizing the 30 NNMF factors in the CRC data.
On these CRC data, we studied the factors based on their top ten genes. We found immune-dominated factors & factors capturing intra- and peri-tumoral stroma, among others. Importantly, some factors were shared x patients and some were patient specific, characterizing tumor-specific immune responses.
29.04.2025 22:21 — 👍 0 🔁 0 💬 1 📌 0
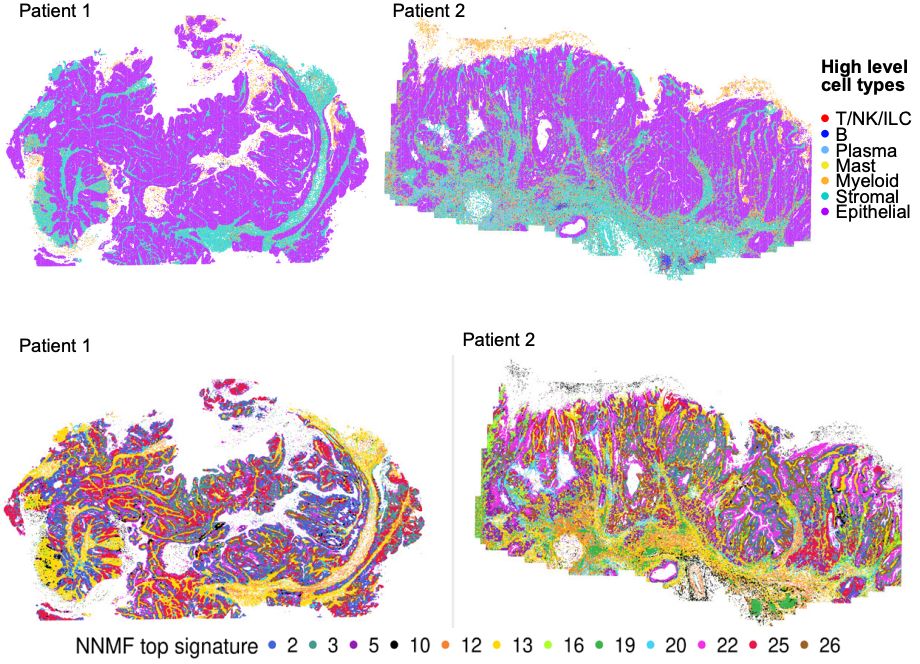
Top row: cell types in two patient samples; Bottom row: NNMF signatures in the same two samples, showing substantial complexity.
Then, we applied NNMF to MERFISH data publicly released by Vizgen (vizgen.com/data-release...) that includes 500 genes in ∼1.9 million cells from two human colon cancer samples. NNMF showed enormous complexity, where each factor included many cell types and identified detailed biological structure.
29.04.2025 22:21 — 👍 0 🔁 0 💬 1 📌 0
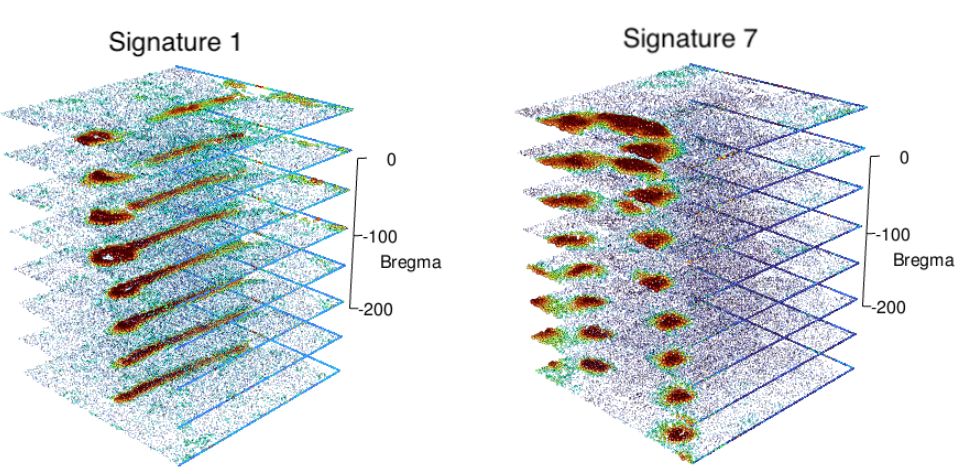
NNMF factor 1 and factor 7 across the 3D aligned brain slices.
On the same MERFISH mouse brain data, we aligned the eight parallel slices and ran NNMF on the 3D aligned data. NNMF easily labeled the important regions in 3D, and smoothed the factors across all three dimensions.
29.04.2025 22:21 — 👍 0 🔁 0 💬 1 📌 0
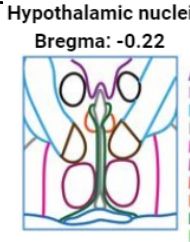
Manually annotated brain sample.
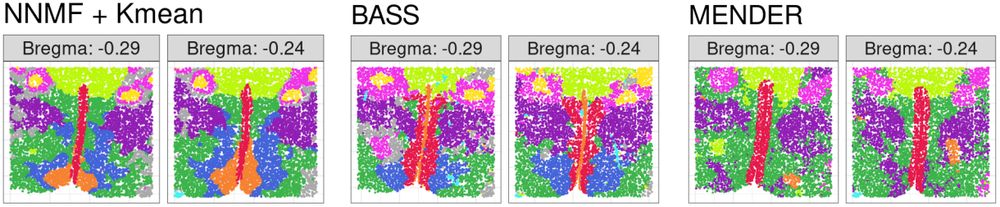
hard clustering for NNMF + Kmeans, BASS, and MENDER on two parallel samples.
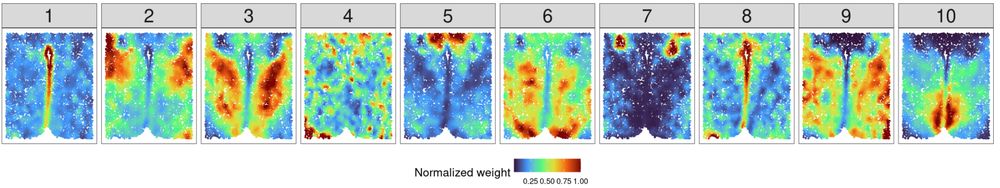
All of the ten factors from NNMF in a single sample, colored by weights.
Next, we ran NNMF on MERFISH single mouse hypothalamus data with eight parallel slices on each individual slice (2D). NNMF + K-means produces hard clusters that match the manual clustering well. But the real story is how much detail and biological complexity soft clusterings add. Vasculature!
29.04.2025 22:21 — 👍 0 🔁 0 💬 1 📌 0
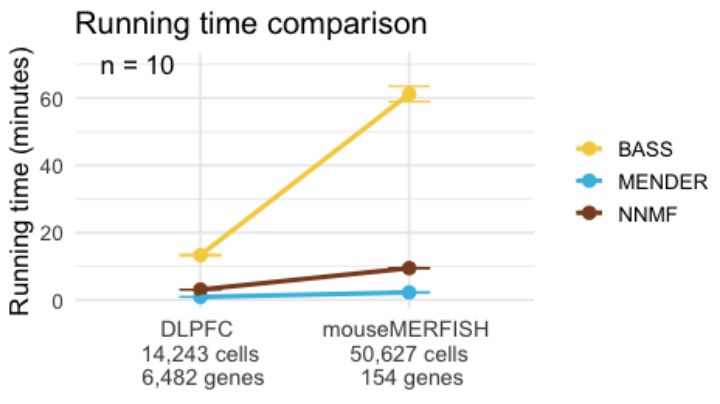
run time comparison for human brain and mouse merfish across BASS, MENDER, and NNMF.
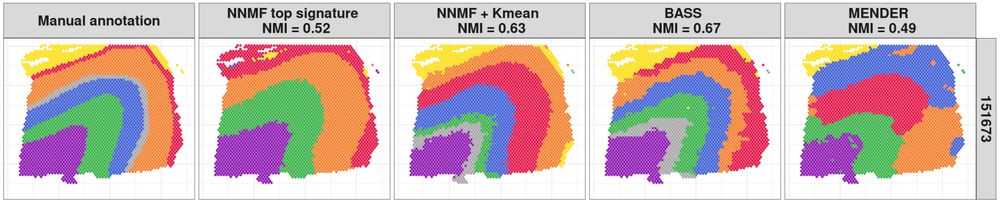
Hard clusters from a manual annotation, NNMF's top signature, NNMF+K-means, BASS, and MENDER on the human brain data.
On human brain 10X Visium data and mouse brain MERFISH data, we compared MENDER and BASS to NNMF in terms of run time, and found that MENDER is fastest and NNMF is a close second. However, MENDER uses cell type labels for the hard clustering, not gene counts, and produces poor clusterings.
29.04.2025 22:21 — 👍 0 🔁 0 💬 1 📌 0
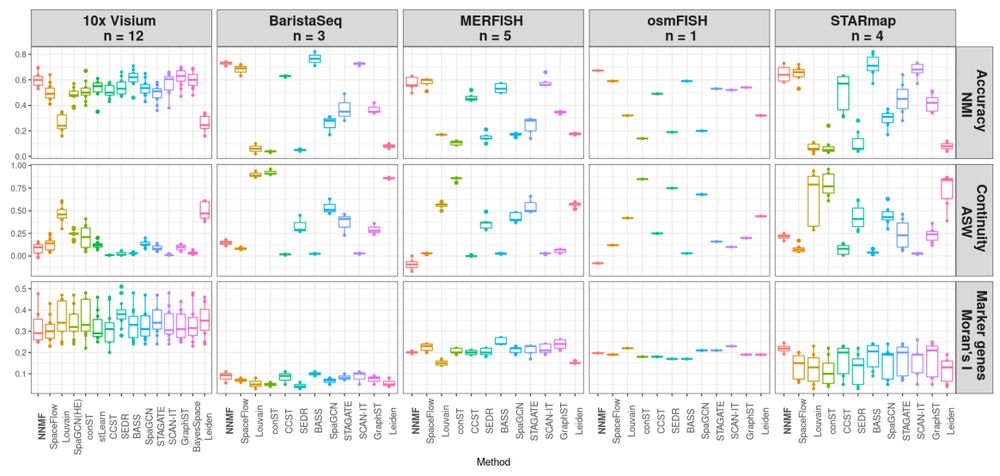
Benchmark comparison across five datasets and three metrics, for 15 different methods.
We use the very cool hard clustering benchmark system pubmed.ncbi.nlm.nih.gov/38491270/ and compared NNMF to fourteen state-of-the-art spatially-aware hard clustering methods, showing good performance of NNMF even in the hard clustering scenario.
29.04.2025 22:21 — 👍 1 🔁 0 💬 1 📌 0
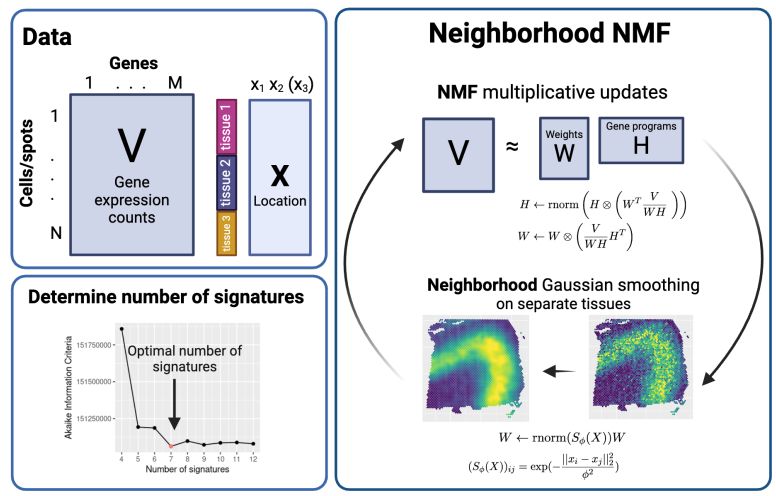
Graphical description of Neighborhood NMF, including its input and how we determined the number of factors.
NNMF works by using standard NMF updates, but using Gaussian smoothing of the factor weights on each spot at each iteration that encourages similar weights for spots nearby in space. No matrix inversion needed!
29.04.2025 22:21 — 👍 0 🔁 0 💬 1 📌 0
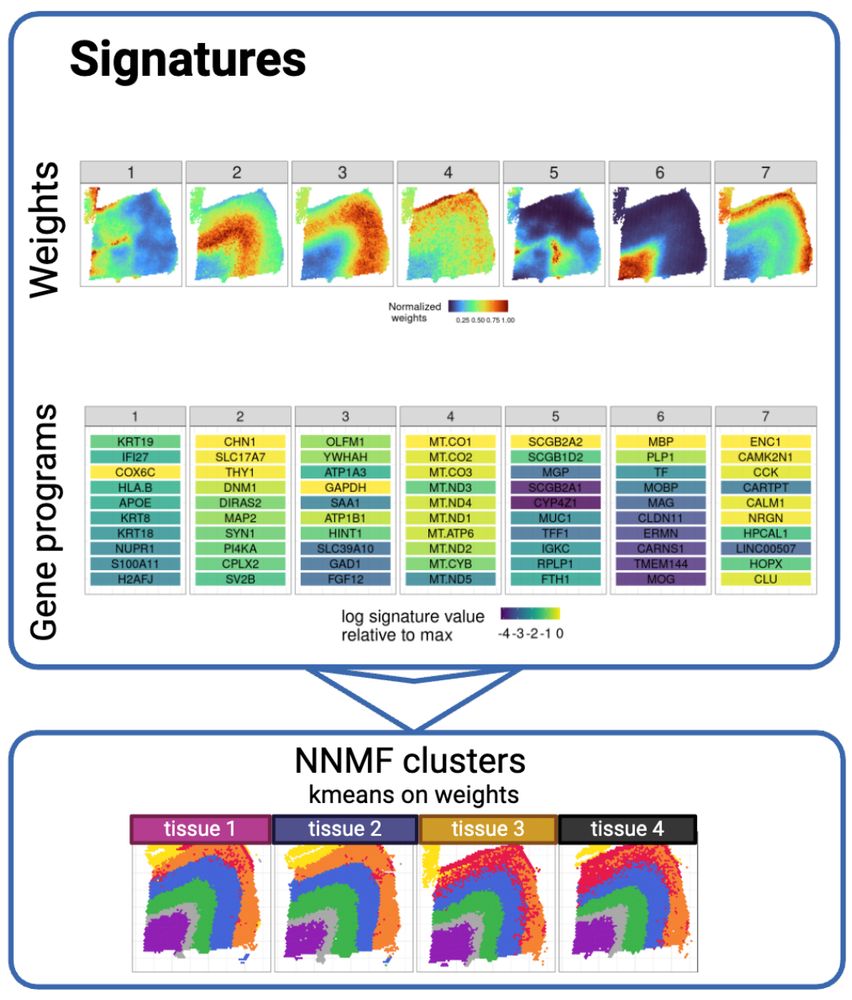
example of factor weights on mouse brain sample, and the gene programs that define each factor. Then we use K-means to built a hard clustering.
NNMF is available in R, performs nonnegative matrix factorization on the gene counts that yields soft clusterings of every spot in spatial transcriptomics, and scales to many samples, arbitrary dimensions, & millions of spots. We run K-means on the soft cluster weights to get a NNSF hard clustering.
29.04.2025 22:21 — 👍 0 🔁 0 💬 1 📌 0
Exciting update!! @bioimagearchive.bsky.social is now hosting the first publicly available Incucyte data! If you have live-cell imaging data, please consider uploading to this amazing repository!! Thanks to Julia Carnevale and Alex Marson for experimental data —
www.ebi.ac.uk/biostudies/b...
21.01.2025 01:33 — 👍 2 🔁 1 💬 0 📌 0
Me three!
28.11.2024 13:31 — 👍 1 🔁 0 💬 1 📌 0
Feedback welcome! And please play with these data! There is a lot more signal there.
Thank you to @bioimagearchive.bsky.social for hosting these Incucyte image data -- this is a new thing for them, and they have been so kind in working through the details of submission (link coming soon!)! 🎉
26.11.2024 02:00 — 👍 1 🔁 0 💬 0 📌 2
GitHub - bee-hive/occident: Github repo for Occident Website hosting Live Cell Image Data
Github repo for Occident Website hosting Live Cell Image Data - bee-hive/occident
With five new collaborations in the works, and a paper characterizing the differences using explainable AI already accepted as an oral presentation at #PSB2025 (lead by high school senior Marcus Blennemann), look for future work in this space!
www.biorxiv.org/content/10.1...
26.11.2024 02:00 — 👍 1 🔁 0 💬 1 📌 0
In summary, we found that, compared to the SH KO control condition, TCR T cells with the RASA2 KO have a longer dwell time and cripple cancer cells more effectively this way, whereas TCR T cells with the CUL5 KO proliferated more frequently upon activation, adding more T cells to the fight.
26.11.2024 02:00 — 👍 0 🔁 0 💬 1 📌 0
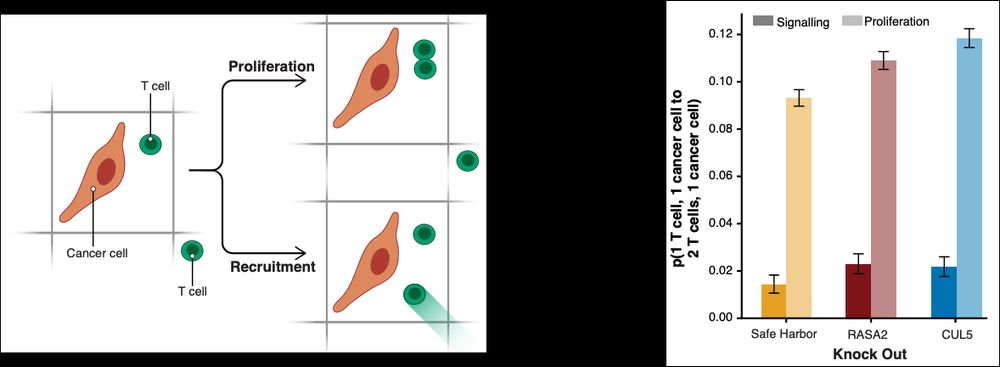
With a Markov model, we deconvolved when, in frame t-1, there is one cancer cell and one T cell in a window, and in frame t there is one cancer cell and two T cells. We were able to quantify how often this doubling of T cells attacking a cancer cell was due to proliferation or due to recruitment.
26.11.2024 02:00 — 👍 0 🔁 0 💬 1 📌 0
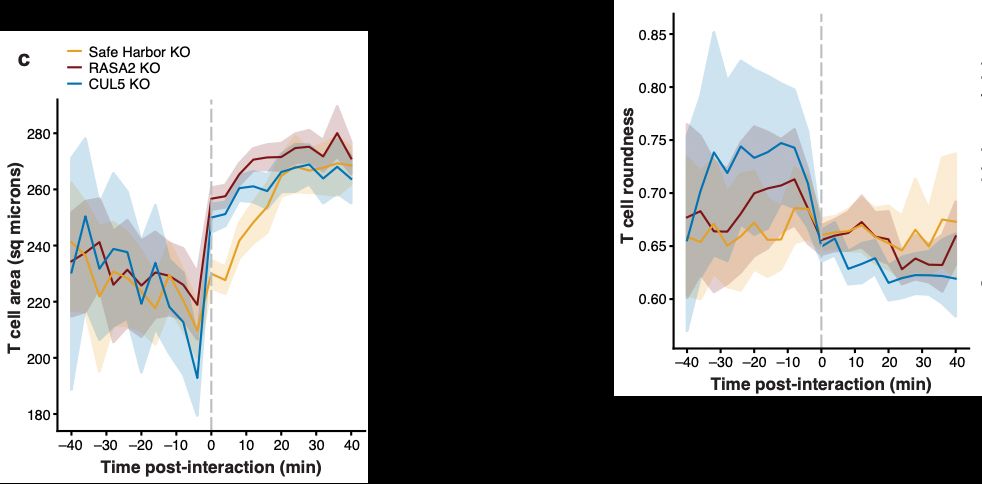
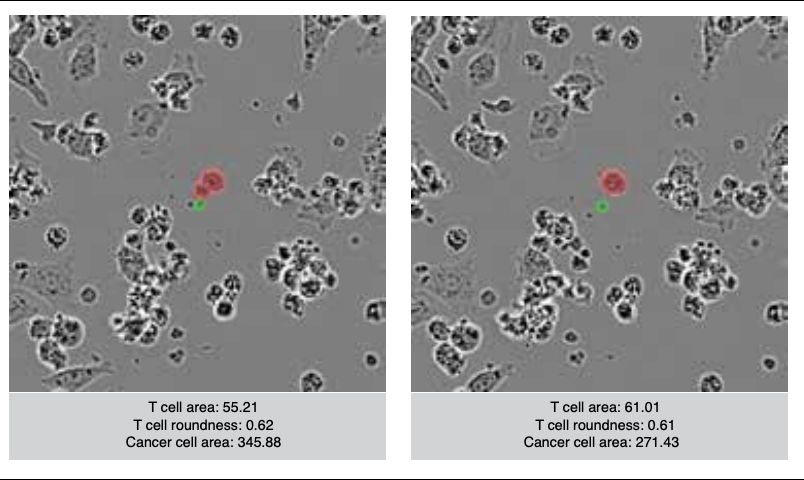
Most thrilling is that we can identify active T cells based on relative cell size and morphology, and watch T cells activate (differentially based on condition) after interacting with cancer cells.
26.11.2024 02:00 — 👍 0 🔁 0 💬 1 📌 0
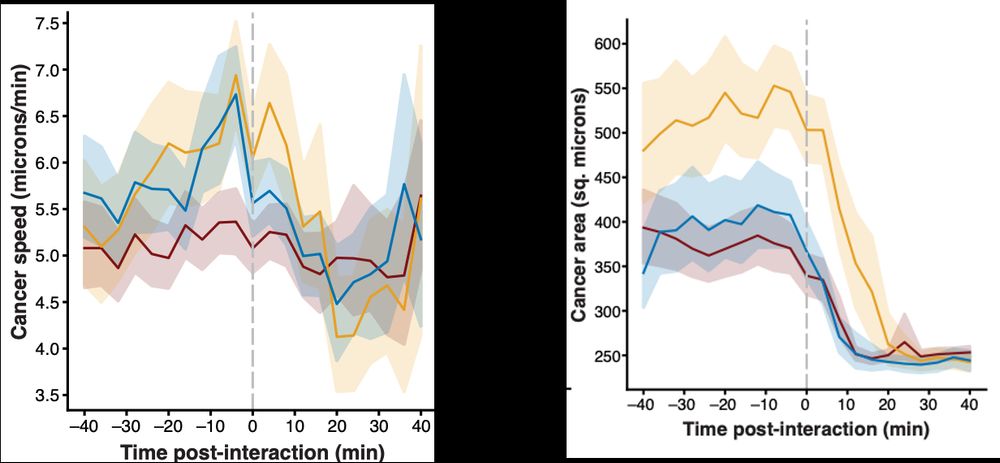
Even more exciting, the speed of cancer cells decreased after interactions with T cells, as did their overall size (indicating stress).
26.11.2024 02:00 — 👍 0 🔁 0 💬 1 📌 0
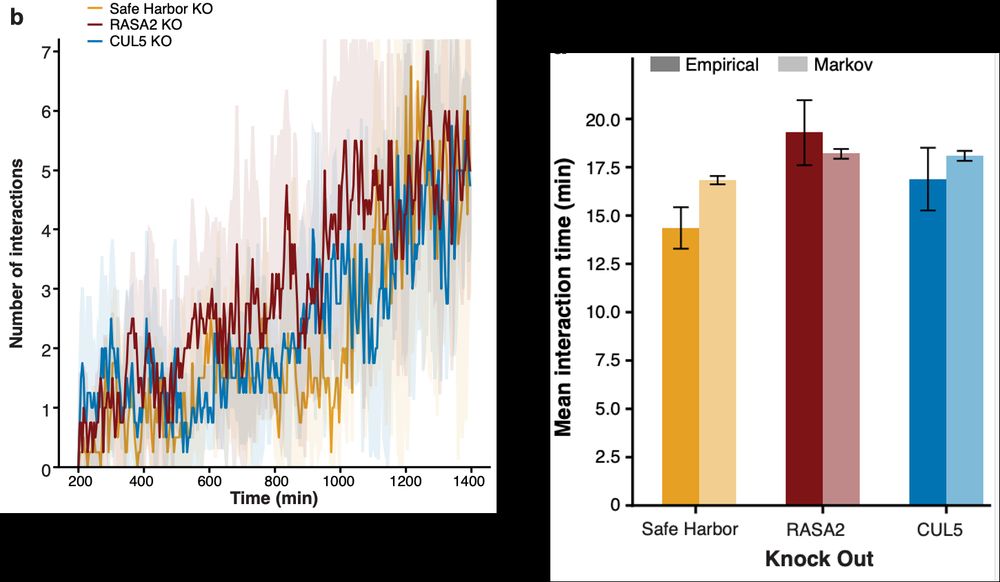
While the # of T cell--cancer cell interactions increased similarly, these interactions & their effects were modulated by the CRISPR KOs. E.g., the time a T cell remained attached to a cancer cell (as estimated by a negative binomial and Markov model separately) was highest in RASA2 KO T cells.
26.11.2024 02:00 — 👍 0 🔁 0 💬 1 📌 0
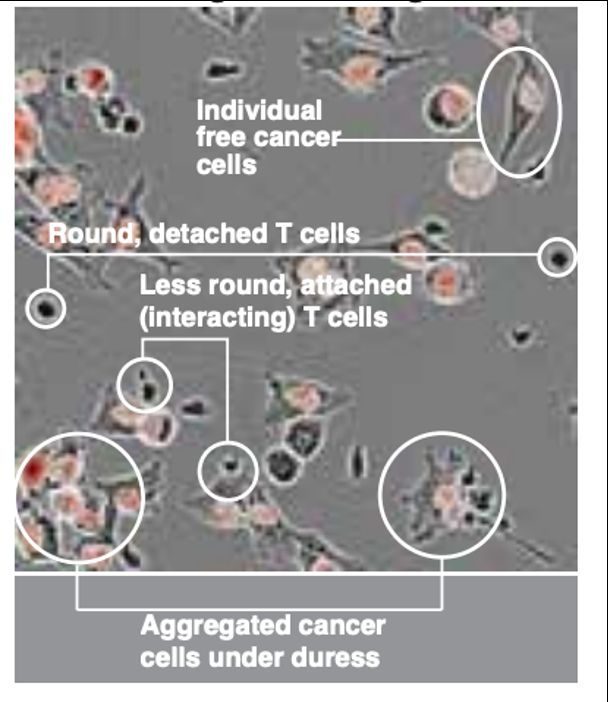
Cancer cell and T cell morphology changes dramatically depending on state. These changes are visible in the brightfield imaging – active interacting T cells are larger and change to less circular shapes. Cancer cell begin to aggregate together when interacting with T cells.
26.11.2024 02:00 — 👍 0 🔁 0 💬 1 📌 0
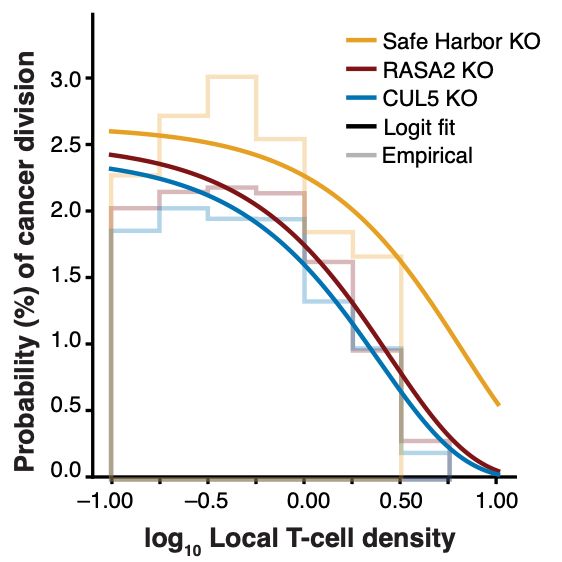
We found that the number of T cells attached to cancer cells reduces the likelihood that the cancer cell will proliferate, with the beneficial KO T cells having greater effects on proliferation reduction.
26.11.2024 02:00 — 👍 0 🔁 0 💬 1 📌 0
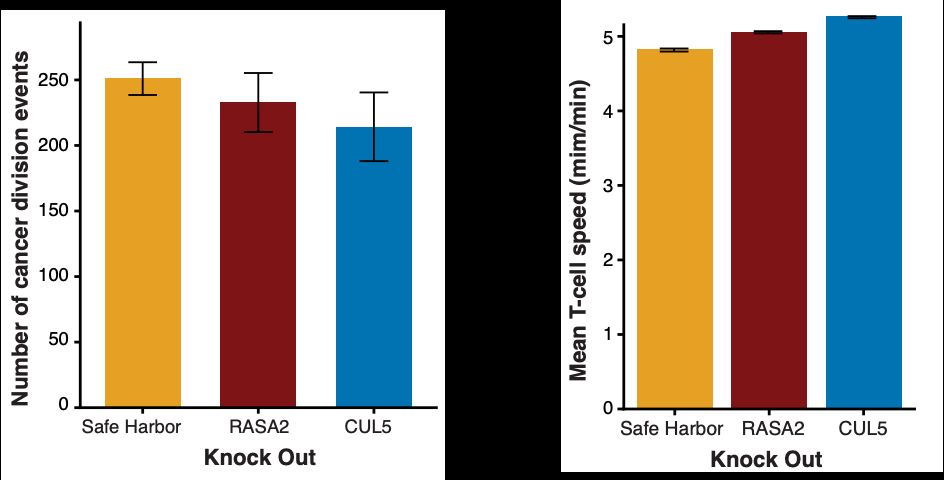
We can study differences in cancer cell division events (lower in beneficial KO T cells) and average T cell speed (faster in beneficial KO T cells).
26.11.2024 02:00 — 👍 0 🔁 0 💬 1 📌 0
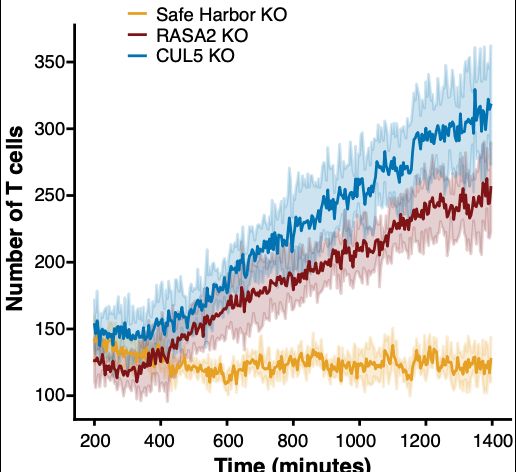
We found that T cell proliferation increased in the two beneficial KO T cells, in the CUL5 KO T cells in particular.
26.11.2024 02:00 — 👍 0 🔁 0 💬 1 📌 0
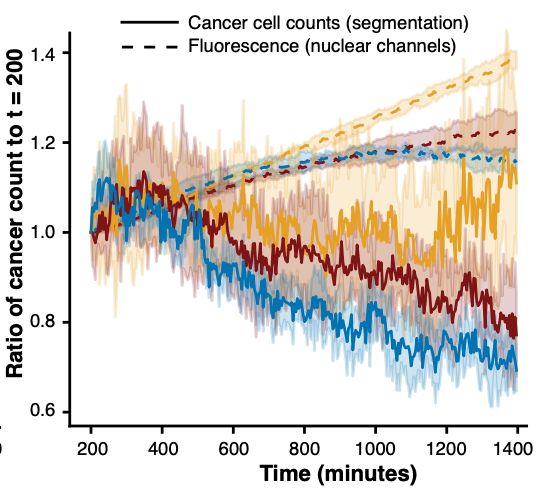
With the masked, tracked cells, we went to work to develop Occident. We were curious how well the RFP markers captured cancer cell number; we found that RFP lags as a proxy for cancer cell numbers.
26.11.2024 02:00 — 👍 0 🔁 0 💬 1 📌 0
Then, the Van Valen Lab developed Caliban to segment and track each cell (green are T cells, red are cancer cells, white are detritus).
26.11.2024 02:00 — 👍 0 🔁 0 💬 1 📌 0
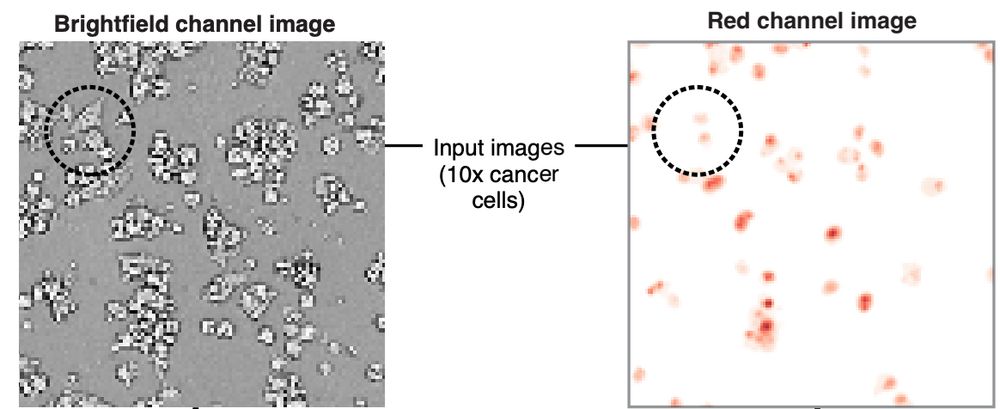
Each well was imaged every 4 minutes at 10X magnification on Sartorius Incucyte for 72 hrs. Images include brightfield, RFP (cancer cell nuclei) channels.
26.11.2024 02:00 — 👍 0 🔁 0 💬 1 📌 0

We teamed up with Alex Marson and Julia Carnevale’s Labs, who imaged TCR T cells co-cultured with RFP+ A375 tumor cells 3 ways: Safe harbor knockout (SH KO; control), RASA2 KO (Carnevale et al., 2022), CUL5 KO (Liao et al., 2024).
26.11.2024 02:00 — 👍 0 🔁 0 💬 1 📌 0
…and amazing pack hunting behaviors of the modified T cells:
26.11.2024 02:00 — 👍 0 🔁 0 💬 1 📌 0
…cancer cell death, which is quite rare in much of these data...
26.11.2024 02:00 — 👍 0 🔁 0 💬 1 📌 0
a giddy little thrill
at a reasonable price
🇵🇸
Chicagoan exiled in Maine. Non-profit extraordinaire, Gen-X, raconteur, fiesty yogi, and student of life. Writer. Send Harold's!
Temerty Professor of Modern European History, Munk School, University of Toronto; Permanent Fellow, IWM Vienna; Emeritus Levin Professor, Yale. Author of "On Freedom," "On Tyranny," "Our Malady," "Road to Unfreedom," "Black Earth," and "Bloodlands"
Official Bluesky account of New York Attorney General Letitia James' Office
Martial artist, motorcyclist, pragmatist, comics philosopher, queer phenomenologist.
Assistant Professor @CSUN. Japanese philosophy, race, gender, disability, tech/AI. Inquiries: johnathan.flowers@csun.edu
Rider of the mind shaitan. He/Him/His 🏳️🌈
Vice-president of the World Liberty Congress. Founder & Chair of the Renew Democracy Initiative. Board of the Human Rights Foundation. Father, activist, author, speaker, 13th World Chess Champion.
staff writer @theatlantic.com and senior fellow @snfagora.bsky.social. author of GULAG, IRON CURTAIN, RED FAMINE, TWILIGHT OF DEMOCRACY and AUTOCRACY INC
https://linktr.ee/anneapplebaum
News from Dr. Alex Marson's lab UCSF & Gladstone Institutes, focusing on advances in immunology, CRISPR & genomics.
An independent national nonprofit initiative that trains incarcerated writers in the tools of journalism and publishes their stories.
Subscribe: https://prisonjournalismproject.org/newsletter/?utm_campaign=Bluesky_Profile
Doting grandmother, among other things.
NYT opinion writer, Slate Money co-host, Dem messaging consultant, NYU prof, former EIC The New York Observer, Dealbreaker founder and Gawker founding editor. Brooklyn via Bama. Rednexican. Striver with no chill.
https://linktr.ee/elizabethspiers
Political scientist and author. Researching Black politics, gender & sexuality, policing, and threat. They/them. Personal acct.
🖱: Jennmjackson.com
🔗: linktr.ee/jennmjacksonphd
📚: https://tinyurl.com/blackwomentaught
jennmjacksonphd.substack.com
Fighter. Neo-Swoletariat.
Ex-Washington Post.
Substack: https://substack.com/@karenattiah?r=2bz6j&utm_medium=ios
Rogue Radical Professor: @resistanceschool.bsky.social
Race, Media + International Affairs Class: https://www.resistancesummerschool.com
Ecologist, entomologist, writer. Chair of Academic Senate and Professor at CSU Dominguez Hills. ScienceForEveryone.science and I'm the Small Pond Science guy.
he/him
Black Lives Matter. In favor of DEI, justice, access, opportunity. Abolish ICE.
Howard Hughes Medical Institute (HHMI) believes in the power of individuals to advance science through research and science education, making discoveries that benefit humanity.
Entertainer, opinionator, lover of pets.
We live under an alternative rock http://mylinx.cc/eve6
Wisconsinite. Dad. Former Chair, @wisdems.org
https://secure.actblue.com/donate/comms2026?refcode=blusky