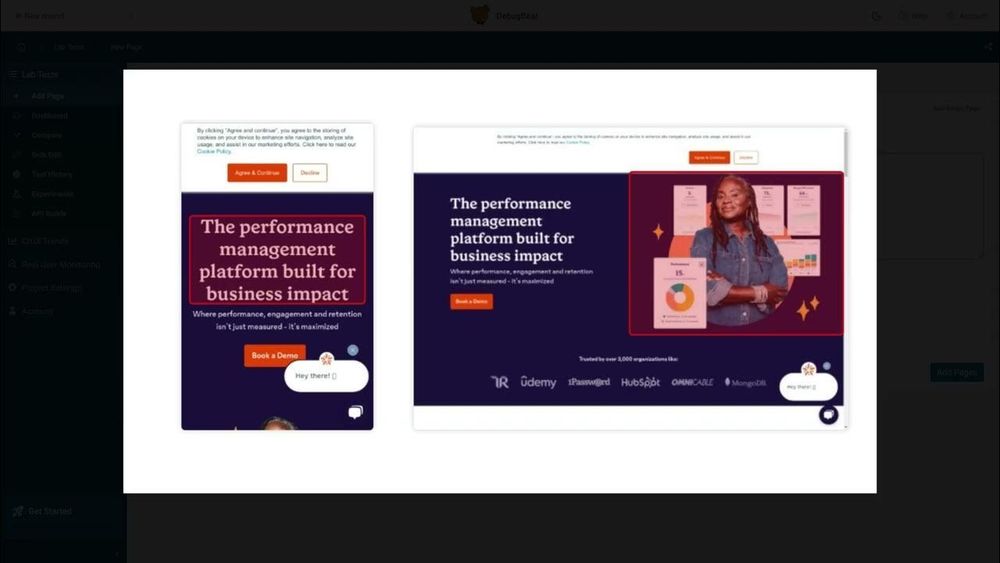
Find out how to take your website performance to the next level! This video offers a step-by-step guide to set a baseline, identify bottlenecks, and run experiments before making changes. Learn about…
How I optimized my website for fast performance: 3 quick wins!
Looking for a real-world example of how to fix your slow website? In our new video we walk you through all the steps:
📊 Establish a baseline
🕵️♂️ Identify issues
🧪 Try out optimizations
🚀 Speed up your live site
www.youtube.com/watch?v=KxBW...
04.08.2025 14:56 — 👍 0 🔁 0 💬 0 📌 0
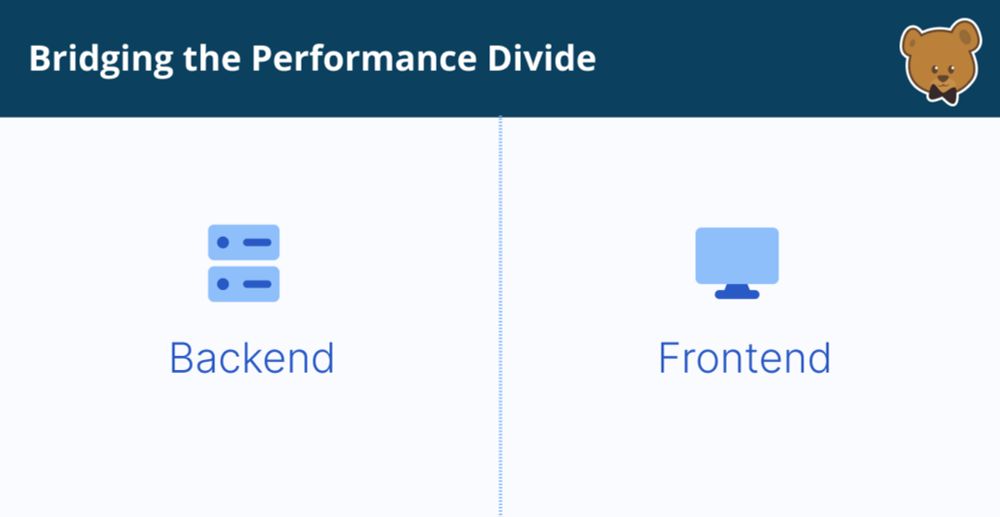
⚡Scott Moore, a 25+ year performance engineering veteran, talk about what it takes to balance frontend and backend optimization!
Watch the full video to find out more about holistic web performance: youtu.be/p6gwO52BIsA?...
30.07.2025 09:07 — 👍 0 🔁 0 💬 0 📌 0
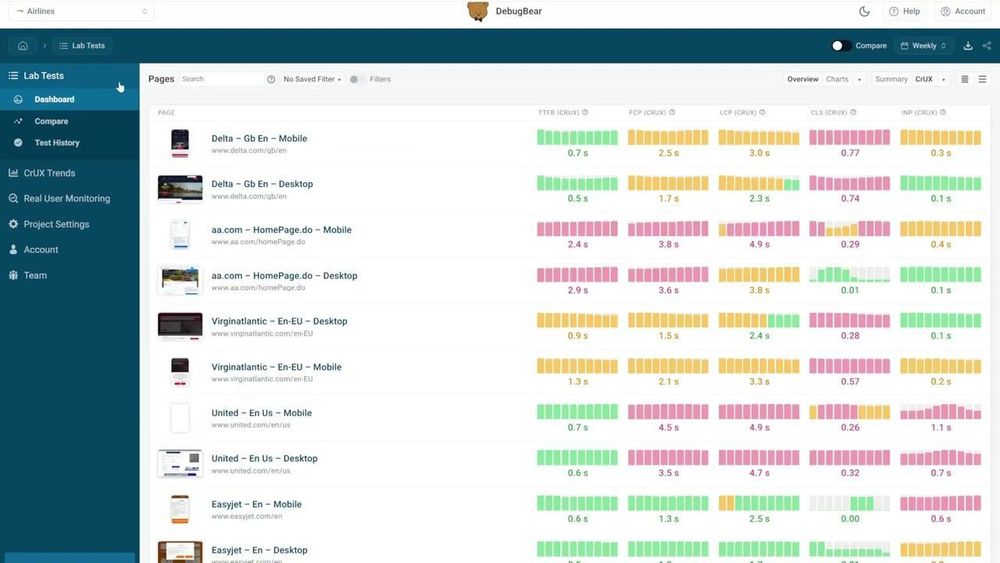
Compare your website to your competition using data from Google's Chrome User Experience Report (CrUX).
0:00 - Intro
0:27 - CrUX trends tab
0:41 - Why looking at different devices is important
1:52 - Edit domains
2:20 - Ratings graph
2:49 - 75th percentile graph
Sign up for a free trial: http://www.debugbear.com/signup
Benchmark website performance with DebugBear’s CrUX Dashboard
🥇 Wondering how your website performance compares to others in your industry?
Learn how to use data from Google's Chrome User Experience report to create an industry benchmark.
www.youtube.com/watch?v=MQfu...
28.07.2025 14:55 — 👍 0 🔁 0 💬 0 📌 0
🌍 The evolution of web performance is fascinating!
🚀 Back in the early '90s, we shifted from mainframes to client-server systems, with databases and app servers at the core. Then came the web—browsers became the client!
Curious about this journey? Watch the full video: youtu.be/p6gwO52BIsA?...
25.07.2025 08:33 — 👍 0 🔁 0 💬 0 📌 0
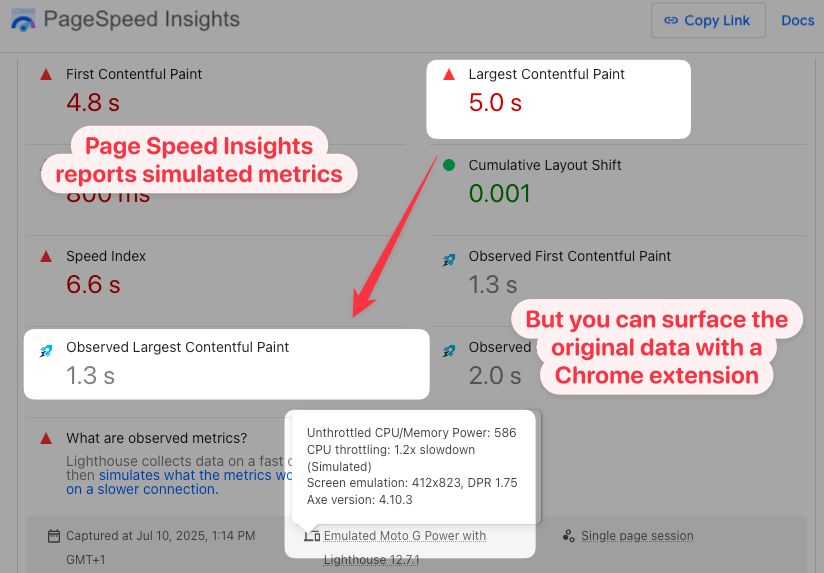
Want to see the values PageSpeed Insights measured on your website in addition to the simulated ones from the Lighthouse report?
Our Chrome extension surfaces this data for you: chromewebstore.google.com/detail/site-...
23.07.2025 12:26 — 👍 0 🔁 0 💬 0 📌 0
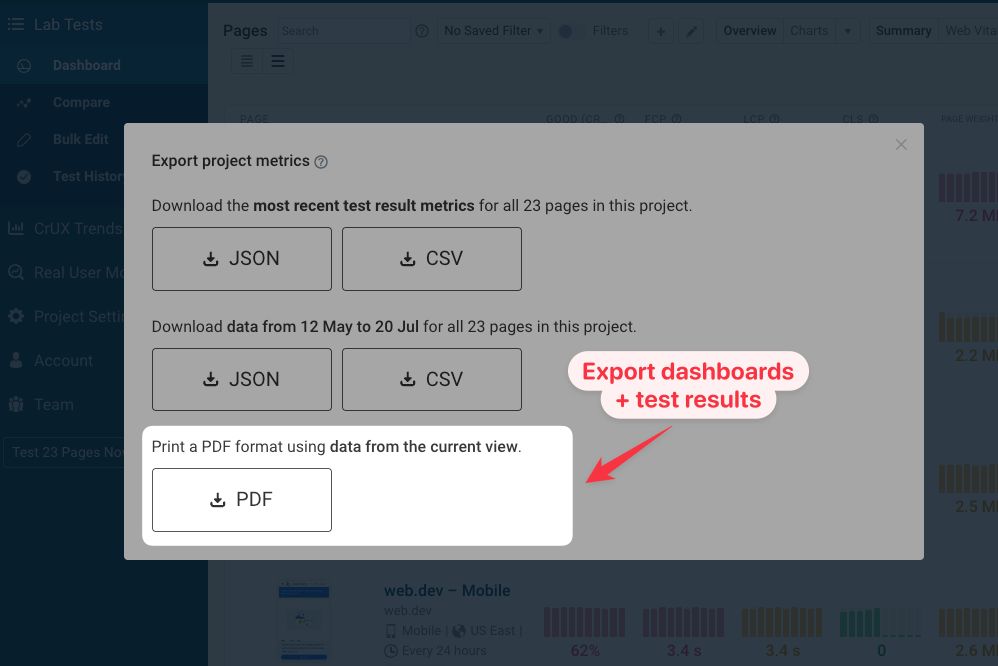
We recently added support for exporting dashboards and page speed test results as a PDF!
In addition to that you can:
📊 Export metrics as CSV and JSON
🎥 Download video recordings as MP4
💻 Export test results through our API
www.debugbear.com/docs/data-ex...
22.07.2025 13:43 — 👍 0 🔁 0 💬 0 📌 0
🖥️ One big insight from Steve Souder’s book (High Performance Web Sites) sparked a revolution in web performance in the mid-2000’s!
🌐 80-90% of a website’s load happens on the frontend.
Want to dive deeper into this history lesson? Watch the full video here: youtu.be/p6gwO52BIsA?...
21.07.2025 09:09 — 👍 1 🔁 0 💬 0 📌 0
YouTube video by DebugBear
DebugBear Advanced Settings: Configure Warm Load, Cookies, Basic Auth & More
Want to test cached page loads, staging websites, or hide a cookie banner?
Our new video explains how to use DebugBear advanced settings to achieve this and more.
www.youtube.com/watch?v=DjXo...
17.07.2025 12:32 — 👍 1 🔁 0 💬 0 📌 0
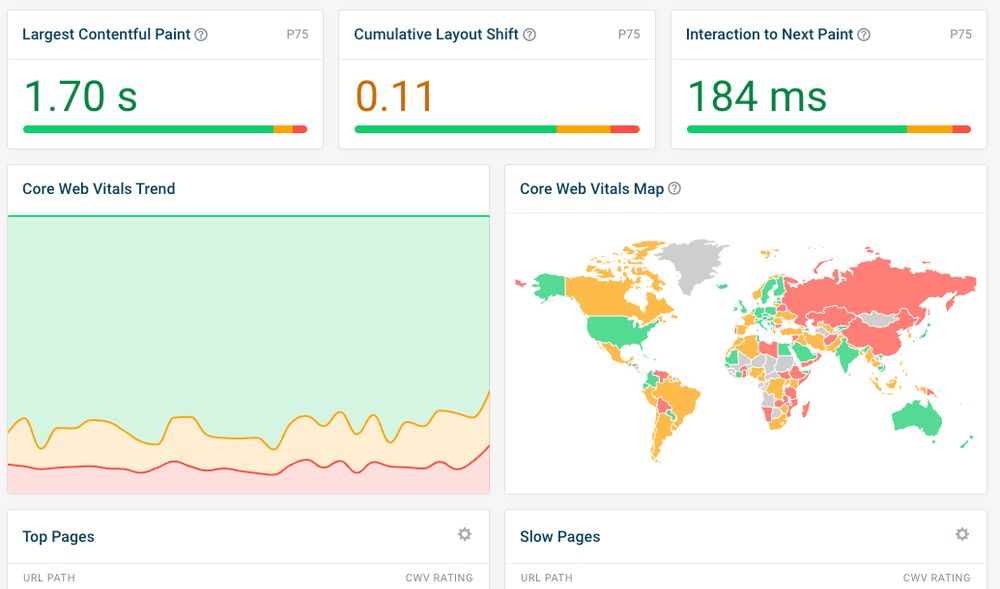
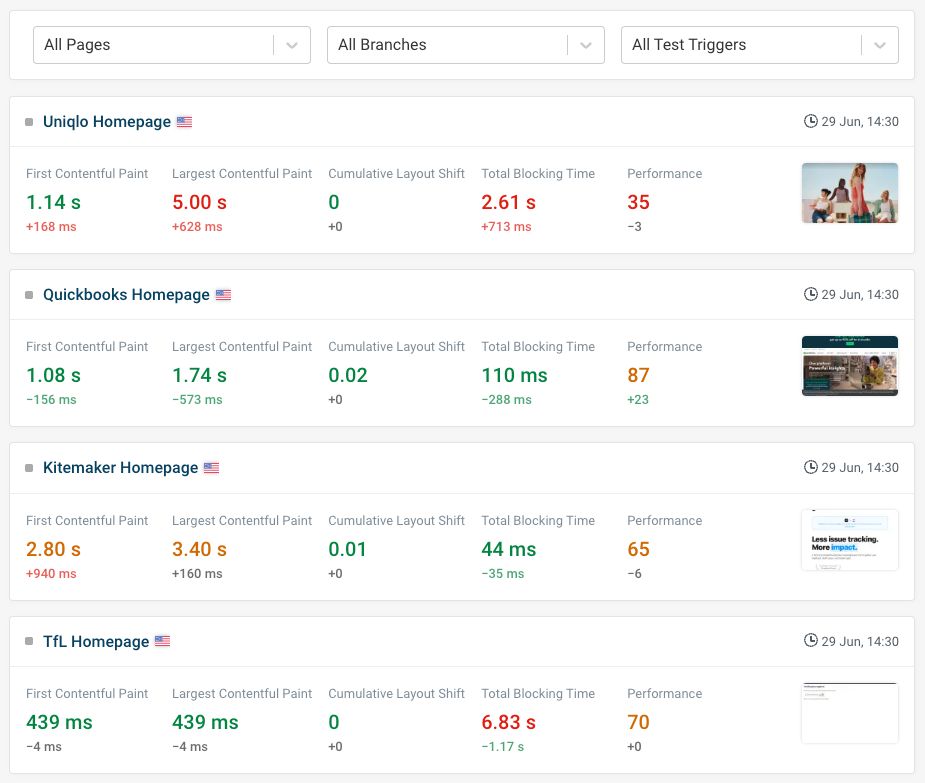
New in our real user web vitals dashboards:
🌍 Get a high-level overview more easily
🐢 Identify slow pages
www.debugbear.com/real-user-mo...
10.07.2025 09:04 — 👍 0 🔁 0 💬 0 📌 0
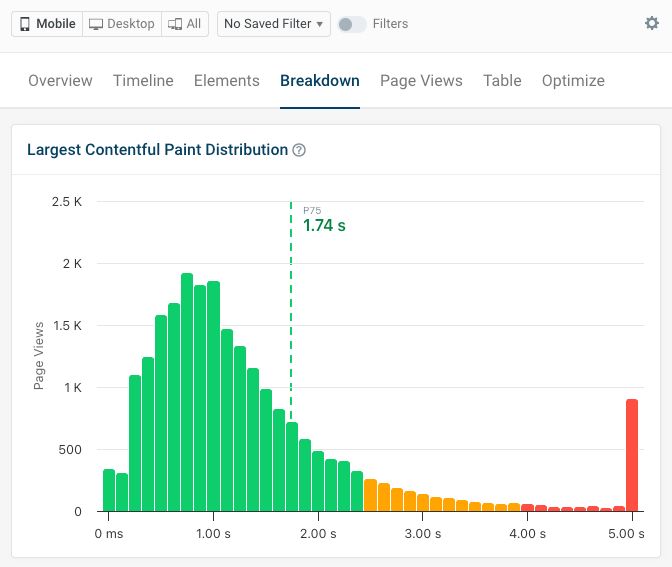
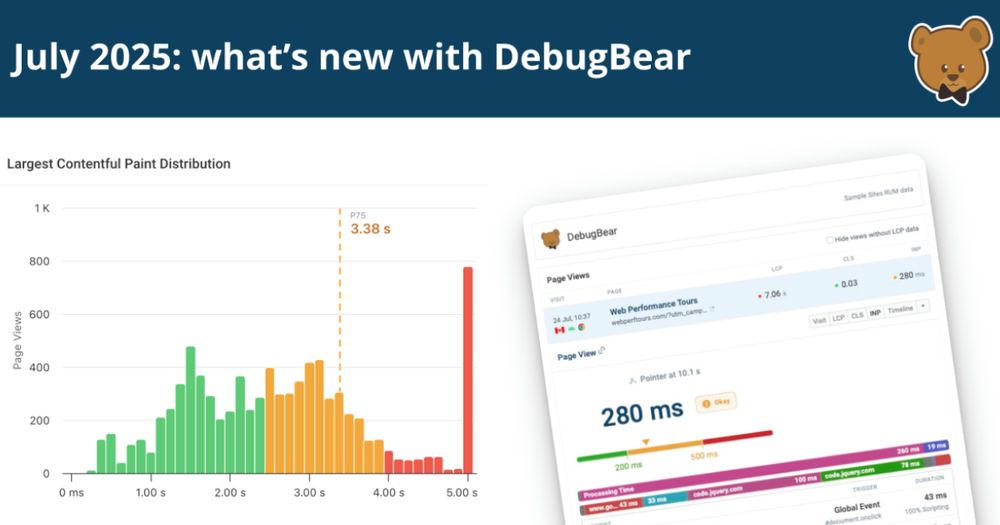
📊 Small update to our real user monitoring tool: the histogram now shows a line indicating the average metric value!
Btw: you can select whether that average shows the mean, p50, p75, or p90. By default we show the 75th percentile, like Google's real user metrics.
03.07.2025 09:48 — 👍 2 🔁 0 💬 0 📌 0
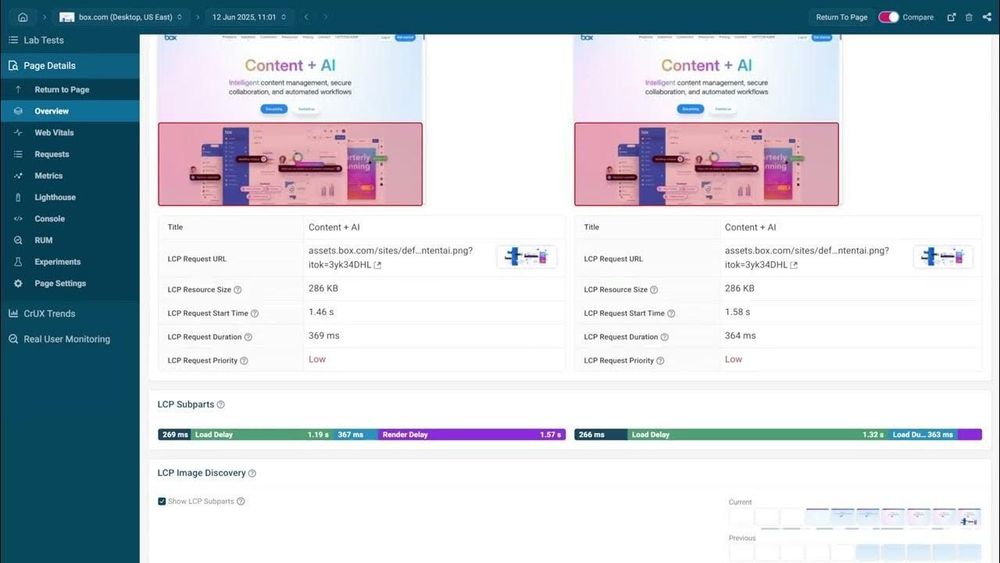
🔻 When you notice a page speed regression, how do you know what caused the change?
Our new video explains how to compare different test results to spot why your metrics have changed.
Plus, learn how to show off a before and after video after fixing an issue!
www.youtube.com/watch?v=iCkx...
02.07.2025 14:55 — 👍 0 🔁 0 💬 0 📌 0
✨ We've done some work to clean up the test history view.
Plus, if the page experiments tab now also shows any previous experiments you've run.
30.06.2025 14:55 — 👍 0 🔁 0 💬 0 📌 0
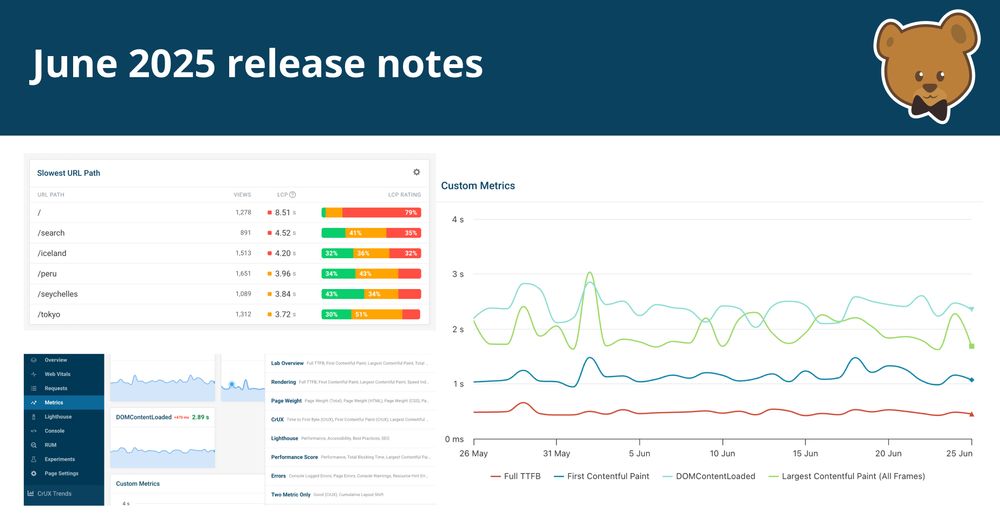
June 2025 Release Notes | DebugBear
Now you can your website's slowest URLs, spot changes in pageviews, create multi-metric graphs, and check caching headers in waterfall charts.
Our product updates for June:
🐌 Track down the slowest URLs on your website
👀 Spot changes in page view count
📈 Create multi-metric graphs of your key stats
🔎Check your page caching using HTTP headers
Plus new blog posts and videos! Read all about it here: www.debugbear.com/changelog/ju...
27.06.2025 14:55 — 👍 0 🔁 0 💬 0 📌 0
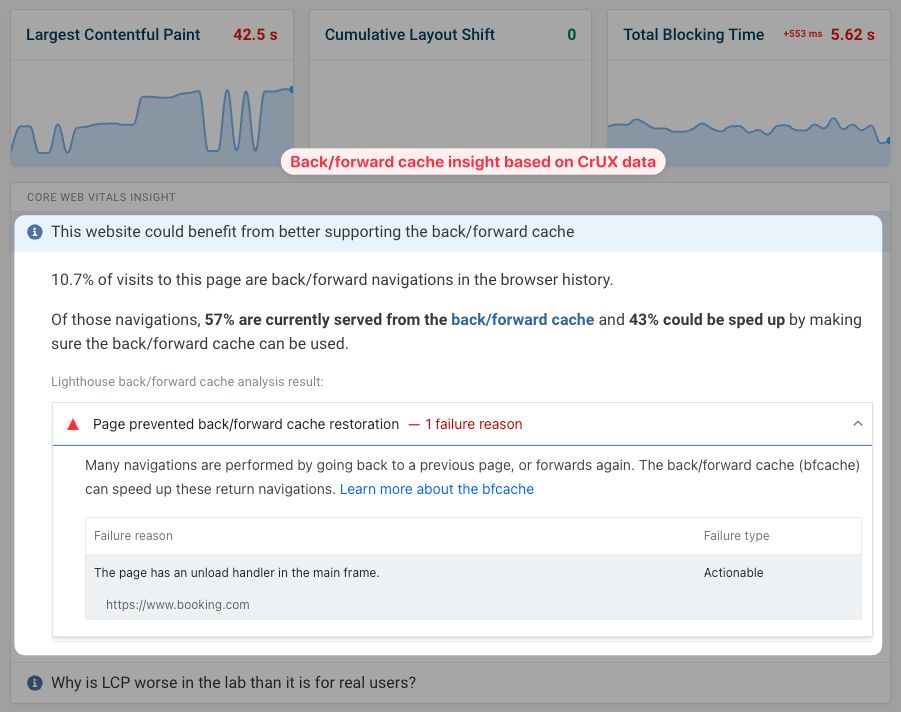
Could your website be faster if it better supported the back/forward cache?
Our new web vitals insights checks Google CrUX data to see how often cache restoration fails on your site.
Try it out, it's in the Web Vitals tab of our free test result: www.debugbear.com/test/website...
26.06.2025 15:28 — 👍 0 🔁 0 💬 0 📌 0
performance.now(); 30th and 31st of October, Amsterdam
On 30th and 31st of October, 2025, the sixth edition of performance.now() will take place in Amsterdam—a single track conference, covering today’s most important web performance insights.
performance.now(), the web performance conference, 30th and 31st of October, Amsterdam. Single track, the best speakers in the industry, plenty of your performance-mad peers around to have fascinating conversations. What's not to like? Let's introduce our speakers ...
perfnow.nl
25.06.2025 12:34 — 👍 24 🔁 16 💬 1 📌 5

How To Use The Browser Console: An In-Depth Guide | DebugBear
The Console tab in Chrome DevTools is extremely feature-packed! Learn how to get started and explore its more advanced features.
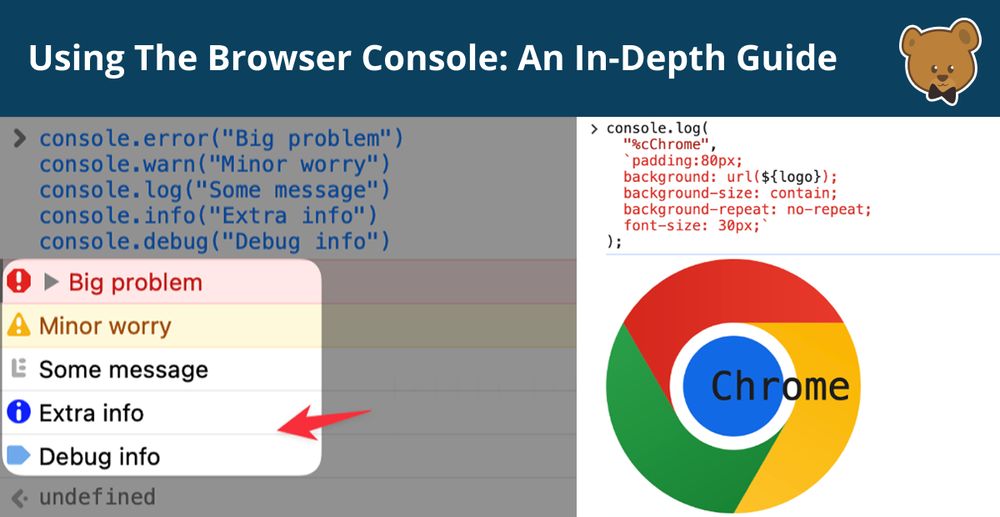
I thought the browser console was simple... I was wrong 🤯
It's actually packed with hidden features:
🖼️ Logging images
✨ AI explanations
🥹 Logging tables
🔧 Console utilities ($0, $_, ...)
🔎 Advanced filters
🔥 Live expressions
New article below!
www.debugbear.com/blog/chrome-...
12.06.2025 08:54 — 👍 7 🔁 3 💬 0 📌 0
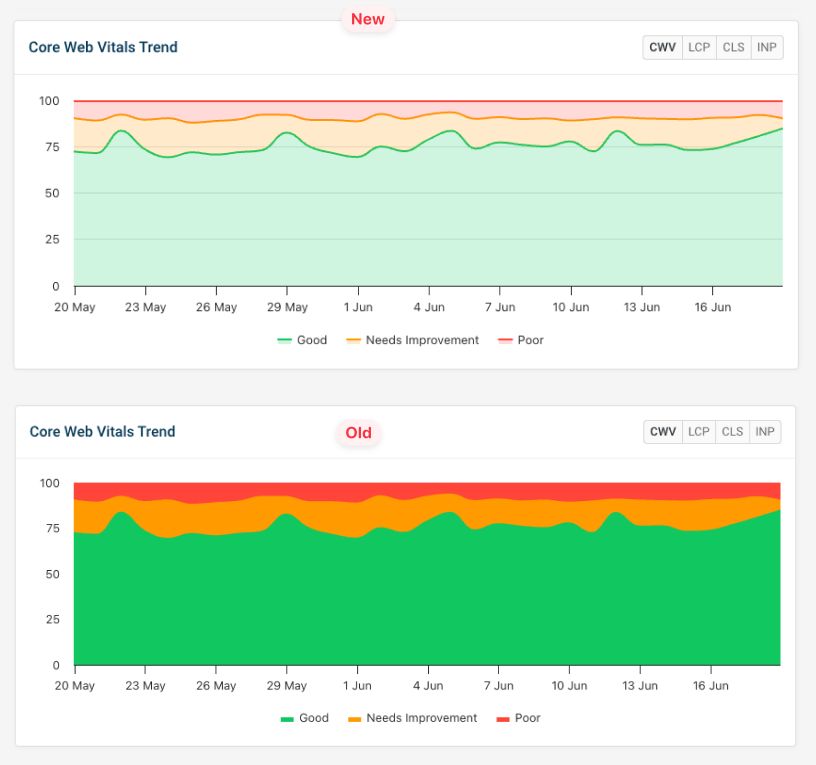
We've been doing some design work on our real user monitoring product!
www.debugbear.com/real-user-mo...
19.06.2025 14:45 — 👍 0 🔁 0 💬 0 📌 0
In this video, we take a look at how to analyze page speed test results with DebugBear lab testing. Sign up for a free 14 day trial: https://www.debugbear.co...
Introduction To Page Speed Test Results On DebugBear
⏱️ How do you read a page speed test result?
This video explains how to understand the metrics, UX insights, and technical reporting from our web performance tests.
www.youtube.com/watch?v=Mtyf...
18.06.2025 16:09 — 👍 1 🔁 0 💬 0 📌 0
How To Use The Browser Console: An In-Depth Guide | DebugBear
The Console tab in Chrome DevTools is extremely feature-packed! Learn how to get started and explore its more advanced features.
The browser console is great for checking log output and running JavaScript. But there are actually a lot more feature than it first appears!
⬇️ Our new article takes an in-depth look at the console tab in Chrome DevTools. ⬇️
www.debugbear.com/blog/chrome-...
12.06.2025 14:55 — 👍 2 🔁 0 💬 0 📌 0
Learn what the Speed Index metric measures and how you can improve Speed Index for you website.00:00 Introduction00:12 What is Speed Index?00:45 How is Speed...
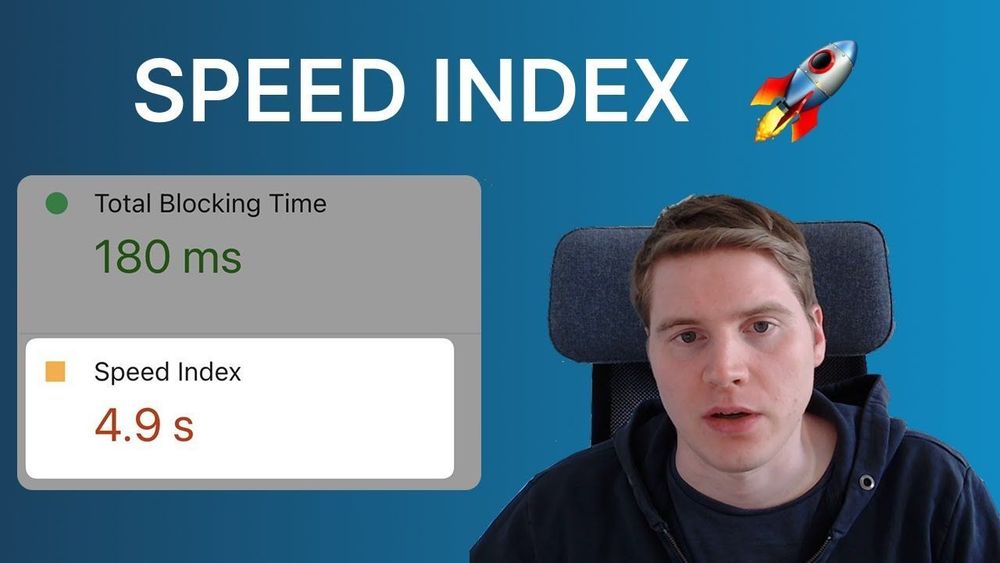
How to fix Speed Index on PageSpeed Insights
Speed Index is one of the metrics that impact the Lighthouse performance score.
But do you know how it's actually calculated? It's very different from other metrics!
🎥 Our new video explains how Speed Index works ⬇️
www.youtube.com/watch?v=HnMj...
11.06.2025 14:55 — 👍 0 🔁 0 💬 0 📌 0
In this video we explain how to scan your website with DebugBear. Sign up for a free trial: http://www.debugbear.com/signup0:00 - Why monitoring is important...
How to set up Synthetic Monitoring in DebugBear
🎥 New video: learn how to set up synthetic page speed monitoring for your website on DebugBear!
www.youtube.com/watch?v=l7eB...
10.06.2025 14:55 — 👍 0 🔁 0 💬 0 📌 0
Co-founder at forgemedia LLC. Previously CMO at Kinsta. I craft actionable content derived from first-hand experience and develop performance-driven WordPress plugins. ⚡
👨💻 Agency: forgemedia.io
📧 Newsletter: newsletter.brianleejackson.com
Network protocols (HTTP/2, HTTP/3, QUIC) and Web performance
at Akamai. PhD. Dad. Longsword fencer. He/Him.
http://linkedin.com/in/rmarx
@programmingart@mastodon.social
I work on the Chrome User Experience Report (CrUX). Opinions (if any) are my own.
🖥️ Lead Engineer (Web Team) at Arnold Clark
✏️ HTML/CSS/UX/WebPerf obsessive
👦👧👧 Daddy
🍕 Vaguely Italian
🏴 Mostly Scottish
🎮 Mario/Zelda/Halo fan
🤷♂️ Emoji enthusiast
A single track conference with fourteen world-class sessions covering today’s most important web performance insights. #perfnow
https://perfnow.nl
30th and 31st of October, Amsterdam
🏡 https://roe.dev
➕ building @nuxt.com • @nitro.build • https://elk.zone
💝 https://page-speed.dev • https://firstcommit.is • https://react-to-nuxt.com
🏅 Google GDE • Microsoft MVP • GitHub ⭐️
🧗♂️ ⛷️ 🚴♂️ ✝️
📍 edinburgh 🏴
Space/tech/music/kindness light my fire. Supporting STEM & education initiatives with Big Change & Mission 44; founded a scholarship at Virgin Galactic. I work for Bloomberg; opinions my own. I try and keep up with myself at https://pcwilliams.design
JavaScript Infrastructure & Tooling @Bloomberg @TC39, creator of Boa (JS Engine)
I contain multitudes, but for brevity: reader, writer, speaker, baker, quilter, yoga-er, mom-joke teller, lover of lakes and mountains.
Fighting the good #UX / #webperf fight as CXO at @speedcurve.com & co-chair of @perfnow.bsky.social.
Lead UI Developer at Field Intelligence and public speaker. Google Developer Expert in web technologies. I am all about web performance and tech conferences.
Chrome Web Platform Engineer (Core Web Vitals). USDS alum. Mom. Loves OCR training, making and crafting. Hates facists.
🚀 Independent Web Performance Consultant • Speaker • Google Developer Expert, Web Performance • Accepting new clients • https://harry.is/for-hire
Principal Frontend Engineer at Square, formerly Etsy. Fairy Gitmother at ohshitgit.com. Thoughts are mine not my employer’s #GNUTerryPratchett
Principal Product Manager @cloudflare—focused on performance and observability.
Co-chair of https://perfnow.nl
Taller than my photo looks.
Trying to make a web that works for everyone.
Also at https://toot.cafe/@slightlyoff
For more: https://infrequently.org/about-me/
#accessibility / #a11y advocate, post enjoyer.
🌐 https://ericwbailey.website/
✉️ https://ericwbailey.website/newsletter/
CEO & Co-founder @RUMvision | Simplifying web performance | Women in tech advocate | Toddler mom | International speaker | Lover of memes | Co-chair RUM W3C | Board member Mage-OS NL
Feels like this bio is getting really long😅
Lead Software Engineer, Frontend Dev, Speaker, Eng Manager (she/her) | GDE Web Tech, Microsoft Regional Director (MVP program) | http://instagram.com/adognamedjello